Deck 6: Integration
ملء الشاشة (f)
سؤال
Find 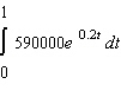 . Round your answer to the nearest integer.
A)
B)
C)
D)
E)
. Round your answer to the nearest integer.A)
B)
C)
D)
E)
سؤال
Suppose an investment is expected to generate income at the rate of 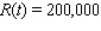 dollars/year for the next 6 years. Find the present value of this investment if the prevailing interest rate is 8% / year compounded continuously. Round your answer to the nearest dollar.
A) $950,930
B) $953,042
C) $951,802
D) $957,375
dollars/year for the next 6 years. Find the present value of this investment if the prevailing interest rate is 8% / year compounded continuously. Round your answer to the nearest dollar.A) $950,930
B) $953,042
C) $951,802
D) $957,375
سؤال
A certain country's income distribution is described by the function 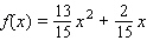 Compute
  and
and  .
.
A)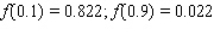
B)
C)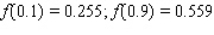
D)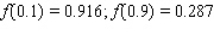
E)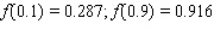
Compute and .A)
B)
C)
D)
E)
سؤال
سؤال
The management of the Titan Tire Company has determined that the quantity demanded x of their Super Titan tires/week is related to the unit price p by the relation  where p is measured in dollars and x is measured in units of a thousand. Titan will make x units of the tires available in the market if the unit price is
  dollars. Determine the consumers' surplus and the producers' surplus when the market unit price is set at the equilibrium price. Round your answers to the nearest dollar.
A) CS = $337,012 , PS = $174,988
B) CS = $343,476 , PS = $168,524
C) CS = $341,333 , PS = $170,667
D) CS = $342,567 , PS = $169,433
where p is measured in dollars and x is measured in units of a thousand. Titan will make x units of the tires available in the market if the unit price is dollars. Determine the consumers' surplus and the producers' surplus when the market unit price is set at the equilibrium price. Round your answers to the nearest dollar.A) CS = $337,012 , PS = $174,988
B) CS = $343,476 , PS = $168,524
C) CS = $341,333 , PS = $170,667
D) CS = $342,567 , PS = $169,433
سؤال
سؤال
سؤال
The demand function for a certain make of replacement cartridges for a water purifier is given by 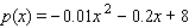 where p is the unit price in dollars and x is the quantity demanded each week, measured in units of a thousand. Determine the consumers' surplus if the market price is set at $5/cartridge. Round your answer to the nearest dollar.
A) $16,333
B) $16,800
C) $16,667
D) $16,886
where p is the unit price in dollars and x is the quantity demanded each week, measured in units of a thousand. Determine the consumers' surplus if the market price is set at $5/cartridge. Round your answer to the nearest dollar.A) $16,333
B) $16,800
C) $16,667
D) $16,886
سؤال
In a study conducted by a certain country's Economic Development Board, it was found that the Lorentz curve for the distribution of income of college teachers was described by the function  and that of lawyers by the function
  Compute the coefficient of inequality for each Lorentz curve. Round your answer to four decimal places. Which profession has a more equitable income distribution?
A) ,
,
 , college teachers
B) ,
,
 , college teachers
C) ,
,
 , college teachers
D) ,
,
 , college teachers
and that of lawyers by the function Compute the coefficient of inequality for each Lorentz curve. Round your answer to four decimal places. Which profession has a more equitable income distribution?A)
, , college teachersB)
, , college teachersC)
, , college teachersD)
, , college teachers سؤال
سؤال
سؤال
A firm purchased a 16-year franchise for a computer outlet store that is expected to generate income at the rate of  dollars per year. If the prevailing interest rate is 10% per year compounded continuously, find the present value of the franchise.
A) $1,114,979
B) $2,250,532
C) $4,660,006
D) $3,192,414
E) $1,756,632
dollars per year. If the prevailing interest rate is 10% per year compounded continuously, find the present value of the franchise.A) $1,114,979
B) $2,250,532
C) $4,660,006
D) $3,192,414
E) $1,756,632
سؤال
A certain country's income distribution is described by the function  Sketch the Lorentz curve for this function. Compute
  and
and  and interpret your results.
A)
 ;
;
 The lowest 10 percent of the people receive 1.5 percent of the total income.
The lowest 30 percent of the people receive 10.1 percent of the total income.
B)
 ;
;
 The lowest 10 percent of the people receive 1.5 percent of the total income.
The lowest 30 percent of the people receive 10.1 percent of the total income.
C)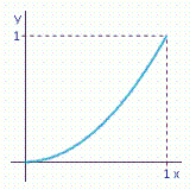
 ;
;
 The lowest 30 percent of the people receive 1.5 percent of the total income.
The lowest 10 percent of the people receive 10.1 percent of the total income.
Sketch the Lorentz curve for this function. Compute and and interpret your results.A)
; The lowest 10 percent of the people receive 1.5 percent of the total income.The lowest 30 percent of the people receive 10.1 percent of the total income.
B)
; The lowest 10 percent of the people receive 1.5 percent of the total income.The lowest 30 percent of the people receive 10.1 percent of the total income.
C)
; The lowest 30 percent of the people receive 1.5 percent of the total income.The lowest 10 percent of the people receive 10.1 percent of the total income.
سؤال
The demand function for a certain brand of compact disc is given by 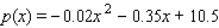 The supply function for the compact discs of is given by
 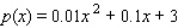 where p is the wholesale unit price in dollars and x is the quantity demanded each week, measured in units of a thousand. Determine the producers' surplus if the wholesale market price is set at the equilibrium price. Round your answer to the nearest dollar.
A) $11,894
B) $11,667
C) $11,792
D) $11,346
The supply function for the compact discs of is given by where p is the wholesale unit price in dollars and x is the quantity demanded each week, measured in units of a thousand. Determine the producers' surplus if the wholesale market price is set at the equilibrium price. Round your answer to the nearest dollar.A) $11,894
B) $11,667
C) $11,792
D) $11,346
سؤال
سؤال
It is known that the quantity demanded of a certain make of portable hair dryer is x hundred units/week and the corresponding wholesale unit price is 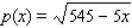 dollars. Determine the consumers' surplus if the wholesale market price is set at $20/unit. Round your answer to the nearest dollar.
A) $5,093
B) $5,217
C) $4,975
D) $4,661
dollars. Determine the consumers' surplus if the wholesale market price is set at $20/unit. Round your answer to the nearest dollar.A) $5,093
B) $5,217
C) $4,975
D) $4,661
سؤال
The quantity demanded  (in units of a hundred) of the miniature cameras per week is related to the unit price
  (in dollars) by
  and the quantity
  (in units of a hundred) that the supplier is willing to make available in the market is related to the unit price
  (in dollars) by
 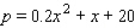 If the market price is set at the equilibrium price, find the consumers' surplus and the producers' surplus. Please round the answers to the nearest dollar.
A) The consumers' surplus: $26,704, the producers' surplus: $142,718
B) The consumers' surplus: $142,718, the producers' surplus: $26,704
C) The consumers' surplus: $18,333, the producers' surplus: $20,000
D) The consumers' surplus: $20,000, the producers' surplus: $18,333
E) The consumers' surplus: $44,040, the producers' surplus: $21,478
(in units of a hundred) of the miniature cameras per week is related to the unit price (in dollars) by and the quantity (in units of a hundred) that the supplier is willing to make available in the market is related to the unit price (in dollars) by If the market price is set at the equilibrium price, find the consumers' surplus and the producers' surplus. Please round the answers to the nearest dollar.A) The consumers' surplus: $26,704, the producers' surplus: $142,718
B) The consumers' surplus: $142,718, the producers' surplus: $26,704
C) The consumers' surplus: $18,333, the producers' surplus: $20,000
D) The consumers' surplus: $20,000, the producers' surplus: $18,333
E) The consumers' surplus: $44,040, the producers' surplus: $21,478
سؤال
The demand function for a certain brand of compact disc is given by 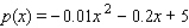 where p is the wholesale unit price in dollars and x is the quantity demanded each week, measured in units of a thousand. Determine the consumers' surplus if the wholesale market price is set at $2/disc. Round your answer to the nearest dollar.
A) $16,346
B) $16,790
C) $16,880
D) $16,667
where p is the wholesale unit price in dollars and x is the quantity demanded each week, measured in units of a thousand. Determine the consumers' surplus if the wholesale market price is set at $2/disc. Round your answer to the nearest dollar.A) $16,346
B) $16,790
C) $16,880
D) $16,667
سؤال
سؤال
Find 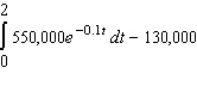 . Round your answer to the nearest integer.
A) 866,981
B) 912,104
C) 854,636
D) 851,747
. Round your answer to the nearest integer.A) 866,981
B) 912,104
C) 854,636
D) 851,747
سؤال
سؤال
In a study conducted by a certain country's Economic Development Board, it was found that the Lorentz curve for the distribution of income of stockbrokers was described by the function 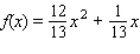 and that of high school teachers by the function
 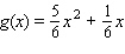 Compute the coefficient of inequality for each Lorentz curve. Round your answers to the nearest hundredth. Which profession has a more equitable income distribution?
A) ,
,
 , stockbrokers
B) ,
,
 , teachers
C) ,
,
 , stockbrokers
D) ,
,
 , stockbrokers
and that of high school teachers by the function Compute the coefficient of inequality for each Lorentz curve. Round your answers to the nearest hundredth. Which profession has a more equitable income distribution?A)
, , stockbrokersB)
, , teachersC)
, , stockbrokersD)
, , stockbrokers سؤال
In a study conducted by a certain country's Economic Development Board, it was found that the Lorentz curve for the distribution of income of stockbrokers was described by the function  and that of high school teachers by the function
 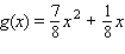 Compute the coefficient of inequality for each Lorentz curve. Round your answers to the nearest hundredth.
The coefficient of inequality for stockbrokers is __________.
The coefficient of inequality for teachers is __________.
Which profession has a more equitable income distribution?
and that of high school teachers by the function Compute the coefficient of inequality for each Lorentz curve. Round your answers to the nearest hundredth.The coefficient of inequality for stockbrokers is __________.
The coefficient of inequality for teachers is __________.
Which profession has a more equitable income distribution?
سؤال
Suppose an investment is expected to generate income at the rate of  dollars/year for the next 5 years. Find the present value of this investment if the prevailing interest rate is 0.05% / year compounded continuously. Round your answer to the nearest dollar.
$__________
dollars/year for the next 5 years. Find the present value of this investment if the prevailing interest rate is 0.05% / year compounded continuously. Round your answer to the nearest dollar.$__________
سؤال
سؤال
The demand function for a certain make of replacement cartridges for a water purifier is given by 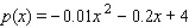 where p is the unit price in dollars and x is the quantity demanded each week, measured in units of a thousand. Determine the consumers' surplus if the market price is set at $1/cartridge. Round your answer to the nearest dollar.
CS = $__________
where p is the unit price in dollars and x is the quantity demanded each week, measured in units of a thousand. Determine the consumers' surplus if the market price is set at $1/cartridge. Round your answer to the nearest dollar.CS = $__________
سؤال
سؤال
Verify that 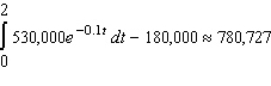 .
.
. سؤال
The demand function for a certain brand of compact disc is given by  The supply function for the compact discs is given by
  where p is the wholesale unit price in dollars and x is the quantity demanded each week, measured in units of a thousand. Determine the producers' surplus if the wholesale market price is set at the equilibrium price. Round your answer to the nearest dollar.
$__________
The supply function for the compact discs is given by where p is the wholesale unit price in dollars and x is the quantity demanded each week, measured in units of a thousand. Determine the producers' surplus if the wholesale market price is set at the equilibrium price. Round your answer to the nearest dollar.$__________
سؤال
سؤال
In a study conducted by a certain country's Economic Development Board, it was found that the Lorentz curve for the distribution of income of college teachers was described by the function  and that of lawyers by the function
  Compute the coefficient of inequality for each Lorentz curve. Round your answer to four decimal places.
The coefficient of inequality for college teachers is __________.
The coefficient of inequality for lawyers is __________.
Which profession has a more equitable income distribution?
and that of lawyers by the function Compute the coefficient of inequality for each Lorentz curve. Round your answer to four decimal places.The coefficient of inequality for college teachers is __________.
The coefficient of inequality for lawyers is __________.
Which profession has a more equitable income distribution?
سؤال
The quantity demanded  (in units of a hundred) of the miniature cameras per week is related to the unit price
  (in dollars) by
  and the quantity
  (in units of a hundred) that the supplier is willing to make available in the market is related to the unit price
  (in dollars) by
  If the market price is set at the equilibrium price, find the consumers' surplus and the producers' surplus. Please round the answers to the nearest dollar.
The consumers' surplus: $__________
The producers' surplus: $__________
(in units of a hundred) of the miniature cameras per week is related to the unit price (in dollars) by and the quantity (in units of a hundred) that the supplier is willing to make available in the market is related to the unit price (in dollars) by If the market price is set at the equilibrium price, find the consumers' surplus and the producers' surplus. Please round the answers to the nearest dollar.The consumers' surplus: $__________
The producers' surplus: $__________
سؤال
The management of the Titan Tire Company has determined that the quantity demanded x of their Super Titan tires/week is related to the unit price p by the relation  where p is measured in dollars and x is measured in units of a thousand. Titan will make x units of the tires available in the market if the unit price is
  dollars. Determine the consumers' surplus and the producers' surplus when the market unit price is set at the equilibrium price. Round your answers to the nearest dollars.
CS = $__________
PS = $__________
where p is measured in dollars and x is measured in units of a thousand. Titan will make x units of the tires available in the market if the unit price is dollars. Determine the consumers' surplus and the producers' surplus when the market unit price is set at the equilibrium price. Round your answers to the nearest dollars.CS = $__________
PS = $__________
سؤال
سؤال
سؤال
The demand function for a certain brand of compact disc is given by  where p is the wholesale unit price in dollars and x is the quantity demanded each week, measured in units of a thousand. Determine the consumers' surplus if the wholesale market price is set at $4/disc. Round your answer to the nearest dollar.
$__________
where p is the wholesale unit price in dollars and x is the quantity demanded each week, measured in units of a thousand. Determine the consumers' surplus if the wholesale market price is set at $4/disc. Round your answer to the nearest dollar.$__________
سؤال
سؤال
It is known that the quantity demanded of a certain make of portable hair dryer is x hundred units/week and the corresponding wholesale unit price is  dollars. Determine the consumers' surplus if the wholesale market price is set at $10/unit. Round your answer to the nearest dollar.
$__________
dollars. Determine the consumers' surplus if the wholesale market price is set at $10/unit. Round your answer to the nearest dollar.$__________
سؤال
A firm purchased a 11-year franchise for a computer outlet store that is expected to generate income at the rate of  dollars per year. If the prevailing interest rate is 9% per year compounded continuously, find the present value of the franchise. Please round the answer to the nearest dollar.
$__________
dollars per year. If the prevailing interest rate is 9% per year compounded continuously, find the present value of the franchise. Please round the answer to the nearest dollar.$__________
سؤال
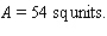
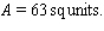
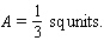
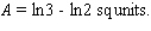
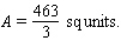
Find the area of the shaded region. 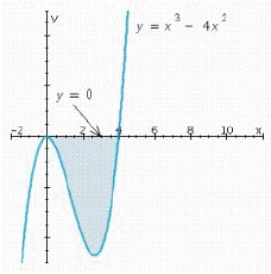
A) A = 23.6 sq units.
B) A = 19.9 sq units.
C) A = 18.1 sq units.
D) A = 21.3 sq units.
A) A = 23.6 sq units.
B) A = 19.9 sq units.
C) A = 18.1 sq units.
D) A = 21.3 sq units.
سؤال
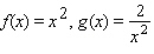
Sketch the region completely enclosed by the graphs of the given functions f and g. 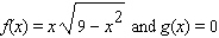
A)
B)
C)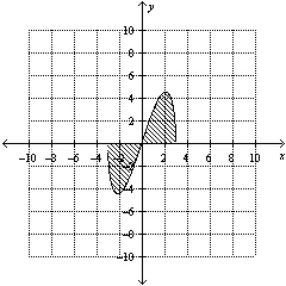
D)
E)
A)
B)
C)
D)
E)
سؤال
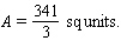
Find the area of the region enclosed by these graphs and the vertical lines  and
and  .
. 
A)
B)
C) 12
D)
E)
and . A)
B)
C) 12
D)
E)
سؤال
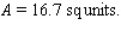
Sketch the graph and find the area of the region bounded by the graph of the function f and lines y = 0, x = a and x = b. 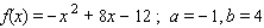
A)
B)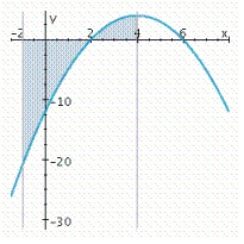
C)
D)
A)
B)
C)
D)
سؤال
Sketch the graph and find the area of the region bounded below by the graph of the given function and above by the x-axis from x = a to x = b. 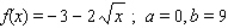
A)
B)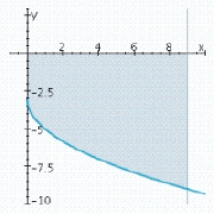
C)
D)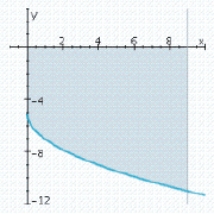
A)
B)
C)
D)
سؤال
Sketch the region completely enclosed by the graphs of the given functions f and g. 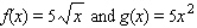
A)
B)
C)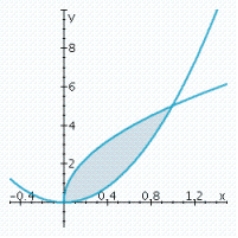
D)
A)
B)
C)
D)
سؤال
Sketch the graph and find the area of the region completely enclosed by the graphs of the given functions f and g. 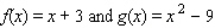
A)
B)
C)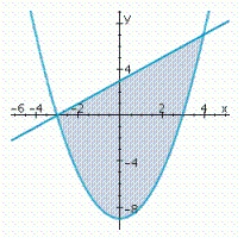
D)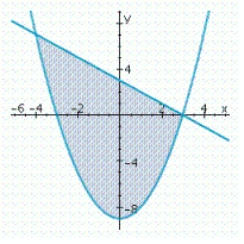
A)
B)
C)
D)
سؤال
Sketch the graphs of the functions f and g and find the area of the region enclosed by these graphs and the vertical lines x = a and x = b. 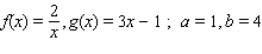
A)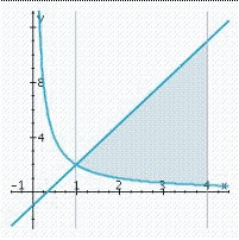
B)
C)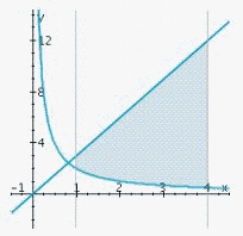
D)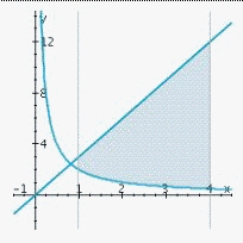

A)
B)
C)
D)
سؤال
Sketch the graphs of the functions f and g and find the area of the region enclosed by these graphs and the vertical lines x = a and x = b. 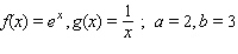
A)
B)

C)

D)
A)
B)
C)
D)
سؤال
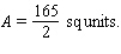
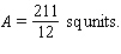
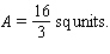
Find the area of the shaded region. 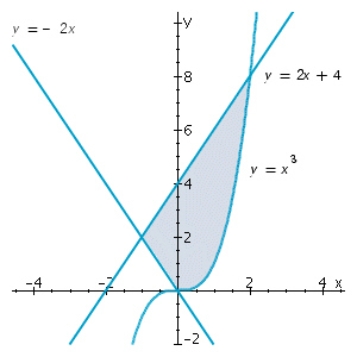
A) A = 10 sq units.
B) A = 13 sq units.
C) A = 9 sq units.
D) A = 12 sq units.
A) A = 10 sq units.
B) A = 13 sq units.
C) A = 9 sq units.
D) A = 12 sq units.
سؤال
Sketch the graph of the region bounded by the graph of the function f and lines y = 0, x = a and x = b. 
A)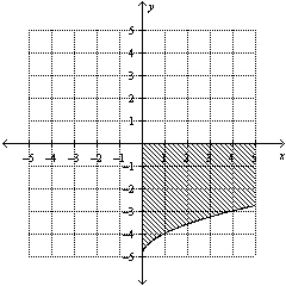
B)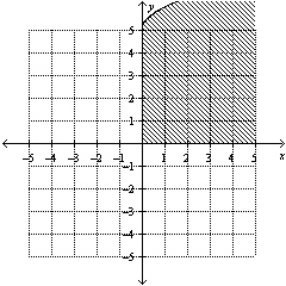
C)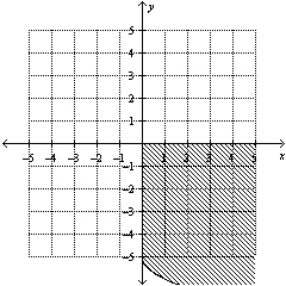
D)
E)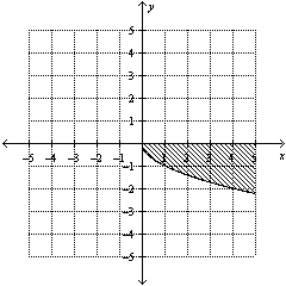
A)
B)
C)
D)
E)
سؤال
Sketch the region completely enclosed by the graphs of the given functions f and g. 
A)
B)
C)
D)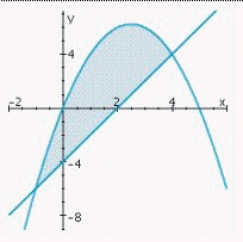
A)
B)
C)
D)
سؤال
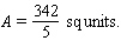
Find the area of the shaded region. 
A)
B)
C)
D)
E)
A)
B)
C)
D)
E)
سؤال
Find the area of the region bounded below by the graph of the function and above by the  -axis from
  to
to  .
. 
A)
B)
C)
D)
E)
-axis from to . A)
B)
C)
D)
E)
سؤال
Find the area of the shaded region. 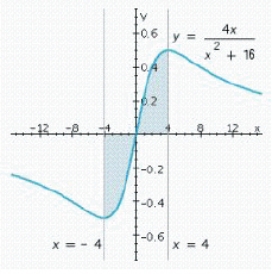
A) A = 4 ln 2 sq units.
B) A = 5 ln 2 sq units.
C) A = ln 4 sq units.
D) A = 2 ln 2 sq units.
A) A = 4 ln 2 sq units.
B) A = 5 ln 2 sq units.
C) A = ln 4 sq units.
D) A = 2 ln 2 sq units.
سؤال
Sketch the graph and find the area of the region bounded by the graph of the function f and lines y = 0, x = a and x = b. 
A)
B)
C)
D)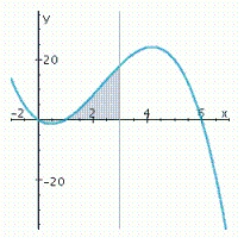
A)
B)
C)
D)
سؤال
Sketch the graphs of the functions f and g and find the area of the region enclosed by these graphs and the vertical lines x = a and x = b. 
A)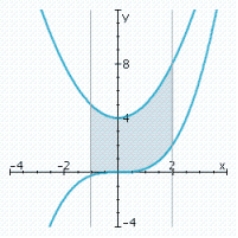

B)

C)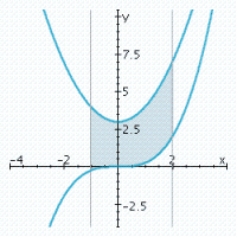
D)
A)
B)
C)
D)
سؤال
Find the area of the region bounded by the graph of the function  and the lines
  ,
,  , and
, and  .
. 
A)
B)
C)
D)
E)
and the lines , , and . A)
B)
C)
D)
E)
سؤال
Sketch the graphs of the functions f and g and find the area of the region enclosed by these graphs and the vertical lines x = a and x = b. 
A)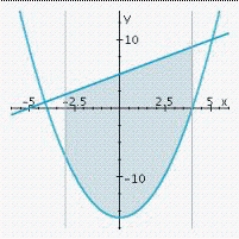
B)
C)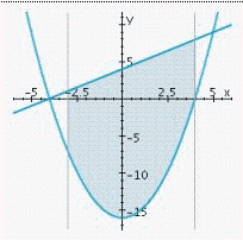
D)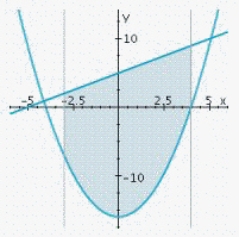
A)
B)
C)
D)
سؤال
Sketch the graph and find the area of the region bounded by the graph of the function f and lines y = 0, x = a and x = b. 
A)
B)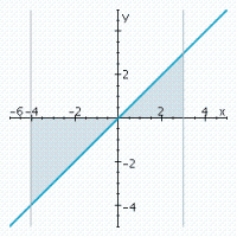

C)
D)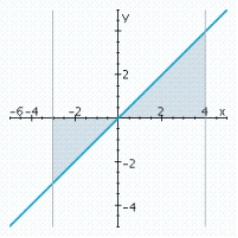
A)
B)
C)
D)
سؤال
Sketch the graph and find the area of the region bounded below by the graph of the given function and above by the x-axis from x = a to x = b. 
A)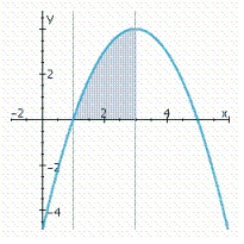

B)

C)

D)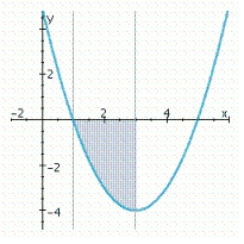
A)
B)
C)
D)
سؤال
Evaluate the given definite integral. 
A)
B)
C)
D)
A)
B)
C)
D)
سؤال
Evaluate the given definite integral. 
A)
B)
C)
D)
A)
B)
C)
D)
سؤال
Because of the increasingly important role played by coal as a viable alternative energy source, the production of coal has been growing at the rate of  billion metric tons/year t years from 1970 (which corresponds to t = 0). Had it not been for the energy crisis, the rate of production of coal since 1970 might have been only
  billion metric tons/year t years from 1970. Determine how much additional coal was produced between 1970 and the end of the century as an alternate energy source. Round your answer to one decimal place.
__________ billion metric tons
billion metric tons/year t years from 1970 (which corresponds to t = 0). Had it not been for the energy crisis, the rate of production of coal since 1970 might have been only billion metric tons/year t years from 1970. Determine how much additional coal was produced between 1970 and the end of the century as an alternate energy source. Round your answer to one decimal place.__________ billion metric tons
سؤال
Evaluate the given definite integral. 
A)
B)
C)
D)
A)
B)
C)
D)
سؤال
Determine whether the statement is true or false. If it is true, explain why it is true. If it is false, give an example to show why it is false. The area of the region bounded by the graphs of ![<strong>Determine whether the statement is true or false. If it is true, explain why it is true. If it is false, give an example to show why it is false. The area of the region bounded by the graphs of and and the vertical lines x = 0 and x = 6 is given by </strong> A) True. Since f and g are continuous functions and on the interval [0, 6], then the area of the region bounded above by y = f(x) and below by y = g(x) on [0, 6] is given by B) False. Since f and g are continuous functions and on the interval [0, 6], then the area of the region bounded above by y = g(x) and below by y = f(x) on [0, 6] is given by <div style=padding-top: 35px>](https://d2lvgg3v3hfg70.cloudfront.net/TB6026/11eaa8b1_da77_71b6_b1b6_6925f3b68e0f_TB6026_11.jpg) and
and ![<strong>Determine whether the statement is true or false. If it is true, explain why it is true. If it is false, give an example to show why it is false. The area of the region bounded by the graphs of and and the vertical lines x = 0 and x = 6 is given by </strong> A) True. Since f and g are continuous functions and on the interval [0, 6], then the area of the region bounded above by y = f(x) and below by y = g(x) on [0, 6] is given by B) False. Since f and g are continuous functions and on the interval [0, 6], then the area of the region bounded above by y = g(x) and below by y = f(x) on [0, 6] is given by <div style=padding-top: 35px>](https://d2lvgg3v3hfg70.cloudfront.net/TB6026/11eaa8b1_da77_98c7_b1b6_4f244b3c6f37_TB6026_11.jpg) and the vertical lines x = 0 and x = 6 is given by
and the vertical lines x = 0 and x = 6 is given by ![<strong>Determine whether the statement is true or false. If it is true, explain why it is true. If it is false, give an example to show why it is false. The area of the region bounded by the graphs of and and the vertical lines x = 0 and x = 6 is given by </strong> A) True. Since f and g are continuous functions and on the interval [0, 6], then the area of the region bounded above by y = f(x) and below by y = g(x) on [0, 6] is given by B) False. Since f and g are continuous functions and on the interval [0, 6], then the area of the region bounded above by y = g(x) and below by y = f(x) on [0, 6] is given by <div style=padding-top: 35px>](https://d2lvgg3v3hfg70.cloudfront.net/TB6026/11eaa8b1_da77_98c8_b1b6_19a2ee48ab40_TB6026_11.jpg)
A) True. Since f and g are continuous functions and![<strong>Determine whether the statement is true or false. If it is true, explain why it is true. If it is false, give an example to show why it is false. The area of the region bounded by the graphs of and and the vertical lines x = 0 and x = 6 is given by </strong> A) True. Since f and g are continuous functions and on the interval [0, 6], then the area of the region bounded above by y = f(x) and below by y = g(x) on [0, 6] is given by B) False. Since f and g are continuous functions and on the interval [0, 6], then the area of the region bounded above by y = g(x) and below by y = f(x) on [0, 6] is given by <div style=padding-top: 35px>](https://d2lvgg3v3hfg70.cloudfront.net/TB6026/11eaa8b1_da77_bfd9_b1b6_77ff5ee95e7e_TB6026_11.jpg) on the interval [0, 6], then the area of the region bounded above by y = f(x) and below by y = g(x) on [0, 6] is given by
on the interval [0, 6], then the area of the region bounded above by y = f(x) and below by y = g(x) on [0, 6] is given by
![<strong>Determine whether the statement is true or false. If it is true, explain why it is true. If it is false, give an example to show why it is false. The area of the region bounded by the graphs of and and the vertical lines x = 0 and x = 6 is given by </strong> A) True. Since f and g are continuous functions and on the interval [0, 6], then the area of the region bounded above by y = f(x) and below by y = g(x) on [0, 6] is given by B) False. Since f and g are continuous functions and on the interval [0, 6], then the area of the region bounded above by y = g(x) and below by y = f(x) on [0, 6] is given by <div style=padding-top: 35px>](https://d2lvgg3v3hfg70.cloudfront.net/TB6026/11eaa8b1_da77_e6ea_b1b6_27068666240e_TB6026_11.jpg)
B) False. Since f and g are continuous functions and![<strong>Determine whether the statement is true or false. If it is true, explain why it is true. If it is false, give an example to show why it is false. The area of the region bounded by the graphs of and and the vertical lines x = 0 and x = 6 is given by </strong> A) True. Since f and g are continuous functions and on the interval [0, 6], then the area of the region bounded above by y = f(x) and below by y = g(x) on [0, 6] is given by B) False. Since f and g are continuous functions and on the interval [0, 6], then the area of the region bounded above by y = g(x) and below by y = f(x) on [0, 6] is given by <div style=padding-top: 35px>](https://d2lvgg3v3hfg70.cloudfront.net/TB6026/11eaa8b1_da78_0dfb_b1b6_67ae04b1a8a1_TB6026_11.jpg) on the interval [0, 6], then the area of the region bounded above by y = g(x) and below by y = f(x) on [0, 6] is given by
on the interval [0, 6], then the area of the region bounded above by y = g(x) and below by y = f(x) on [0, 6] is given by
![<strong>Determine whether the statement is true or false. If it is true, explain why it is true. If it is false, give an example to show why it is false. The area of the region bounded by the graphs of and and the vertical lines x = 0 and x = 6 is given by </strong> A) True. Since f and g are continuous functions and on the interval [0, 6], then the area of the region bounded above by y = f(x) and below by y = g(x) on [0, 6] is given by B) False. Since f and g are continuous functions and on the interval [0, 6], then the area of the region bounded above by y = g(x) and below by y = f(x) on [0, 6] is given by <div style=padding-top: 35px>](https://d2lvgg3v3hfg70.cloudfront.net/TB6026/11eaa8b1_da78_0dfc_b1b6_5f9d7eb5ea1e_TB6026_11.jpg)
and and the vertical lines x = 0 and x = 6 is given by A) True. Since f and g are continuous functions and
on the interval [0, 6], then the area of the region bounded above by y = f(x) and below by y = g(x) on [0, 6] is given byB) False. Since f and g are continuous functions and
on the interval [0, 6], then the area of the region bounded above by y = g(x) and below by y = f(x) on [0, 6] is given by سؤال
In an endeavor to curb population growth in a certain country, the government has decided to launch an extensive propaganda campaign. Without curbs, the government expects the rate of population growth to have been  thousand people per year
  years from now, over the next
  years. However, successful implementation of the proposed campaign is expected to result in a population growth rate of
  thousand people per year
  years from now, over the next
  years. Assuming that the campaign is mounted, how many fewer people will there be in that country
  years from now then there would have been if no curbs had been imposed?
Please round your answer to the nearest whole number.
__________ thousand people
thousand people per year years from now, over the next years. However, successful implementation of the proposed campaign is expected to result in a population growth rate of thousand people per year years from now, over the next years. Assuming that the campaign is mounted, how many fewer people will there be in that country years from now then there would have been if no curbs had been imposed?Please round your answer to the nearest whole number.
__________ thousand people
سؤال
Evaluate the given definite integral. 
A)
B)
C)
D)
A)
B)
C)
D)
سؤال
Determine whether the statement is true or false. If it is true, explain why it is true. If it is false, give an example to show why it is false.
The area of the region bounded by the graphs of and
and  and the vertical lines x = 0 and x = 4 is given by
The area of the region bounded by the graphs of
and and the vertical lines x = 0 and x = 4 is given by سؤال
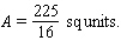
Find the area of the region completely enclosed by the graphs of the given functions  and
and  .
. 
A)
B)
C)
D)
E)
and . A)
B)
C)
D)
E)
سؤال
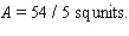
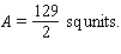
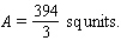
Find the area of the shaded region. 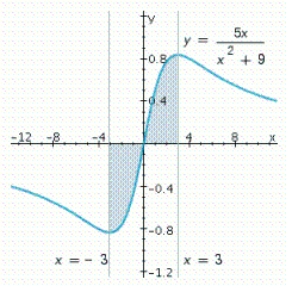
سؤال
Find the area of the shaded region. Round your answer to one decimal place. 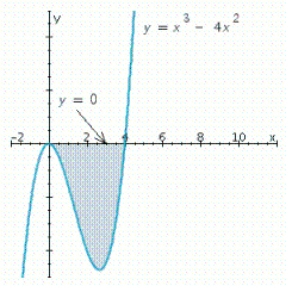
سؤال
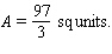
Find the area of the shaded region. 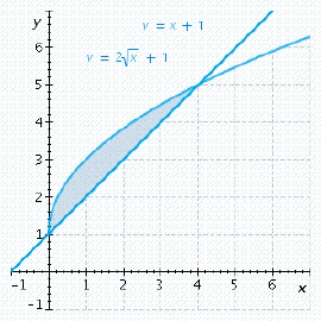
سؤال
In tests conducted by Auto Test Magazine on two identical models of the Phoenix Elite - one equipped with a standard engine and the other with a turbo-charger - it was found that the acceleration of the former is given by  ft/sec, t seconds after starting from rest at full throttle, whereas the acceleration of the latter is given by
  ft/sec. How much faster is the turbo-charged model moving than the model with the standard engine at the end of a 10-second test run at full throttle?
__________ ft/sec
ft/sec, t seconds after starting from rest at full throttle, whereas the acceleration of the latter is given by ft/sec. How much faster is the turbo-charged model moving than the model with the standard engine at the end of a 10-second test run at full throttle?__________ ft/sec
سؤال
In tests conducted by Auto Test Magazine on two identical models of the Phoenix Elite - one equipped with a standard engine and the other with a turbo-charger - it was found that the acceleration of the former is given by  ft/sec, t sec after starting from rest at full throttle, whereas the acceleration of the latter is given by
  ft/sec. How much faster is the turbo-charged model moving than the model with the standard engine at the end of a 10-second test run at full throttle?
A) 65 ft/sec
B) 58 ft/sec
C) 75 ft/sec
D) 70 ft/sec
ft/sec, t sec after starting from rest at full throttle, whereas the acceleration of the latter is given by ft/sec. How much faster is the turbo-charged model moving than the model with the standard engine at the end of a 10-second test run at full throttle?A) 65 ft/sec
B) 58 ft/sec
C) 75 ft/sec
D) 70 ft/sec
سؤال
Find the area of the shaded region. 
سؤال
Evaluate the given definite integral. 
A)
B)
C)
D)
A)
B)
C)
D)
سؤال
In an endeavor to curb population growth in a certain country, the government has decided to launch an extensive propaganda campaign. Without curbs, the government expects the rate of population growth to have been  thousand people per year
  years from now, over the next
  years. However, successful implementation of the proposed campaign is expected to result in a population growth rate of
  thousand people per year
  years from now, over the next
  years. Assuming that the campaign is mounted, how many fewer people will there be in that country
  years from now then there would have been if no curbs had been imposed? Please round your answer to the nearest integer number of thousands.
A) thousand people
B) thousand people
C) thousand people
D) thousand people
E) thousand people
thousand people per year years from now, over the next years. However, successful implementation of the proposed campaign is expected to result in a population growth rate of thousand people per year years from now, over the next years. Assuming that the campaign is mounted, how many fewer people will there be in that country years from now then there would have been if no curbs had been imposed? Please round your answer to the nearest integer number of thousands.A)
thousand peopleB)
thousand peopleC)
thousand peopleD)
thousand peopleE)
thousand people سؤال
Because of the increasingly important role played by coal as a viable alternative energy source, the production of coal has been growing at the rate of  billion metric tons/year t years from 1990 (which corresponds to t = 0). Had it not been for the energy crisis, the rate of production of coal since 1990 might have been only
  billion metric tons/year t years from 1990. Determine how much additional coal was produced between 1990 and the end of the century as an alternate energy source.
A) 13.6 billion metric tons
B) 0.6 billion metric tons
C) 4.7 billion metric tons
D) 7.9 billion metric tons
billion metric tons/year t years from 1990 (which corresponds to t = 0). Had it not been for the energy crisis, the rate of production of coal since 1990 might have been only billion metric tons/year t years from 1990. Determine how much additional coal was produced between 1990 and the end of the century as an alternate energy source.A) 13.6 billion metric tons
B) 0.6 billion metric tons
C) 4.7 billion metric tons
D) 7.9 billion metric tons
سؤال
Evaluate the definite integral. 
A)
B)
C)
D)
E)
A)
B)
C)
D)
E)
سؤال
Evaluate the given definite integral. 
A)
B)
C)
D)
A)
B)
C)
D)

فتح الحزمة
قم بالتسجيل لفتح البطاقات في هذه المجموعة!
Unlock Deck
Unlock Deck
1/314
العب
ملء الشاشة (f)
Deck 6: Integration
1
Find . Round your answer to the nearest integer.
A)
B)
C)
D)
E)
. Round your answer to the nearest integer.A)
B)
C)
D)
E)
2
Suppose an investment is expected to generate income at the rate of dollars/year for the next 6 years. Find the present value of this investment if the prevailing interest rate is 8% / year compounded continuously. Round your answer to the nearest dollar.
A) $950,930
B) $953,042
C) $951,802
D) $957,375
dollars/year for the next 6 years. Find the present value of this investment if the prevailing interest rate is 8% / year compounded continuously. Round your answer to the nearest dollar.A) $950,930
B) $953,042
C) $951,802
D) $957,375
$953,042
3
A certain country's income distribution is described by the function Compute and .
A)
B)
C)
D)
E)
Compute and .A)
B)
C)
D)
E)
4
Aiso deposits $110/month in a savings account paying 8% / year compounded continuously. Estimate the amount that will be in his account after 15 years.
A) $37,048
B) $36,139
C) $38,282
D) $42,603
A) $37,048
B) $36,139
C) $38,282
D) $42,603
فتح الحزمة
افتح القفل للوصول البطاقات البالغ عددها 314 في هذه المجموعة.
فتح الحزمة
k this deck
5
The management of the Titan Tire Company has determined that the quantity demanded x of their Super Titan tires/week is related to the unit price p by the relation where p is measured in dollars and x is measured in units of a thousand. Titan will make x units of the tires available in the market if the unit price is dollars. Determine the consumers' surplus and the producers' surplus when the market unit price is set at the equilibrium price. Round your answers to the nearest dollar.
A) CS = $337,012 , PS = $174,988
B) CS = $343,476 , PS = $168,524
C) CS = $341,333 , PS = $170,667
D) CS = $342,567 , PS = $169,433
where p is measured in dollars and x is measured in units of a thousand. Titan will make x units of the tires available in the market if the unit price is dollars. Determine the consumers' surplus and the producers' surplus when the market unit price is set at the equilibrium price. Round your answers to the nearest dollar.A) CS = $337,012 , PS = $174,988
B) CS = $343,476 , PS = $168,524
C) CS = $341,333 , PS = $170,667
D) CS = $342,567 , PS = $169,433
فتح الحزمة
افتح القفل للوصول البطاقات البالغ عددها 314 في هذه المجموعة.
فتح الحزمة
k this deck
6
Estimate the present value of an annuity if payments are $500 monthly for 19 years and the account earns interest at the rate of 8% / year compounded continuously. Round your answer to the nearest dollar.
A) $56,454
B) $57,363
C) $62,918
D) $58,597
A) $56,454
B) $57,363
C) $62,918
D) $58,597
فتح الحزمة
افتح القفل للوصول البطاقات البالغ عددها 314 في هذه المجموعة.
فتح الحزمة
k this deck
7
A state lottery commission pays the winner of the "Million Dollar" lottery 10 annual installments of $40,000 each. If the prevailing interest rate is 5% / year compounded continuously, find the present value of the winning ticket. Round your answer to the nearest dollar.
A) $316,918
B) $310,454
C) $316,009
D) $314,775
A) $316,918
B) $310,454
C) $316,009
D) $314,775
فتح الحزمة
افتح القفل للوصول البطاقات البالغ عددها 314 في هذه المجموعة.
فتح الحزمة
k this deck
8
The demand function for a certain make of replacement cartridges for a water purifier is given by where p is the unit price in dollars and x is the quantity demanded each week, measured in units of a thousand. Determine the consumers' surplus if the market price is set at $5/cartridge. Round your answer to the nearest dollar.
A) $16,333
B) $16,800
C) $16,667
D) $16,886
where p is the unit price in dollars and x is the quantity demanded each week, measured in units of a thousand. Determine the consumers' surplus if the market price is set at $5/cartridge. Round your answer to the nearest dollar.A) $16,333
B) $16,800
C) $16,667
D) $16,886
فتح الحزمة
افتح القفل للوصول البطاقات البالغ عددها 314 في هذه المجموعة.
فتح الحزمة
k this deck
9
In a study conducted by a certain country's Economic Development Board, it was found that the Lorentz curve for the distribution of income of college teachers was described by the function and that of lawyers by the function Compute the coefficient of inequality for each Lorentz curve. Round your answer to four decimal places. Which profession has a more equitable income distribution?
A) ,
, college teachers
B) ,
, college teachers
C) ,
, college teachers
D) ,
, college teachers
and that of lawyers by the function Compute the coefficient of inequality for each Lorentz curve. Round your answer to four decimal places. Which profession has a more equitable income distribution?A)
, , college teachersB)
, , college teachersC)
, , college teachersD)
, , college teachers فتح الحزمة
افتح القفل للوصول البطاقات البالغ عددها 314 في هذه المجموعة.
فتح الحزمة
k this deck
10
Sinclair wishes to supplement his retirement income by $200 per month for the next 12 years. He plans to obtain a reverse annuity mortgage (RAM) on his home to meet this need. Estimate the amount of the mortgage he will require if the prevailing interest rate is 12% per year compounded continuously.
A) $14,068
B) $15,261
C) $15,451
D) $29,552
E) $12,541
A) $14,068
B) $15,261
C) $15,451
D) $29,552
E) $12,541
فتح الحزمة
افتح القفل للوصول البطاقات البالغ عددها 314 في هذه المجموعة.
فتح الحزمة
k this deck
11
Find the amount of an annuity if $300 per month is paid into it for a period of 17 years, earning interest at the rate of 9% per year compounded continuously.
A) $144,727
B) $118,909
C) $245,790
D) $179,614
E) $179,511
A) $144,727
B) $118,909
C) $245,790
D) $179,614
E) $179,511
فتح الحزمة
افتح القفل للوصول البطاقات البالغ عددها 314 في هذه المجموعة.
فتح الحزمة
k this deck
12
A firm purchased a 16-year franchise for a computer outlet store that is expected to generate income at the rate of dollars per year. If the prevailing interest rate is 10% per year compounded continuously, find the present value of the franchise.
A) $1,114,979
B) $2,250,532
C) $4,660,006
D) $3,192,414
E) $1,756,632
dollars per year. If the prevailing interest rate is 10% per year compounded continuously, find the present value of the franchise.A) $1,114,979
B) $2,250,532
C) $4,660,006
D) $3,192,414
E) $1,756,632
فتح الحزمة
افتح القفل للوصول البطاقات البالغ عددها 314 في هذه المجموعة.
فتح الحزمة
k this deck
13
A certain country's income distribution is described by the function Sketch the Lorentz curve for this function. Compute and and interpret your results.
A)
;
The lowest 10 percent of the people receive 1.5 percent of the total income.
The lowest 30 percent of the people receive 10.1 percent of the total income.
B)
;
The lowest 10 percent of the people receive 1.5 percent of the total income.
The lowest 30 percent of the people receive 10.1 percent of the total income.
C)
;
The lowest 30 percent of the people receive 1.5 percent of the total income.
The lowest 10 percent of the people receive 10.1 percent of the total income.
Sketch the Lorentz curve for this function. Compute and and interpret your results.A)
; The lowest 10 percent of the people receive 1.5 percent of the total income.The lowest 30 percent of the people receive 10.1 percent of the total income.
B)
; The lowest 10 percent of the people receive 1.5 percent of the total income.The lowest 30 percent of the people receive 10.1 percent of the total income.
C)
; The lowest 30 percent of the people receive 1.5 percent of the total income.The lowest 10 percent of the people receive 10.1 percent of the total income.
فتح الحزمة
افتح القفل للوصول البطاقات البالغ عددها 314 في هذه المجموعة.
فتح الحزمة
k this deck
14
The demand function for a certain brand of compact disc is given by The supply function for the compact discs of is given by where p is the wholesale unit price in dollars and x is the quantity demanded each week, measured in units of a thousand. Determine the producers' surplus if the wholesale market price is set at the equilibrium price. Round your answer to the nearest dollar.
A) $11,894
B) $11,667
C) $11,792
D) $11,346
The supply function for the compact discs of is given by where p is the wholesale unit price in dollars and x is the quantity demanded each week, measured in units of a thousand. Determine the producers' surplus if the wholesale market price is set at the equilibrium price. Round your answer to the nearest dollar.A) $11,894
B) $11,667
C) $11,792
D) $11,346
فتح الحزمة
افتح القفل للوصول البطاقات البالغ عددها 314 في هذه المجموعة.
فتح الحزمة
k this deck
15
The Armstrongs wish to establish a custodial account to finance their children's education. If they deposit $600 monthly for 10 years in a savings account paying 6% / year compounded continuously, how much will their savings account be worth at the end of this period? Round your answer to the nearest dollar.
A) $99,877
B) $98,654
C) $100,786
D) $94,327
A) $99,877
B) $98,654
C) $100,786
D) $94,327
فتح الحزمة
افتح القفل للوصول البطاقات البالغ عددها 314 في هذه المجموعة.
فتح الحزمة
k this deck
16
It is known that the quantity demanded of a certain make of portable hair dryer is x hundred units/week and the corresponding wholesale unit price is dollars. Determine the consumers' surplus if the wholesale market price is set at $20/unit. Round your answer to the nearest dollar.
A) $5,093
B) $5,217
C) $4,975
D) $4,661
dollars. Determine the consumers' surplus if the wholesale market price is set at $20/unit. Round your answer to the nearest dollar.A) $5,093
B) $5,217
C) $4,975
D) $4,661
فتح الحزمة
افتح القفل للوصول البطاقات البالغ عددها 314 في هذه المجموعة.
فتح الحزمة
k this deck
17
The quantity demanded (in units of a hundred) of the miniature cameras per week is related to the unit price (in dollars) by and the quantity (in units of a hundred) that the supplier is willing to make available in the market is related to the unit price (in dollars) by If the market price is set at the equilibrium price, find the consumers' surplus and the producers' surplus. Please round the answers to the nearest dollar.
A) The consumers' surplus: $26,704, the producers' surplus: $142,718
B) The consumers' surplus: $142,718, the producers' surplus: $26,704
C) The consumers' surplus: $18,333, the producers' surplus: $20,000
D) The consumers' surplus: $20,000, the producers' surplus: $18,333
E) The consumers' surplus: $44,040, the producers' surplus: $21,478
(in units of a hundred) of the miniature cameras per week is related to the unit price (in dollars) by and the quantity (in units of a hundred) that the supplier is willing to make available in the market is related to the unit price (in dollars) by If the market price is set at the equilibrium price, find the consumers' surplus and the producers' surplus. Please round the answers to the nearest dollar.A) The consumers' surplus: $26,704, the producers' surplus: $142,718
B) The consumers' surplus: $142,718, the producers' surplus: $26,704
C) The consumers' surplus: $18,333, the producers' surplus: $20,000
D) The consumers' surplus: $20,000, the producers' surplus: $18,333
E) The consumers' surplus: $44,040, the producers' surplus: $21,478
فتح الحزمة
افتح القفل للوصول البطاقات البالغ عددها 314 في هذه المجموعة.
فتح الحزمة
k this deck
18
The demand function for a certain brand of compact disc is given by where p is the wholesale unit price in dollars and x is the quantity demanded each week, measured in units of a thousand. Determine the consumers' surplus if the wholesale market price is set at $2/disc. Round your answer to the nearest dollar.
A) $16,346
B) $16,790
C) $16,880
D) $16,667
where p is the wholesale unit price in dollars and x is the quantity demanded each week, measured in units of a thousand. Determine the consumers' surplus if the wholesale market price is set at $2/disc. Round your answer to the nearest dollar.A) $16,346
B) $16,790
C) $16,880
D) $16,667
فتح الحزمة
افتح القفل للوصول البطاقات البالغ عددها 314 في هذه المجموعة.
فتح الحزمة
k this deck
19
Estimate the present value of an annuity if payments are $1,500 monthly for 12 years and the account earns interest at the rate of 9% per year compounded continuously.
A) $105,563
B) $86,116
C) $129,803
D) $132,081
E) $104,177
A) $105,563
B) $86,116
C) $129,803
D) $132,081
E) $104,177
فتح الحزمة
افتح القفل للوصول البطاقات البالغ عددها 314 في هذه المجموعة.
فتح الحزمة
k this deck
20
Find . Round your answer to the nearest integer.
A) 866,981
B) 912,104
C) 854,636
D) 851,747
. Round your answer to the nearest integer.A) 866,981
B) 912,104
C) 854,636
D) 851,747
فتح الحزمة
افتح القفل للوصول البطاقات البالغ عددها 314 في هذه المجموعة.
فتح الحزمة
k this deck
21
Estimate the present value of an annuity if payments are $700 monthly for 19 years and the account earns interest at the rate of 5% / year compounded continuously. Round your answer to the nearest dollar.
$__________
$__________
فتح الحزمة
افتح القفل للوصول البطاقات البالغ عددها 314 في هذه المجموعة.
فتح الحزمة
k this deck
22
In a study conducted by a certain country's Economic Development Board, it was found that the Lorentz curve for the distribution of income of stockbrokers was described by the function and that of high school teachers by the function Compute the coefficient of inequality for each Lorentz curve. Round your answers to the nearest hundredth. Which profession has a more equitable income distribution?
A) ,
, stockbrokers
B) ,
, teachers
C) ,
, stockbrokers
D) ,
, stockbrokers
and that of high school teachers by the function Compute the coefficient of inequality for each Lorentz curve. Round your answers to the nearest hundredth. Which profession has a more equitable income distribution?A)
, , stockbrokersB)
, , teachersC)
, , stockbrokersD)
, , stockbrokers فتح الحزمة
افتح القفل للوصول البطاقات البالغ عددها 314 في هذه المجموعة.
فتح الحزمة
k this deck
23
In a study conducted by a certain country's Economic Development Board, it was found that the Lorentz curve for the distribution of income of stockbrokers was described by the function and that of high school teachers by the function Compute the coefficient of inequality for each Lorentz curve. Round your answers to the nearest hundredth.
The coefficient of inequality for stockbrokers is __________.
The coefficient of inequality for teachers is __________.
Which profession has a more equitable income distribution?
and that of high school teachers by the function Compute the coefficient of inequality for each Lorentz curve. Round your answers to the nearest hundredth.The coefficient of inequality for stockbrokers is __________.
The coefficient of inequality for teachers is __________.
Which profession has a more equitable income distribution?
فتح الحزمة
افتح القفل للوصول البطاقات البالغ عددها 314 في هذه المجموعة.
فتح الحزمة
k this deck
24
Suppose an investment is expected to generate income at the rate of dollars/year for the next 5 years. Find the present value of this investment if the prevailing interest rate is 0.05% / year compounded continuously. Round your answer to the nearest dollar.
$__________
dollars/year for the next 5 years. Find the present value of this investment if the prevailing interest rate is 0.05% / year compounded continuously. Round your answer to the nearest dollar.$__________
فتح الحزمة
افتح القفل للوصول البطاقات البالغ عددها 314 في هذه المجموعة.
فتح الحزمة
k this deck
25
Find the amount of an annuity if $210 per month is paid into it for a period of 24 years, earning interest at the rate of 9% per year compounded continuously. Please round the answer to the nearest dollar.
$__________
$__________
فتح الحزمة
افتح القفل للوصول البطاقات البالغ عددها 314 في هذه المجموعة.
فتح الحزمة
k this deck
26
The demand function for a certain make of replacement cartridges for a water purifier is given by where p is the unit price in dollars and x is the quantity demanded each week, measured in units of a thousand. Determine the consumers' surplus if the market price is set at $1/cartridge. Round your answer to the nearest dollar.
CS = $__________
where p is the unit price in dollars and x is the quantity demanded each week, measured in units of a thousand. Determine the consumers' surplus if the market price is set at $1/cartridge. Round your answer to the nearest dollar.CS = $__________
فتح الحزمة
افتح القفل للوصول البطاقات البالغ عددها 314 في هذه المجموعة.
فتح الحزمة
k this deck
27
Aiso deposits $140 / month in a savings account paying 8% / year compounded continuously. Estimate the amount that will be in his account after 15 years.
$__________
$__________
فتح الحزمة
افتح القفل للوصول البطاقات البالغ عددها 314 في هذه المجموعة.
فتح الحزمة
k this deck
28
Verify that .
. فتح الحزمة
افتح القفل للوصول البطاقات البالغ عددها 314 في هذه المجموعة.
فتح الحزمة
k this deck
29
The demand function for a certain brand of compact disc is given by The supply function for the compact discs is given by where p is the wholesale unit price in dollars and x is the quantity demanded each week, measured in units of a thousand. Determine the producers' surplus if the wholesale market price is set at the equilibrium price. Round your answer to the nearest dollar.
$__________
The supply function for the compact discs is given by where p is the wholesale unit price in dollars and x is the quantity demanded each week, measured in units of a thousand. Determine the producers' surplus if the wholesale market price is set at the equilibrium price. Round your answer to the nearest dollar.$__________
فتح الحزمة
افتح القفل للوصول البطاقات البالغ عددها 314 في هذه المجموعة.
فتح الحزمة
k this deck
30
A state lottery commission pays the winner of the "Million Dollar" lottery 10 annual installments of $50,000 each. If the prevailing interest rate is 5% / year compounded continuously, find the present value of the winning ticket. Round your answer to the nearest dollar.
$__________
$__________
فتح الحزمة
افتح القفل للوصول البطاقات البالغ عددها 314 في هذه المجموعة.
فتح الحزمة
k this deck
31
In a study conducted by a certain country's Economic Development Board, it was found that the Lorentz curve for the distribution of income of college teachers was described by the function and that of lawyers by the function Compute the coefficient of inequality for each Lorentz curve. Round your answer to four decimal places.
The coefficient of inequality for college teachers is __________.
The coefficient of inequality for lawyers is __________.
Which profession has a more equitable income distribution?
and that of lawyers by the function Compute the coefficient of inequality for each Lorentz curve. Round your answer to four decimal places.The coefficient of inequality for college teachers is __________.
The coefficient of inequality for lawyers is __________.
Which profession has a more equitable income distribution?
فتح الحزمة
افتح القفل للوصول البطاقات البالغ عددها 314 في هذه المجموعة.
فتح الحزمة
k this deck
32
The quantity demanded (in units of a hundred) of the miniature cameras per week is related to the unit price (in dollars) by and the quantity (in units of a hundred) that the supplier is willing to make available in the market is related to the unit price (in dollars) by If the market price is set at the equilibrium price, find the consumers' surplus and the producers' surplus. Please round the answers to the nearest dollar.
The consumers' surplus: $__________
The producers' surplus: $__________
(in units of a hundred) of the miniature cameras per week is related to the unit price (in dollars) by and the quantity (in units of a hundred) that the supplier is willing to make available in the market is related to the unit price (in dollars) by If the market price is set at the equilibrium price, find the consumers' surplus and the producers' surplus. Please round the answers to the nearest dollar.The consumers' surplus: $__________
The producers' surplus: $__________
فتح الحزمة
افتح القفل للوصول البطاقات البالغ عددها 314 في هذه المجموعة.
فتح الحزمة
k this deck
33
The management of the Titan Tire Company has determined that the quantity demanded x of their Super Titan tires/week is related to the unit price p by the relation where p is measured in dollars and x is measured in units of a thousand. Titan will make x units of the tires available in the market if the unit price is dollars. Determine the consumers' surplus and the producers' surplus when the market unit price is set at the equilibrium price. Round your answers to the nearest dollars.
CS = $__________
PS = $__________
where p is measured in dollars and x is measured in units of a thousand. Titan will make x units of the tires available in the market if the unit price is dollars. Determine the consumers' surplus and the producers' surplus when the market unit price is set at the equilibrium price. Round your answers to the nearest dollars.CS = $__________
PS = $__________
فتح الحزمة
افتح القفل للوصول البطاقات البالغ عددها 314 في هذه المجموعة.
فتح الحزمة
k this deck
34
The Armstrongs wish to establish a custodial account to finance their children's education. If they deposit $600 monthly for 8 years in a savings account paying 7% / year compounded continuously, how much will their savings account be worth at the end of this period? Round your answer to the nearest dollar.
$__________
$__________
فتح الحزمة
افتح القفل للوصول البطاقات البالغ عددها 314 في هذه المجموعة.
فتح الحزمة
k this deck
35
Sinclair wishes to supplement his retirement income by $450 per month for the next 15 years. He plans to obtain a reverse annuity mortgage (RAM) on his home to meet this need. Estimate the amount of the mortgage he will require if the prevailing interest rate is 11% per year compounded continuously. Please round the answer to the nearest dollar.
$__________
$__________
فتح الحزمة
افتح القفل للوصول البطاقات البالغ عددها 314 في هذه المجموعة.
فتح الحزمة
k this deck
36
The demand function for a certain brand of compact disc is given by where p is the wholesale unit price in dollars and x is the quantity demanded each week, measured in units of a thousand. Determine the consumers' surplus if the wholesale market price is set at $4/disc. Round your answer to the nearest dollar.
$__________
where p is the wholesale unit price in dollars and x is the quantity demanded each week, measured in units of a thousand. Determine the consumers' surplus if the wholesale market price is set at $4/disc. Round your answer to the nearest dollar.$__________
فتح الحزمة
افتح القفل للوصول البطاقات البالغ عددها 314 في هذه المجموعة.
فتح الحزمة
k this deck
37
Estimate the present value of an annuity if payments are $1,400 monthly for 14 years and the account earns interest at the rate of 10% per year compounded continuously. Please round the answer to the nearest cent dollar.
$__________
$__________
فتح الحزمة
افتح القفل للوصول البطاقات البالغ عددها 314 في هذه المجموعة.
فتح الحزمة
k this deck
38
It is known that the quantity demanded of a certain make of portable hair dryer is x hundred units/week and the corresponding wholesale unit price is dollars. Determine the consumers' surplus if the wholesale market price is set at $10/unit. Round your answer to the nearest dollar.
$__________
dollars. Determine the consumers' surplus if the wholesale market price is set at $10/unit. Round your answer to the nearest dollar.$__________
فتح الحزمة
افتح القفل للوصول البطاقات البالغ عددها 314 في هذه المجموعة.
فتح الحزمة
k this deck
39
A firm purchased a 11-year franchise for a computer outlet store that is expected to generate income at the rate of dollars per year. If the prevailing interest rate is 9% per year compounded continuously, find the present value of the franchise. Please round the answer to the nearest dollar.
$__________
dollars per year. If the prevailing interest rate is 9% per year compounded continuously, find the present value of the franchise. Please round the answer to the nearest dollar.$__________
فتح الحزمة
افتح القفل للوصول البطاقات البالغ عددها 314 في هذه المجموعة.
فتح الحزمة
k this deck
40
Find the area of the shaded region.
A) A = 23.6 sq units.
B) A = 19.9 sq units.
C) A = 18.1 sq units.
D) A = 21.3 sq units.
A) A = 23.6 sq units.
B) A = 19.9 sq units.
C) A = 18.1 sq units.
D) A = 21.3 sq units.
فتح الحزمة
افتح القفل للوصول البطاقات البالغ عددها 314 في هذه المجموعة.
فتح الحزمة
k this deck
41
Sketch the region completely enclosed by the graphs of the given functions f and g.
A)
B)
C)
D)
E)
A)
B)
C)
D)
E)
فتح الحزمة
افتح القفل للوصول البطاقات البالغ عددها 314 في هذه المجموعة.
فتح الحزمة
k this deck
42
Find the area of the region enclosed by these graphs and the vertical lines and .
A)
B)
C) 12
D)
E)
and . A)
B)
C) 12
D)
E)
فتح الحزمة
افتح القفل للوصول البطاقات البالغ عددها 314 في هذه المجموعة.
فتح الحزمة
k this deck
43
Sketch the graph and find the area of the region bounded by the graph of the function f and lines y = 0, x = a and x = b.
A)
B)
C)
D)
A)
B)
C)
D)
فتح الحزمة
افتح القفل للوصول البطاقات البالغ عددها 314 في هذه المجموعة.
فتح الحزمة
k this deck
44
Sketch the graph and find the area of the region bounded below by the graph of the given function and above by the x-axis from x = a to x = b.
A)
B)
C)
D)
A)
B)
C)
D)
فتح الحزمة
افتح القفل للوصول البطاقات البالغ عددها 314 في هذه المجموعة.
فتح الحزمة
k this deck
45
Sketch the region completely enclosed by the graphs of the given functions f and g.
A)
B)
C)
D)
A)
B)
C)
D)
فتح الحزمة
افتح القفل للوصول البطاقات البالغ عددها 314 في هذه المجموعة.
فتح الحزمة
k this deck
46
Sketch the graph and find the area of the region completely enclosed by the graphs of the given functions f and g.
A)
B)
C)
D)
A)
B)
C)
D)
فتح الحزمة
افتح القفل للوصول البطاقات البالغ عددها 314 في هذه المجموعة.
فتح الحزمة
k this deck
47
Sketch the graphs of the functions f and g and find the area of the region enclosed by these graphs and the vertical lines x = a and x = b.
A)
B)
C)
D)
A)
B)
C)
D)
فتح الحزمة
افتح القفل للوصول البطاقات البالغ عددها 314 في هذه المجموعة.
فتح الحزمة
k this deck
48
Sketch the graphs of the functions f and g and find the area of the region enclosed by these graphs and the vertical lines x = a and x = b.
A)
B)
C)
D)
A)
B)
C)
D)
فتح الحزمة
افتح القفل للوصول البطاقات البالغ عددها 314 في هذه المجموعة.
فتح الحزمة
k this deck
49
Find the area of the shaded region.
A) A = 10 sq units.
B) A = 13 sq units.
C) A = 9 sq units.
D) A = 12 sq units.
A) A = 10 sq units.
B) A = 13 sq units.
C) A = 9 sq units.
D) A = 12 sq units.
فتح الحزمة
افتح القفل للوصول البطاقات البالغ عددها 314 في هذه المجموعة.
فتح الحزمة
k this deck
50
Sketch the graph of the region bounded by the graph of the function f and lines y = 0, x = a and x = b.
A)
B)
C)
D)
E)
A)
B)
C)
D)
E)
فتح الحزمة
افتح القفل للوصول البطاقات البالغ عددها 314 في هذه المجموعة.
فتح الحزمة
k this deck
51
Sketch the region completely enclosed by the graphs of the given functions f and g.
A)
B)
C)
D)
A)
B)
C)
D)
فتح الحزمة
افتح القفل للوصول البطاقات البالغ عددها 314 في هذه المجموعة.
فتح الحزمة
k this deck
52
Find the area of the shaded region.
A)
B)
C)
D)
E)
A)
B)
C)
D)
E)
فتح الحزمة
افتح القفل للوصول البطاقات البالغ عددها 314 في هذه المجموعة.
فتح الحزمة
k this deck
53
Find the area of the region bounded below by the graph of the function and above by the -axis from to .
A)
B)
C)
D)
E)
-axis from to . A)
B)
C)
D)
E)
فتح الحزمة
افتح القفل للوصول البطاقات البالغ عددها 314 في هذه المجموعة.
فتح الحزمة
k this deck
54
Find the area of the shaded region.
A) A = 4 ln 2 sq units.
B) A = 5 ln 2 sq units.
C) A = ln 4 sq units.
D) A = 2 ln 2 sq units.
A) A = 4 ln 2 sq units.
B) A = 5 ln 2 sq units.
C) A = ln 4 sq units.
D) A = 2 ln 2 sq units.
فتح الحزمة
افتح القفل للوصول البطاقات البالغ عددها 314 في هذه المجموعة.
فتح الحزمة
k this deck
55
Sketch the graph and find the area of the region bounded by the graph of the function f and lines y = 0, x = a and x = b.
A)
B)
C)
D)
A)
B)
C)
D)
فتح الحزمة
افتح القفل للوصول البطاقات البالغ عددها 314 في هذه المجموعة.
فتح الحزمة
k this deck
56
Sketch the graphs of the functions f and g and find the area of the region enclosed by these graphs and the vertical lines x = a and x = b.
A)
B)
C)
D)
A)
B)
C)
D)
فتح الحزمة
افتح القفل للوصول البطاقات البالغ عددها 314 في هذه المجموعة.
فتح الحزمة
k this deck
57
Find the area of the region bounded by the graph of the function and the lines , , and .
A)
B)
C)
D)
E)
and the lines , , and . A)
B)
C)
D)
E)
فتح الحزمة
افتح القفل للوصول البطاقات البالغ عددها 314 في هذه المجموعة.
فتح الحزمة
k this deck
58
Sketch the graphs of the functions f and g and find the area of the region enclosed by these graphs and the vertical lines x = a and x = b.
A)
B)
C)
D)
A)
B)
C)
D)
فتح الحزمة
افتح القفل للوصول البطاقات البالغ عددها 314 في هذه المجموعة.
فتح الحزمة
k this deck
59
Sketch the graph and find the area of the region bounded by the graph of the function f and lines y = 0, x = a and x = b.
A)
B)
C)
D)
A)
B)
C)
D)
فتح الحزمة
افتح القفل للوصول البطاقات البالغ عددها 314 في هذه المجموعة.
فتح الحزمة
k this deck
60
Sketch the graph and find the area of the region bounded below by the graph of the given function and above by the x-axis from x = a to x = b.
A)
B)
C)
D)
A)
B)
C)
D)
فتح الحزمة
افتح القفل للوصول البطاقات البالغ عددها 314 في هذه المجموعة.
فتح الحزمة
k this deck
61
Evaluate the given definite integral.
A)
B)
C)
D)
A)
B)
C)
D)
فتح الحزمة
افتح القفل للوصول البطاقات البالغ عددها 314 في هذه المجموعة.
فتح الحزمة
k this deck
62
Evaluate the given definite integral.
A)
B)
C)
D)
A)
B)
C)
D)
فتح الحزمة
افتح القفل للوصول البطاقات البالغ عددها 314 في هذه المجموعة.
فتح الحزمة
k this deck
63
Because of the increasingly important role played by coal as a viable alternative energy source, the production of coal has been growing at the rate of billion metric tons/year t years from 1970 (which corresponds to t = 0). Had it not been for the energy crisis, the rate of production of coal since 1970 might have been only billion metric tons/year t years from 1970. Determine how much additional coal was produced between 1970 and the end of the century as an alternate energy source. Round your answer to one decimal place.
__________ billion metric tons
billion metric tons/year t years from 1970 (which corresponds to t = 0). Had it not been for the energy crisis, the rate of production of coal since 1970 might have been only billion metric tons/year t years from 1970. Determine how much additional coal was produced between 1970 and the end of the century as an alternate energy source. Round your answer to one decimal place.__________ billion metric tons
فتح الحزمة
افتح القفل للوصول البطاقات البالغ عددها 314 في هذه المجموعة.
فتح الحزمة
k this deck
64
Evaluate the given definite integral.
A)
B)
C)
D)
A)
B)
C)
D)
فتح الحزمة
افتح القفل للوصول البطاقات البالغ عددها 314 في هذه المجموعة.
فتح الحزمة
k this deck
65
Determine whether the statement is true or false. If it is true, explain why it is true. If it is false, give an example to show why it is false. The area of the region bounded by the graphs of and and the vertical lines x = 0 and x = 6 is given by
A) True. Since f and g are continuous functions and on the interval [0, 6], then the area of the region bounded above by y = f(x) and below by y = g(x) on [0, 6] is given by
B) False. Since f and g are continuous functions and on the interval [0, 6], then the area of the region bounded above by y = g(x) and below by y = f(x) on [0, 6] is given by
and and the vertical lines x = 0 and x = 6 is given by A) True. Since f and g are continuous functions and
on the interval [0, 6], then the area of the region bounded above by y = f(x) and below by y = g(x) on [0, 6] is given byB) False. Since f and g are continuous functions and
on the interval [0, 6], then the area of the region bounded above by y = g(x) and below by y = f(x) on [0, 6] is given by فتح الحزمة
افتح القفل للوصول البطاقات البالغ عددها 314 في هذه المجموعة.
فتح الحزمة
k this deck
66
In an endeavor to curb population growth in a certain country, the government has decided to launch an extensive propaganda campaign. Without curbs, the government expects the rate of population growth to have been thousand people per year years from now, over the next years. However, successful implementation of the proposed campaign is expected to result in a population growth rate of thousand people per year years from now, over the next years. Assuming that the campaign is mounted, how many fewer people will there be in that country years from now then there would have been if no curbs had been imposed?
Please round your answer to the nearest whole number.
__________ thousand people
thousand people per year years from now, over the next years. However, successful implementation of the proposed campaign is expected to result in a population growth rate of thousand people per year years from now, over the next years. Assuming that the campaign is mounted, how many fewer people will there be in that country years from now then there would have been if no curbs had been imposed?Please round your answer to the nearest whole number.
__________ thousand people
فتح الحزمة
افتح القفل للوصول البطاقات البالغ عددها 314 في هذه المجموعة.
فتح الحزمة
k this deck
67
Evaluate the given definite integral.
A)
B)
C)
D)
A)
B)
C)
D)
فتح الحزمة
افتح القفل للوصول البطاقات البالغ عددها 314 في هذه المجموعة.
فتح الحزمة
k this deck
68
Determine whether the statement is true or false. If it is true, explain why it is true. If it is false, give an example to show why it is false.
The area of the region bounded by the graphs of and and the vertical lines x = 0 and x = 4 is given by
The area of the region bounded by the graphs of
and and the vertical lines x = 0 and x = 4 is given by فتح الحزمة
افتح القفل للوصول البطاقات البالغ عددها 314 في هذه المجموعة.
فتح الحزمة
k this deck
69
Find the area of the region completely enclosed by the graphs of the given functions and .
A)
B)
C)
D)
E)
and . A)
B)
C)
D)
E)
فتح الحزمة
افتح القفل للوصول البطاقات البالغ عددها 314 في هذه المجموعة.
فتح الحزمة
k this deck
70
Find the area of the shaded region.
فتح الحزمة
افتح القفل للوصول البطاقات البالغ عددها 314 في هذه المجموعة.
فتح الحزمة
k this deck
71
Find the area of the shaded region. Round your answer to one decimal place.
فتح الحزمة
افتح القفل للوصول البطاقات البالغ عددها 314 في هذه المجموعة.
فتح الحزمة
k this deck
72
Find the area of the shaded region.
فتح الحزمة
افتح القفل للوصول البطاقات البالغ عددها 314 في هذه المجموعة.
فتح الحزمة
k this deck
73
In tests conducted by Auto Test Magazine on two identical models of the Phoenix Elite - one equipped with a standard engine and the other with a turbo-charger - it was found that the acceleration of the former is given by ft/sec, t seconds after starting from rest at full throttle, whereas the acceleration of the latter is given by ft/sec. How much faster is the turbo-charged model moving than the model with the standard engine at the end of a 10-second test run at full throttle?
__________ ft/sec
ft/sec, t seconds after starting from rest at full throttle, whereas the acceleration of the latter is given by ft/sec. How much faster is the turbo-charged model moving than the model with the standard engine at the end of a 10-second test run at full throttle?__________ ft/sec
فتح الحزمة
افتح القفل للوصول البطاقات البالغ عددها 314 في هذه المجموعة.
فتح الحزمة
k this deck
74
In tests conducted by Auto Test Magazine on two identical models of the Phoenix Elite - one equipped with a standard engine and the other with a turbo-charger - it was found that the acceleration of the former is given by ft/sec, t sec after starting from rest at full throttle, whereas the acceleration of the latter is given by ft/sec. How much faster is the turbo-charged model moving than the model with the standard engine at the end of a 10-second test run at full throttle?
A) 65 ft/sec
B) 58 ft/sec
C) 75 ft/sec
D) 70 ft/sec
ft/sec, t sec after starting from rest at full throttle, whereas the acceleration of the latter is given by ft/sec. How much faster is the turbo-charged model moving than the model with the standard engine at the end of a 10-second test run at full throttle?A) 65 ft/sec
B) 58 ft/sec
C) 75 ft/sec
D) 70 ft/sec
فتح الحزمة
افتح القفل للوصول البطاقات البالغ عددها 314 في هذه المجموعة.
فتح الحزمة
k this deck
75
Find the area of the shaded region.
فتح الحزمة
افتح القفل للوصول البطاقات البالغ عددها 314 في هذه المجموعة.
فتح الحزمة
k this deck
76
Evaluate the given definite integral.
A)
B)
C)
D)
A)
B)
C)
D)
فتح الحزمة
افتح القفل للوصول البطاقات البالغ عددها 314 في هذه المجموعة.
فتح الحزمة
k this deck
77
In an endeavor to curb population growth in a certain country, the government has decided to launch an extensive propaganda campaign. Without curbs, the government expects the rate of population growth to have been thousand people per year years from now, over the next years. However, successful implementation of the proposed campaign is expected to result in a population growth rate of thousand people per year years from now, over the next years. Assuming that the campaign is mounted, how many fewer people will there be in that country years from now then there would have been if no curbs had been imposed? Please round your answer to the nearest integer number of thousands.
A) thousand people
B) thousand people
C) thousand people
D) thousand people
E) thousand people
thousand people per year years from now, over the next years. However, successful implementation of the proposed campaign is expected to result in a population growth rate of thousand people per year years from now, over the next years. Assuming that the campaign is mounted, how many fewer people will there be in that country years from now then there would have been if no curbs had been imposed? Please round your answer to the nearest integer number of thousands.A)
thousand peopleB)
thousand peopleC)
thousand peopleD)
thousand peopleE)
thousand people فتح الحزمة
افتح القفل للوصول البطاقات البالغ عددها 314 في هذه المجموعة.
فتح الحزمة
k this deck
78
Because of the increasingly important role played by coal as a viable alternative energy source, the production of coal has been growing at the rate of billion metric tons/year t years from 1990 (which corresponds to t = 0). Had it not been for the energy crisis, the rate of production of coal since 1990 might have been only billion metric tons/year t years from 1990. Determine how much additional coal was produced between 1990 and the end of the century as an alternate energy source.
A) 13.6 billion metric tons
B) 0.6 billion metric tons
C) 4.7 billion metric tons
D) 7.9 billion metric tons
billion metric tons/year t years from 1990 (which corresponds to t = 0). Had it not been for the energy crisis, the rate of production of coal since 1990 might have been only billion metric tons/year t years from 1990. Determine how much additional coal was produced between 1990 and the end of the century as an alternate energy source.A) 13.6 billion metric tons
B) 0.6 billion metric tons
C) 4.7 billion metric tons
D) 7.9 billion metric tons
فتح الحزمة
افتح القفل للوصول البطاقات البالغ عددها 314 في هذه المجموعة.
فتح الحزمة
k this deck
79
Evaluate the definite integral.
A)
B)
C)
D)
E)
A)
B)
C)
D)
E)
فتح الحزمة
افتح القفل للوصول البطاقات البالغ عددها 314 في هذه المجموعة.
فتح الحزمة
k this deck
80
Evaluate the given definite integral.
A)
B)
C)
D)
A)
B)
C)
D)
فتح الحزمة
افتح القفل للوصول البطاقات البالغ عددها 314 في هذه المجموعة.
فتح الحزمة
k this deck
فتح الحزمة
افتح القفل للوصول البطاقات البالغ عددها 314 في هذه المجموعة.


