Deck 14: Quality Control
ملء الشاشة (f)
سؤال
سؤال
سؤال
سؤال
سؤال
سؤال
سؤال
سؤال
سؤال
سؤال
سؤال
سؤال
سؤال
سؤال
سؤال
سؤال
سؤال
سؤال
سؤال
سؤال
سؤال
سؤال
سؤال
سؤال
سؤال
سؤال
سؤال
سؤال
سؤال
سؤال
سؤال
سؤال
سؤال
سؤال
سؤال
سؤال
سؤال
سؤال
سؤال
سؤال
سؤال
سؤال
سؤال
سؤال
سؤال
سؤال
سؤال
سؤال
سؤال
سؤال
سؤال
سؤال
سؤال
سؤال
سؤال
سؤال
سؤال
سؤال
سؤال
سؤال
سؤال
سؤال
سؤال
سؤال
سؤال
سؤال
سؤال
سؤال
سؤال
Consider the following information: 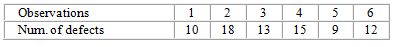
The number of runs above and below the sample median is:
A) 3.
B) 4.
C) 5.
D) 6.
E) none of these.
The number of runs above and below the sample median is:
A) 3.
B) 4.
C) 5.
D) 6.
E) none of these.
سؤال
سؤال
سؤال
A design engineer wants to construct a sample mean chart for controlling the service life of a halogen headlamp his company produces. He knows from numerous previous samples that this service life is normally distributed with a mean of 500 hours and a standard deviation of 20 hours. On three recent production batches, he tested service life on random samples of four headlamps, with these results: 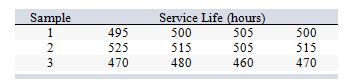
What is the sample mean service life for sample 2?
A) 460 hours
B) 495 hours
C) 500 hours
D) 515 hours
E) 525 hours
What is the sample mean service life for sample 2?
A) 460 hours
B) 495 hours
C) 500 hours
D) 515 hours
E) 525 hours
سؤال
سؤال
A design engineer wants to construct a sample mean chart for controlling the service life of a halogen headlamp his company produces. He knows from numerous previous samples that when this service life is in control it is normally distributed with a mean of 500 hours and a standard deviation of 20 hours. On three recent production batches, he tested service life on random samples of four headlamps, with these results: 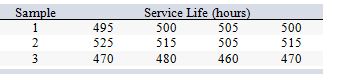
What is the mean of the sampling distribution of sample means when the service life is in control?
A) 250 hours
B) 470 hours
C) 495 hours
D) 500 hours
E) 515 hours
What is the mean of the sampling distribution of sample means when the service life is in control?
A) 250 hours
B) 470 hours
C) 495 hours
D) 500 hours
E) 515 hours
سؤال
سؤال
The following data occurs chronologically from left to right: 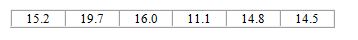
The number of runs above and below the sample median is:
A) 2.
B) 3.
C) 4.
D) 5.
E) none of these.
The number of runs above and below the sample median is:
A) 2.
B) 3.
C) 4.
D) 5.
E) none of these.
سؤال
سؤال
The following data occurs chronologically from left to right: 
The number of runs up and down is:
A) 2.
B) 3.
C) 4.
D) 5.
E) none of these.
The number of runs up and down is:
A) 2.
B) 3.
C) 4.
D) 5.
E) none of these.
سؤال
سؤال
Consider the following information: 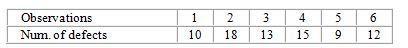
The number of runs up and down for the preceding data is:
A) 3.
B) 4.
C) 5.
D) 6.
E) none of these.
The number of runs up and down for the preceding data is:
A) 3.
B) 4.
C) 5.
D) 6.
E) none of these.

فتح الحزمة
قم بالتسجيل لفتح البطاقات في هذه المجموعة!
Unlock Deck
Unlock Deck
1/112
العب
ملء الشاشة (f)
Deck 14: Quality Control
1
High-cost, low-volume items often require careful inspection since we may have large costs associated with passing defectives.
True
2
The traditional view is that the optimum level of inspection occurs when we catch at least 98.6 percent of the defects.
False
3
Statistical process control is the measurement of rejects in the final product.
False
4
Concluding that a process is out of control when it is not is known as a Type I error.
فتح الحزمة
افتح القفل للوصول البطاقات البالغ عددها 112 في هذه المجموعة.
فتح الحزمة
k this deck
5
If a point on a control chart falls outside one of the control limits, this suggests that the process output is nonrandom and should be investigated.
فتح الحزمة
افتح القفل للوصول البطاقات البالغ عددها 112 في هذه المجموعة.
فتح الحزمة
k this deck
6
A lower control limit must by definition be a value less than an upper control limit.
فتح الحزمة
افتح القفل للوصول البطاقات البالغ عددها 112 في هذه المجموعة.
فتح الحزمة
k this deck
7
The amount of inspection needed is governed by the costs of inspection and the expected costs of passing defective items.
فتح الحزمة
افتح القفل للوصول البطاقات البالغ عددها 112 في هذه المجموعة.
فتح الحزمة
k this deck
8
The purpose of statistical process control is to ensure that historical output is random.
فتح الحزمة
افتح القفل للوصول البطاقات البالغ عددها 112 في هذه المجموعة.
فتح الحزمة
k this deck
9
Approving the effort that occurs during the production process is known as acceptance sampling.
فتح الحزمة
افتح القفل للوصول البطاقات البالغ عددها 112 في هذه المجموعة.
فتح الحزمة
k this deck
10
Range charts and p-charts are both used for variable data.
فتح الحزمة
افتح القفل للوصول البطاقات البالغ عددها 112 في هذه المجموعة.
فتح الحزمة
k this deck
11
An R value of zero (on a range chart) means that the process must be in control since all sample values are equal.
فتح الحزمة
افتح القفل للوصول البطاقات البالغ عددها 112 في هذه المجموعة.
فتح الحزمة
k this deck
12
Attributes need to be measured, whereas variable data can be counted.
فتح الحزمة
افتح القفل للوصول البطاقات البالغ عددها 112 في هذه المجموعة.
فتح الحزمة
k this deck
13
Low-cost, high-volume items often require more intensive inspection than other types of items.
فتح الحزمة
افتح القفل للوصول البطاقات البالغ عددها 112 في هذه المجموعة.
فتح الحزمة
k this deck
14
A p-chart is used to monitor the fraction of defectives in the output of a process.
فتح الحزمة
افتح القفل للوصول البطاقات البالغ عددها 112 في هذه المجموعة.
فتح الحزمة
k this deck
15
A process that exhibits random variability would be judged to be out of control.
فتح الحزمة
افتح القفل للوصول البطاقات البالغ عددها 112 في هذه المجموعة.
فتح الحزمة
k this deck
16
Processes that are in control eliminate variations.
فتح الحزمة
افتح القفل للوصول البطاقات البالغ عددها 112 في هذه المجموعة.
فتح الحزمة
k this deck
17
An x-bar control chart can only be valid if the underlying population it measures is a normal distribution.
فتح الحزمة
افتح القفل للوصول البطاقات البالغ عددها 112 في هذه المجموعة.
فتح الحزمة
k this deck
18
The traditional view is that the optimum level of inspection minimizes the sum of inspection costs and the cost of passing defectives.
فتح الحزمة
افتح القفل للوصول البطاقات البالغ عددها 112 في هذه المجموعة.
فتح الحزمة
k this deck
19
The amount of inspection we choose can range from no inspection at all to inspecting each item numerous times.
فتح الحزمة
افتح القفل للوصول البطاقات البالغ عددها 112 في هذه المجموعة.
فتح الحزمة
k this deck
20
Range charts are used mainly with attribute data.
فتح الحزمة
افتح القفل للوصول البطاقات البالغ عددها 112 في هذه المجموعة.
فتح الحزمة
k this deck
21
Tolerances represent the control limits we use on the charts.
فتح الحزمة
افتح القفل للوصول البطاقات البالغ عددها 112 في هذه المجموعة.
فتح الحزمة
k this deck
22
A run test checks a sequence of observations for randomness.
فتح الحزمة
افتح القفل للوصول البطاقات البالغ عددها 112 في هذه المجموعة.
فتح الحزمة
k this deck
23
Control limits tend to be wider for more variable processes.
فتح الحزمة
افتح القفل للوصول البطاقات البالغ عددها 112 في هذه المجموعة.
فتح الحزمة
k this deck
24
The purpose of quality control is making sure that processes are performing in an acceptable manner.
فتح الحزمة
افتح القفل للوصول البطاقات البالغ عددها 112 في هذه المجموعة.
فتح الحزمة
k this deck
25
Patterns of data on a control chart suggest that the process may have nonrandom variation.
فتح الحزمة
افتح القفل للوصول البطاقات البالغ عددها 112 في هذه المجموعة.
فتح الحزمة
k this deck
26
Approximately 99.7 percent of sample means will fall within plus or minus two standard deviations of the process mean if the process is under control.
فتح الحزمة
افتح القفل للوصول البطاقات البالغ عددها 112 في هذه المجموعة.
فتح الحزمة
k this deck
27
The output of a process may not conform to specifications even though the process may be statistically "in control."
فتح الحزمة
افتح القفل للوصول البطاقات البالغ عددها 112 في هذه المجموعة.
فتح الحزمة
k this deck
28
A c-chart is used to monitor the total number of defectives in the output of a process.
فتح الحزمة
افتح القفل للوصول البطاقات البالغ عددها 112 في هذه المجموعة.
فتح الحزمة
k this deck
29
A c-chart is used to monitor the number of defects per unit for process output.
فتح الحزمة
افتح القفل للوصول البطاقات البالغ عددها 112 في هذه المجموعة.
فتح الحزمة
k this deck
30
The primary purpose of statistical process control is to detect a defective product before it is shipped to a customer.
فتح الحزمة
افتح القفل للوصول البطاقات البالغ عددها 112 في هذه المجموعة.
فتح الحزمة
k this deck
31
The sampling distribution can be assumed to be approximately normal even when the underlying process distribution is not normally distributed.
فتح الحزمة
افتح القفل للوصول البطاقات البالغ عددها 112 في هذه المجموعة.
فتح الحزمة
k this deck
32
Statistical process control focuses on the acceptability of process output.
فتح الحزمة
افتح القفل للوصول البطاقات البالغ عددها 112 في هذه المجموعة.
فتح الحزمة
k this deck
33
The Taguchi loss function suggests that the capability ratio can be improved by extending the spread between LCL and UCL.
فتح الحزمة
افتح القفل للوصول البطاقات البالغ عددها 112 في هذه المجموعة.
فتح الحزمة
k this deck
34
Run tests are useful in helping to identify nonrandom variations in a process.
فتح الحزمة
افتح القفل للوصول البطاقات البالغ عددها 112 في هذه المجموعة.
فتح الحزمة
k this deck
35
The variation of a sampling distribution is less than the variation of the underlying process distribution.
فتح الحزمة
افتح القفل للوصول البطاقات البالغ عددها 112 في هذه المجموعة.
فتح الحزمة
k this deck
36
Process capability compares process variability to the tolerances.
فتح الحزمة
افتح القفل للوصول البطاقات البالغ عددها 112 في هذه المجموعة.
فتح الحزمة
k this deck
37
Control limits used on process control charts are specifications established by design or customers.
فتح الحزمة
افتح القفل للوصول البطاقات البالغ عددها 112 في هذه المجموعة.
فتح الحزمة
k this deck
38
Cpk can be used only when the process is centered.
فتح الحزمة
افتح القفل للوصول البطاقات البالغ عددها 112 في هذه المجموعة.
فتح الحزمة
k this deck
39
Cpk is useful even when the process is not centered.
فتح الحزمة
افتح القفل للوصول البطاقات البالغ عددها 112 في هذه المجموعة.
فتح الحزمة
k this deck
40
Run tests give managers an alternative to control charts; they are quicker and cost less.
فتح الحزمة
افتح القفل للوصول البطاقات البالغ عددها 112 في هذه المجموعة.
فتح الحزمة
k this deck
41
Attribute data are counted, variable data are measured.
فتح الحزمة
افتح القفل للوصول البطاقات البالغ عددها 112 في هذه المجموعة.
فتح الحزمة
k this deck
42
A time-ordered plot of representative sample statistics is called a(n):
A) Gantt chart.
B) simo chart.
C) control chart.
D) up-down matrix.
E) standard deviation table.
A) Gantt chart.
B) simo chart.
C) control chart.
D) up-down matrix.
E) standard deviation table.
فتح الحزمة
افتح القفل للوصول البطاقات البالغ عددها 112 في هذه المجموعة.
فتح الحزمة
k this deck
43
A control chart used to monitor the fraction of defectives generated by a process is the:
A) p-chart.
B) R-chart.
C) x-bar chart.
D) c-chart.
E) Gantt chart.
A) p-chart.
B) R-chart.
C) x-bar chart.
D) c-chart.
E) Gantt chart.
فتح الحزمة
افتح القفل للوصول البطاقات البالغ عددها 112 في هذه المجموعة.
فتح الحزمة
k this deck
44
The more progressive a firm's approach to quality assurance, the less that company will need to rely on:
A) insourcing.
B) inspection.
C) outsourcing.
D) continuous improvement.
E) capability assessment.
A) insourcing.
B) inspection.
C) outsourcing.
D) continuous improvement.
E) capability assessment.
فتح الحزمة
افتح القفل للوصول البطاقات البالغ عددها 112 في هذه المجموعة.
فتح الحزمة
k this deck
45
The greater the volume of the process being targeted for inspection, the more attractive __________ inspection is.
A) monitored
B) controlled
C) periodic
D) variable
E) automated
A) monitored
B) controlled
C) periodic
D) variable
E) automated
فتح الحزمة
افتح القفل للوصول البطاقات البالغ عددها 112 في هذه المجموعة.
فتح الحزمة
k this deck
46
Which of the following quality control sample statistics indicates a quality characteristic that is an attribute?
A) mean
B) variance
C) standard deviation
D) range
E) proportion
A) mean
B) variance
C) standard deviation
D) range
E) proportion
فتح الحزمة
افتح القفل للوصول البطاقات البالغ عددها 112 في هذه المجموعة.
فتح الحزمة
k this deck
47
Statistical process control charts are not really used to fix quality so much as they are used to:
A) highlight when processes are not capable.
B) point out when random variation is present.
C) alert when corrective action is needeD.
D) monitor the quality of incoming shipments or outgoing finished goods.
E) initiate team-building exercises.
A) highlight when processes are not capable.
B) point out when random variation is present.
C) alert when corrective action is needeD.
D) monitor the quality of incoming shipments or outgoing finished goods.
E) initiate team-building exercises.
فتح الحزمة
افتح القفل للوصول البطاقات البالغ عددها 112 في هذه المجموعة.
فتح الحزمة
k this deck
48
Inspection is a(n)_____________ activity.
A) prevention.
B) capability analysis.
C) flawless
D) corrective.
E) appraisal.
A) prevention.
B) capability analysis.
C) flawless
D) corrective.
E) appraisal.
فتح الحزمة
افتح القفل للوصول البطاقات البالغ عددها 112 في هذه المجموعة.
فتح الحزمة
k this deck
49
The amount of inspection needed depends on __________ and __________.
A) the amount of automation; the reliability of inspectors
B) the quality of the supplier; the target market of the process
C) the costs of inspection; the costs of passing on defective items
D) where in the process the inspection occurs; the volume of the process
E) the cost of the item being inspected; the use of the item being inspected
فتح الحزمة
افتح القفل للوصول البطاقات البالغ عددها 112 في هذه المجموعة.
فتح الحزمة
k this deck
50
Acceptance sampling, when it is used, is used:
(I) before production.
(II) during production.
(III) after production.
A) I only
B) I and III only
C) I and II only
D) II and III only
E) I, II, and III
(I) before production.
(II) during production.
(III) after production.
A) I only
B) I and III only
C) I and II only
D) II and III only
E) I, II, and III
فتح الحزمة
افتح القفل للوصول البطاقات البالغ عددها 112 في هذه المجموعة.
فتح الحزمة
k this deck
51
When a process is not centered, its capability is measured in a slightly different way. The symbol for this case is Cpk.
فتح الحزمة
افتح القفل للوصول البطاقات البالغ عددها 112 في هذه المجموعة.
فتح الحزمة
k this deck
52
Larger samples will require wider x-bar control limits because there is more data.
فتح الحزمة
افتح القفل للوصول البطاقات البالغ عددها 112 في هذه المجموعة.
فتح الحزمة
k this deck
53
A p-chart would be used to monitor:
A) average shrinkage.
B) dispersion in sample data.
C) the fraction defectivE.
D) the number of defects per unit.
E) the range of values.
A) average shrinkage.
B) dispersion in sample data.
C) the fraction defectivE.
D) the number of defects per unit.
E) the range of values.
فتح الحزمة
افتح القفل للوصول البطاقات البالغ عددها 112 في هذه المجموعة.
فتح الحزمة
k this deck
54
The number of defective parts in a sample is an example of variable data because it will "vary" from one sample to another.
فتح الحزمة
افتح القفل للوصول البطاقات البالغ عددها 112 في هذه المجموعة.
فتح الحزمة
k this deck
55
Range control charts are used to monitor process central tendency.
فتح الحزمة
افتح القفل للوصول البطاقات البالغ عددها 112 في هذه المجموعة.
فتح الحزمة
k this deck
56
Control limits are based on multiples of the process standard deviation.
فتح الحزمة
افتح القفل للوصول البطاقات البالغ عددها 112 في هذه المجموعة.
فتح الحزمة
k this deck
57
A control chart used to monitor the process mean is the:
A) p-chart.
B) R-chart.
C) x-bar chart.
D) c-chart.
E) Gantt chart.
A) p-chart.
B) R-chart.
C) x-bar chart.
D) c-chart.
E) Gantt chart.
فتح الحزمة
افتح القفل للوصول البطاقات البالغ عددها 112 في هذه المجموعة.
فتح الحزمة
k this deck
58
The assurance that processes are performing in an acceptable manner is the focus of:
A) variability analysis.
B) inspection.
C) capability assessment.
D) quality control.
E) acceptance sampling.
A) variability analysis.
B) inspection.
C) capability assessment.
D) quality control.
E) acceptance sampling.
فتح الحزمة
افتح القفل للوصول البطاقات البالغ عددها 112 في هذه المجموعة.
فتح الحزمة
k this deck
59
A c-chart is used for:
A) means.
B) ranges.
C) percent defective.
D) fraction defective per unit.
E) number of defects per unit.
A) means.
B) ranges.
C) percent defective.
D) fraction defective per unit.
E) number of defects per unit.
فتح الحزمة
افتح القفل للوصول البطاقات البالغ عددها 112 في هذه المجموعة.
فتح الحزمة
k this deck
60
The best way to assure quality is to use extensive inspection and control charts.
فتح الحزمة
افتح القفل للوصول البطاقات البالغ عددها 112 في هذه المجموعة.
فتح الحزمة
k this deck
61
The process capability index (Cpk) may mislead if:
(I) the process is not stable.
(II) the process output is not normally distributed.
(III) the process is not centered.
A) I and II
B) I and III
C) II and III
D) II only
E) I, II, and III
(I) the process is not stable.
(II) the process output is not normally distributed.
(III) the process is not centered.
A) I and II
B) I and III
C) II and III
D) II only
E) I, II, and III
فتح الحزمة
افتح القفل للوصول البطاقات البالغ عددها 112 في هذه المجموعة.
فتح الحزمة
k this deck
62
A control chart used to monitor the number of defects per unit is the:
A) p-chart.
B) R-chart.
C) x-bar chart.
D) c-chart.
E) Gantt chart.
A) p-chart.
B) R-chart.
C) x-bar chart.
D) c-chart.
E) Gantt chart.
فتح الحزمة
افتح القفل للوصول البطاقات البالغ عددها 112 في هذه المجموعة.
فتح الحزمة
k this deck
63
Which of the following relationships must always be incorrect?
A) Tolerances > process variability > control limits
B) Process variability > tolerances > control limits
C) Tolerances > control limits > process variability
D) Process variability > control limits > tolerances
E) Process variability < tolerances < control limits
A) Tolerances > process variability > control limits
B) Process variability > tolerances > control limits
C) Tolerances > control limits > process variability
D) Process variability > control limits > tolerances
E) Process variability < tolerances < control limits
فتح الحزمة
افتح القفل للوصول البطاقات البالغ عددها 112 في هذه المجموعة.
فتح الحزمة
k this deck
64
A shift in the process mean for a measured characteristic would most likely be detected by a:
A) p-chart.
B) x-bar chart.
C) c-chart.
D) R-chart.
E) s-chart.
A) p-chart.
B) x-bar chart.
C) c-chart.
D) R-chart.
E) s-chart.
فتح الحزمة
افتح القفل للوصول البطاقات البالغ عددها 112 في هذه المجموعة.
فتح الحزمة
k this deck
65
Which of the following is not a step in the control process?
A) Define what is to be controlled.
B) Compare measurements to a standard.
C) 100 percent inspection.
D) Take corrective action if necessary.
E) Evaluate corrective action.
A) Define what is to be controlled.
B) Compare measurements to a standard.
C) 100 percent inspection.
D) Take corrective action if necessary.
E) Evaluate corrective action.
فتح الحزمة
افتح القفل للوصول البطاقات البالغ عددها 112 في هذه المجموعة.
فتح الحزمة
k this deck
66
The purpose of control charts is to:
A) estimate the proportion of output that is acceptable.
B) weed out defective items.
C) determine if the output is within tolerances/specifications.
D) distinguish between random variation and assignable variation in the process.
E) provide meaningful work for quality inspectors.
A) estimate the proportion of output that is acceptable.
B) weed out defective items.
C) determine if the output is within tolerances/specifications.
D) distinguish between random variation and assignable variation in the process.
E) provide meaningful work for quality inspectors.
فتح الحزمة
افتح القفل للوصول البطاقات البالغ عددها 112 في هذه المجموعة.
فتح الحزمة
k this deck
67
A plot below the lower control limit on the range chart:
(I) should be ignored since lower variation is desirable.
(II) may be an indication that process variation has decreased.
(III) should be investigated for assignable cause.
A) I and II
B) I and III
C) II and III
D) II only
E) I, II, and III
(I) should be ignored since lower variation is desirable.
(II) may be an indication that process variation has decreased.
(III) should be investigated for assignable cause.
A) I and II
B) I and III
C) II and III
D) II only
E) I, II, and III
فتح الحزمة
افتح القفل للوصول البطاقات البالغ عددها 112 في هذه المجموعة.
فتح الحزمة
k this deck
68
A time-ordered plot of sample statistics is called a(n) ______ chart.
A) statistical
B) inspection
C) control
D) simo
E) limit
A) statistical
B) inspection
C) control
D) simo
E) limit
فتح الحزمة
افتح القفل للوصول البطاقات البالغ عددها 112 في هذه المجموعة.
فتح الحزمة
k this deck
69
Consider the following information:
The number of runs above and below the sample median is:
A) 3.
B) 4.
C) 5.
D) 6.
E) none of these.
The number of runs above and below the sample median is:
A) 3.
B) 4.
C) 5.
D) 6.
E) none of these.
فتح الحزمة
افتح القفل للوصول البطاقات البالغ عددها 112 في هذه المجموعة.
فتح الحزمة
k this deck
70
If a process is performing as it should, it is still possible to obtain observations which are outside of which limits?
(I) tolerances
(II) control limits
(III) process variability
A) I
B) II
C) I and II
D) II and III
E) I, II, and III
(I) tolerances
(II) control limits
(III) process variability
A) I
B) II
C) I and II
D) II and III
E) I, II, and III
فتح الحزمة
افتح القفل للوصول البطاقات البالغ عددها 112 في هذه المجموعة.
فتح الحزمة
k this deck
71
The range chart (R-chart) is most likely to detect a change in:
A) proportion.
B) mean.
C) number defective.
D) variability.
E) sample size.
A) proportion.
B) mean.
C) number defective.
D) variability.
E) sample size.
فتح الحزمة
افتح القفل للوصول البطاقات البالغ عددها 112 في هذه المجموعة.
فتح الحزمة
k this deck
72
A design engineer wants to construct a sample mean chart for controlling the service life of a halogen headlamp his company produces. He knows from numerous previous samples that this service life is normally distributed with a mean of 500 hours and a standard deviation of 20 hours. On three recent production batches, he tested service life on random samples of four headlamps, with these results:
What is the sample mean service life for sample 2?
A) 460 hours
B) 495 hours
C) 500 hours
D) 515 hours
E) 525 hours
What is the sample mean service life for sample 2?
A) 460 hours
B) 495 hours
C) 500 hours
D) 515 hours
E) 525 hours
فتح الحزمة
افتح القفل للوصول البطاقات البالغ عددها 112 في هذه المجموعة.
فتح الحزمة
k this deck
73
The traditional view is that the optimum level of inspection is where the:
A) cost of inspection is minimum.
B) cost of passing defectives is minimum.
C) total cost of inspection and defectives is maximum.
D) total cost of inspection and defectives is minimum.
E) difference between inspection and defectives costs is minimum.
A) cost of inspection is minimum.
B) cost of passing defectives is minimum.
C) total cost of inspection and defectives is maximum.
D) total cost of inspection and defectives is minimum.
E) difference between inspection and defectives costs is minimum.
فتح الحزمة
افتح القفل للوصول البطاقات البالغ عددها 112 في هذه المجموعة.
فتح الحزمة
k this deck
74
A design engineer wants to construct a sample mean chart for controlling the service life of a halogen headlamp his company produces. He knows from numerous previous samples that when this service life is in control it is normally distributed with a mean of 500 hours and a standard deviation of 20 hours. On three recent production batches, he tested service life on random samples of four headlamps, with these results:
What is the mean of the sampling distribution of sample means when the service life is in control?
A) 250 hours
B) 470 hours
C) 495 hours
D) 500 hours
E) 515 hours
What is the mean of the sampling distribution of sample means when the service life is in control?
A) 250 hours
B) 470 hours
C) 495 hours
D) 500 hours
E) 515 hours
فتح الحزمة
افتح القفل للوصول البطاقات البالغ عددها 112 في هذه المجموعة.
فتح الحزمة
k this deck
75
The probability of concluding that assignable variation exists when only random variation is present is:
(I) the probability of a Type I error.
(II) known as the alpha risk.
(III) highly unlikely.
(IV) the sum of probabilities in the two tails of the normal distribution.
A) I and II
B) I and IV
C) II and III
D) I, II, and IV
E) I, III, and IV
(I) the probability of a Type I error.
(II) known as the alpha risk.
(III) highly unlikely.
(IV) the sum of probabilities in the two tails of the normal distribution.
A) I and II
B) I and IV
C) II and III
D) I, II, and IV
E) I, III, and IV
فتح الحزمة
افتح القفل للوصول البطاقات البالغ عددها 112 في هذه المجموعة.
فتح الحزمة
k this deck
76
The following data occurs chronologically from left to right:
The number of runs above and below the sample median is:
A) 2.
B) 3.
C) 4.
D) 5.
E) none of these.
The number of runs above and below the sample median is:
A) 2.
B) 3.
C) 4.
D) 5.
E) none of these.
فتح الحزمة
افتح القفل للوصول البطاقات البالغ عددها 112 في هذه المجموعة.
فتح الحزمة
k this deck
77
A point which is outside of the lower control limit on an R-chart:
A) is an indication that no cause of variation is present.
B) should be ignored because it signifies better-than-average quality.
C) should be investigated because an assignable cause of variation might be present.
D) should be ignored unless another point is outside that limit.
E) is impossible since the lower limit is always zero.
فتح الحزمة
افتح القفل للوصول البطاقات البالغ عددها 112 في هذه المجموعة.
فتح الحزمة
k this deck
78
The following data occurs chronologically from left to right:
The number of runs up and down is:
A) 2.
B) 3.
C) 4.
D) 5.
E) none of these.
The number of runs up and down is:
A) 2.
B) 3.
C) 4.
D) 5.
E) none of these.
فتح الحزمة
افتح القفل للوصول البطاقات البالغ عددها 112 في هذه المجموعة.
فتح الحزمة
k this deck
79
_______ variation is a variation whose cause can be identified.
A) Assignable
B) Controllable
C) Random
D) Statistical
E) Theoretical
A) Assignable
B) Controllable
C) Random
D) Statistical
E) Theoretical
فتح الحزمة
افتح القفل للوصول البطاقات البالغ عددها 112 في هذه المجموعة.
فتح الحزمة
k this deck
80
Consider the following information:
The number of runs up and down for the preceding data is:
A) 3.
B) 4.
C) 5.
D) 6.
E) none of these.
The number of runs up and down for the preceding data is:
A) 3.
B) 4.
C) 5.
D) 6.
E) none of these.
فتح الحزمة
افتح القفل للوصول البطاقات البالغ عددها 112 في هذه المجموعة.
فتح الحزمة
k this deck
فتح الحزمة
افتح القفل للوصول البطاقات البالغ عددها 112 في هذه المجموعة.


