Deck 16: Long-Run Growth
ملء الشاشة (f)
سؤال
Refer to the information provided in Figure 16.1 below to answer the questions that follow. 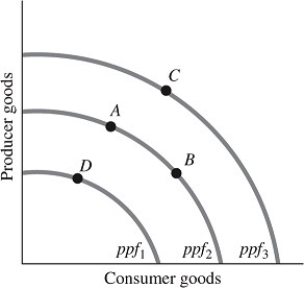 Figure 16.1
Refer to Figure 16.1. Which of the following will cause a movement from Point D to Point A?
A) an increase in the productivity of workers
B) technological progress
C) an increase in capital stock
D) all of the above
Figure 16.1Refer to Figure 16.1. Which of the following will cause a movement from Point D to Point A?
A) an increase in the productivity of workers
B) technological progress
C) an increase in capital stock
D) all of the above
سؤال
سؤال
Refer to the information provided in Figure 16.1 below to answer the questions that follow. Figure 16.1
Refer to Figure 16.1. Economic growth is represented by
A) a movement from point D to point C.
B) a movement from point A to point C.
C) a movement from point D to point A.
D) all of the above
Figure 16.1Refer to Figure 16.1. Economic growth is represented by
A) a movement from point D to point C.
B) a movement from point A to point C.
C) a movement from point D to point A.
D) all of the above
سؤال
Refer to the information provided in Figure 16.1 below to answer the questions that follow. Figure 16.1
Refer to Figure 16.1. Economic growth is represented by
A) a movement from Point A to Point B along ppf1.
B) a movement from Point C to Point B.
C) a movement from Point B to Point A.
D) a shift in the production possibilities frontier from ppf2 to ppf3.
Figure 16.1Refer to Figure 16.1. Economic growth is represented by
A) a movement from Point A to Point B along ppf1.
B) a movement from Point C to Point B.
C) a movement from Point B to Point A.
D) a shift in the production possibilities frontier from ppf2 to ppf3.
سؤال
سؤال
Refer to the information provided in Figure 16.1 below to answer the questions that follow. Figure 16.1
Refer to Figure 16.1. Economic growth is represented by
A) a movement from Point A to Point B along ppf1.
B) a movement from Point B to Point C.
C) a movement from Point B to Point A.
D) a shift in the production possibilities frontier from ppf2 to ppf1.
Figure 16.1Refer to Figure 16.1. Economic growth is represented by
A) a movement from Point A to Point B along ppf1.
B) a movement from Point B to Point C.
C) a movement from Point B to Point A.
D) a shift in the production possibilities frontier from ppf2 to ppf1.
سؤال
سؤال
Refer to the information provided in Figure 16.1 below to answer the questions that follow. Figure 16.1
Refer to Figure 16.1. A movement from Point D to Point C represents
A) a decrease in capital stock.
B) economic growth.
C) economic decline.
D) a decrease in the labor force.
Figure 16.1Refer to Figure 16.1. A movement from Point D to Point C represents
A) a decrease in capital stock.
B) economic growth.
C) economic decline.
D) a decrease in the labor force.
سؤال
Refer to the information provided in Figure 16.1 below to answer the questions that follow. Figure 16.1
Refer to Figure 16.1. Which of the following causes the ppf to shift from ppf2 to ppf1?
A) technological progress
B) a decrease in capital stock
C) an increase in the labor force
D) an increase in per capita income
Figure 16.1Refer to Figure 16.1. Which of the following causes the ppf to shift from ppf2 to ppf1?
A) technological progress
B) a decrease in capital stock
C) an increase in the labor force
D) an increase in per capita income
سؤال
سؤال
Refer to the information provided in Figure 16.1 below to answer the questions that follow. Figure 16.1
Refer to Figure 16.1. Technological progress will cause a
A) movement from Point A to Point B.
B) movement from Point B to Point A.
C) shift from ppf2 to ppf1.
D) shift from ppf2 to ppf3.
Figure 16.1Refer to Figure 16.1. Technological progress will cause a
A) movement from Point A to Point B.
B) movement from Point B to Point A.
C) shift from ppf2 to ppf1.
D) shift from ppf2 to ppf3.
سؤال
Refer to the information provided in Figure 16.1 below to answer the questions that follow. Figure 16.1
Refer to Figure 16.1. A movement from Point B to Point D represents
A) an increase in capital stock.
B) technological progress.
C) economic decline.
D) an increase in the labor force.
Figure 16.1Refer to Figure 16.1. A movement from Point B to Point D represents
A) an increase in capital stock.
B) technological progress.
C) economic decline.
D) an increase in the labor force.
سؤال
سؤال
Refer to the information provided in Figure 16.1 below to answer the questions that follow. Figure 16.1
Refer to Figure 16.1. An economic decline is represented by a movement from
A) point A to point B.
B) point D to point A.
C) point C to point A.
D) point B to point A.
Figure 16.1Refer to Figure 16.1. An economic decline is represented by a movement from
A) point A to point B.
B) point D to point A.
C) point C to point A.
D) point B to point A.
سؤال
Refer to the information provided in Figure 16.1 below to answer the questions that follow. Figure 16.1
Refer to Figure 16.1. A decrease in the labor force will cause a
A) movement from Point A to Point B.
B) movement from Point B to Point A.
C) shift from ppf2 to ppf1.
D) shift from ppf2 to ppf3.
Figure 16.1Refer to Figure 16.1. A decrease in the labor force will cause a
A) movement from Point A to Point B.
B) movement from Point B to Point A.
C) shift from ppf2 to ppf1.
D) shift from ppf2 to ppf3.
سؤال
Refer to the information provided in Figure 16.1 below to answer the questions that follow. Figure 16.1
Refer to Figure 16.1. Which of the following cannot cause a movement from Point A to Point C?
A) an expansionary monetary policy
B) technological progress
C) an increase in capital stock
D) an increase in the productivity of workers
Figure 16.1Refer to Figure 16.1. Which of the following cannot cause a movement from Point A to Point C?
A) an expansionary monetary policy
B) technological progress
C) an increase in capital stock
D) an increase in the productivity of workers
سؤال
سؤال
سؤال
Refer to the information provided in Figure 16.2 below to answer the questions that follow. 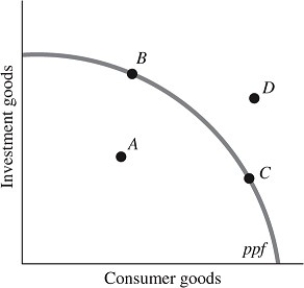 Figure 16.2
Refer to Figure 16.2. The highest unemployment rate occurs when the economy is at Point
A) A.
B) B.
C) C.
D) D.
Figure 16.2Refer to Figure 16.2. The highest unemployment rate occurs when the economy is at Point
A) A.
B) B.
C) C.
D) D.
سؤال
Refer to the information provided in Figure 16.1 below to answer the questions that follow. Figure 16.1
Refer to Figure 16.1. Which of the following causes the ppf to shift from ppf2 to ppf3?
A) technological progress
B) a decrease in capital stock
C) a decrease in the labor force
D) an increase in the population
Figure 16.1Refer to Figure 16.1. Which of the following causes the ppf to shift from ppf2 to ppf3?
A) technological progress
B) a decrease in capital stock
C) a decrease in the labor force
D) an increase in the population
سؤال
سؤال
سؤال
Refer to the information provided in Figure 16.2 below to answer the questions that follow. Figure 16.2
Refer to Figure 16.2. Suboptimal production occurs when the economy is at Point
A) A.
B) B.
C) C.
D) D.
Figure 16.2Refer to Figure 16.2. Suboptimal production occurs when the economy is at Point
A) A.
B) B.
C) C.
D) D.
سؤال
سؤال
سؤال
سؤال
سؤال
Refer to the information provided in Figure 16.2 below to answer the questions that follow. Figure 16.2
Refer to Figure 16.2. Point ________ is beyond the production capacity of this economy.
A) A
B) B
C) C
D) D
Figure 16.2Refer to Figure 16.2. Point ________ is beyond the production capacity of this economy.
A) A
B) B
C) C
D) D
سؤال
سؤال
سؤال
سؤال
Refer to the information provided in Figure 16.2 below to answer the questions that follow. Figure 16.2
Refer to Figure 16.2. An economy that chooses to be at Point B rather than Point A will achieve ________ in the future.
A) lower consumption levels
B) lower employment levels
C) a higher economic growth rate
D) higher opportunity costs
Figure 16.2Refer to Figure 16.2. An economy that chooses to be at Point B rather than Point A will achieve ________ in the future.
A) lower consumption levels
B) lower employment levels
C) a higher economic growth rate
D) higher opportunity costs
سؤال
Refer to the information provided in Figure 16.2 below to answer the questions that follow. Figure 16.2
Refer to Figure 16.2. An economy that chooses to be at Point ________ can achieve higher economic growth rate in the future.
A) A
B) B
C) C
D) D
Figure 16.2Refer to Figure 16.2. An economy that chooses to be at Point ________ can achieve higher economic growth rate in the future.
A) A
B) B
C) C
D) D
سؤال
Refer to the information provided in Figure 16.2 below to answer the questions that follow. Figure 16.2
Refer to Figure 16.2. Point ________ can not be produced by the people of this society.
A) A
B) B
C) C
D) D
Figure 16.2Refer to Figure 16.2. Point ________ can not be produced by the people of this society.
A) A
B) B
C) C
D) D
سؤال
سؤال
سؤال
سؤال
سؤال
سؤال
سؤال
سؤال
سؤال
سؤال
سؤال
سؤال
سؤال
سؤال
سؤال
سؤال
سؤال
سؤال
سؤال
سؤال
سؤال
سؤال
سؤال
سؤال
سؤال
سؤال
سؤال
سؤال
سؤال
سؤال
سؤال
سؤال
سؤال
سؤال
سؤال
سؤال
سؤال
سؤال
سؤال
سؤال
سؤال
سؤال
سؤال
سؤال
سؤال
سؤال

فتح الحزمة
قم بالتسجيل لفتح البطاقات في هذه المجموعة!
Unlock Deck
Unlock Deck
1/196
العب
ملء الشاشة (f)
Deck 16: Long-Run Growth
1
Refer to the information provided in Figure 16.1 below to answer the questions that follow. Figure 16.1
Refer to Figure 16.1. Which of the following will cause a movement from Point D to Point A?
A) an increase in the productivity of workers
B) technological progress
C) an increase in capital stock
D) all of the above
Figure 16.1Refer to Figure 16.1. Which of the following will cause a movement from Point D to Point A?
A) an increase in the productivity of workers
B) technological progress
C) an increase in capital stock
D) all of the above
D
2
Output growth is defined as the growth rate of output
A) per person in the economy.
B) per worker in the economy.
C) for capitalist economies.
D) of the entire economy.
A) per person in the economy.
B) per worker in the economy.
C) for capitalist economies.
D) of the entire economy.
D
3
Refer to the information provided in Figure 16.1 below to answer the questions that follow. Figure 16.1
Refer to Figure 16.1. Economic growth is represented by
A) a movement from point D to point C.
B) a movement from point A to point C.
C) a movement from point D to point A.
D) all of the above
Figure 16.1Refer to Figure 16.1. Economic growth is represented by
A) a movement from point D to point C.
B) a movement from point A to point C.
C) a movement from point D to point A.
D) all of the above
D
4
Refer to the information provided in Figure 16.1 below to answer the questions that follow. Figure 16.1
Refer to Figure 16.1. Economic growth is represented by
A) a movement from Point A to Point B along ppf1.
B) a movement from Point C to Point B.
C) a movement from Point B to Point A.
D) a shift in the production possibilities frontier from ppf2 to ppf3.
Figure 16.1Refer to Figure 16.1. Economic growth is represented by
A) a movement from Point A to Point B along ppf1.
B) a movement from Point C to Point B.
C) a movement from Point B to Point A.
D) a shift in the production possibilities frontier from ppf2 to ppf3.
فتح الحزمة
افتح القفل للوصول البطاقات البالغ عددها 196 في هذه المجموعة.
فتح الحزمة
k this deck
5
Economic growth allows a society to consume
A) more goods per person.
B) more than it should.
C) more than is sustainable.
D) exactly what it needs.
A) more goods per person.
B) more than it should.
C) more than is sustainable.
D) exactly what it needs.
فتح الحزمة
افتح القفل للوصول البطاقات البالغ عددها 196 في هذه المجموعة.
فتح الحزمة
k this deck
6
Refer to the information provided in Figure 16.1 below to answer the questions that follow. Figure 16.1
Refer to Figure 16.1. Economic growth is represented by
A) a movement from Point A to Point B along ppf1.
B) a movement from Point B to Point C.
C) a movement from Point B to Point A.
D) a shift in the production possibilities frontier from ppf2 to ppf1.
Figure 16.1Refer to Figure 16.1. Economic growth is represented by
A) a movement from Point A to Point B along ppf1.
B) a movement from Point B to Point C.
C) a movement from Point B to Point A.
D) a shift in the production possibilities frontier from ppf2 to ppf1.
فتح الحزمة
افتح القفل للوصول البطاقات البالغ عددها 196 في هذه المجموعة.
فتح الحزمة
k this deck
7
Per-capita output growth is the growth rate of output
A) per person in the economy.
B) per worker in the economy.
C) for capitalist economies.
D) of the entire economy.
A) per person in the economy.
B) per worker in the economy.
C) for capitalist economies.
D) of the entire economy.
فتح الحزمة
افتح القفل للوصول البطاقات البالغ عددها 196 في هذه المجموعة.
فتح الحزمة
k this deck
8
Refer to the information provided in Figure 16.1 below to answer the questions that follow. Figure 16.1
Refer to Figure 16.1. A movement from Point D to Point C represents
A) a decrease in capital stock.
B) economic growth.
C) economic decline.
D) a decrease in the labor force.
Figure 16.1Refer to Figure 16.1. A movement from Point D to Point C represents
A) a decrease in capital stock.
B) economic growth.
C) economic decline.
D) a decrease in the labor force.
فتح الحزمة
افتح القفل للوصول البطاقات البالغ عددها 196 في هذه المجموعة.
فتح الحزمة
k this deck
9
Refer to the information provided in Figure 16.1 below to answer the questions that follow. Figure 16.1
Refer to Figure 16.1. Which of the following causes the ppf to shift from ppf2 to ppf1?
A) technological progress
B) a decrease in capital stock
C) an increase in the labor force
D) an increase in per capita income
Figure 16.1Refer to Figure 16.1. Which of the following causes the ppf to shift from ppf2 to ppf1?
A) technological progress
B) a decrease in capital stock
C) an increase in the labor force
D) an increase in per capita income
فتح الحزمة
افتح القفل للوصول البطاقات البالغ عددها 196 في هذه المجموعة.
فتح الحزمة
k this deck
10
Economic growth allows a society to consume
A) more goods per person.
B) a higher quality of goods.
C) a wider variety of goods.
D) all of the above
A) more goods per person.
B) a higher quality of goods.
C) a wider variety of goods.
D) all of the above
فتح الحزمة
افتح القفل للوصول البطاقات البالغ عددها 196 في هذه المجموعة.
فتح الحزمة
k this deck
11
Refer to the information provided in Figure 16.1 below to answer the questions that follow. Figure 16.1
Refer to Figure 16.1. Technological progress will cause a
A) movement from Point A to Point B.
B) movement from Point B to Point A.
C) shift from ppf2 to ppf1.
D) shift from ppf2 to ppf3.
Figure 16.1Refer to Figure 16.1. Technological progress will cause a
A) movement from Point A to Point B.
B) movement from Point B to Point A.
C) shift from ppf2 to ppf1.
D) shift from ppf2 to ppf3.
فتح الحزمة
افتح القفل للوصول البطاقات البالغ عددها 196 في هذه المجموعة.
فتح الحزمة
k this deck
12
Refer to the information provided in Figure 16.1 below to answer the questions that follow. Figure 16.1
Refer to Figure 16.1. A movement from Point B to Point D represents
A) an increase in capital stock.
B) technological progress.
C) economic decline.
D) an increase in the labor force.
Figure 16.1Refer to Figure 16.1. A movement from Point B to Point D represents
A) an increase in capital stock.
B) technological progress.
C) economic decline.
D) an increase in the labor force.
فتح الحزمة
افتح القفل للوصول البطاقات البالغ عددها 196 في هذه المجموعة.
فتح الحزمة
k this deck
13
Labor productivity growth is the growth rate of output
A) per person in the economy.
B) per worker in the economy.
C) for labor-intensive economies.
D) for the entire economy.
A) per person in the economy.
B) per worker in the economy.
C) for labor-intensive economies.
D) for the entire economy.
فتح الحزمة
افتح القفل للوصول البطاقات البالغ عددها 196 في هذه المجموعة.
فتح الحزمة
k this deck
14
Refer to the information provided in Figure 16.1 below to answer the questions that follow. Figure 16.1
Refer to Figure 16.1. An economic decline is represented by a movement from
A) point A to point B.
B) point D to point A.
C) point C to point A.
D) point B to point A.
Figure 16.1Refer to Figure 16.1. An economic decline is represented by a movement from
A) point A to point B.
B) point D to point A.
C) point C to point A.
D) point B to point A.
فتح الحزمة
افتح القفل للوصول البطاقات البالغ عددها 196 في هذه المجموعة.
فتح الحزمة
k this deck
15
Refer to the information provided in Figure 16.1 below to answer the questions that follow. Figure 16.1
Refer to Figure 16.1. A decrease in the labor force will cause a
A) movement from Point A to Point B.
B) movement from Point B to Point A.
C) shift from ppf2 to ppf1.
D) shift from ppf2 to ppf3.
Figure 16.1Refer to Figure 16.1. A decrease in the labor force will cause a
A) movement from Point A to Point B.
B) movement from Point B to Point A.
C) shift from ppf2 to ppf1.
D) shift from ppf2 to ppf3.
فتح الحزمة
افتح القفل للوصول البطاقات البالغ عددها 196 في هذه المجموعة.
فتح الحزمة
k this deck
16
Refer to the information provided in Figure 16.1 below to answer the questions that follow. Figure 16.1
Refer to Figure 16.1. Which of the following cannot cause a movement from Point A to Point C?
A) an expansionary monetary policy
B) technological progress
C) an increase in capital stock
D) an increase in the productivity of workers
Figure 16.1Refer to Figure 16.1. Which of the following cannot cause a movement from Point A to Point C?
A) an expansionary monetary policy
B) technological progress
C) an increase in capital stock
D) an increase in the productivity of workers
فتح الحزمة
افتح القفل للوصول البطاقات البالغ عددها 196 في هذه المجموعة.
فتح الحزمة
k this deck
17
Which of the following is a source of economic growth?
A) more resources
B) active economic policies
C) technology
D) both A and C
A) more resources
B) active economic policies
C) technology
D) both A and C
فتح الحزمة
افتح القفل للوصول البطاقات البالغ عددها 196 في هذه المجموعة.
فتح الحزمة
k this deck
18
For economic growth to increase living standards,
A) society must discover ways of using available resources more efficiently.
B) the choices available to consumers must increase.
C) the rate of growth must exceed the rate of population increase.
D) society must acquire more resources.
A) society must discover ways of using available resources more efficiently.
B) the choices available to consumers must increase.
C) the rate of growth must exceed the rate of population increase.
D) society must acquire more resources.
فتح الحزمة
افتح القفل للوصول البطاقات البالغ عددها 196 في هذه المجموعة.
فتح الحزمة
k this deck
19
Refer to the information provided in Figure 16.2 below to answer the questions that follow. Figure 16.2
Refer to Figure 16.2. The highest unemployment rate occurs when the economy is at Point
A) A.
B) B.
C) C.
D) D.
Figure 16.2Refer to Figure 16.2. The highest unemployment rate occurs when the economy is at Point
A) A.
B) B.
C) C.
D) D.
فتح الحزمة
افتح القفل للوصول البطاقات البالغ عددها 196 في هذه المجموعة.
فتح الحزمة
k this deck
20
Refer to the information provided in Figure 16.1 below to answer the questions that follow. Figure 16.1
Refer to Figure 16.1. Which of the following causes the ppf to shift from ppf2 to ppf3?
A) technological progress
B) a decrease in capital stock
C) a decrease in the labor force
D) an increase in the population
Figure 16.1Refer to Figure 16.1. Which of the following causes the ppf to shift from ppf2 to ppf3?
A) technological progress
B) a decrease in capital stock
C) a decrease in the labor force
D) an increase in the population
فتح الحزمة
افتح القفل للوصول البطاقات البالغ عددها 196 في هذه المجموعة.
فتح الحزمة
k this deck
21
Convergence theory suggests that gaps in ________ tend to close over time.
A) national income
B) population levels
C) unemployment rates
D) inflation rates
A) national income
B) population levels
C) unemployment rates
D) inflation rates
فتح الحزمة
افتح القفل للوصول البطاقات البالغ عددها 196 في هذه المجموعة.
فتح الحزمة
k this deck
22
The growth rate of output per person in the economy is called
A) factor growth.
B) labor productivity growth.
C) per-capita output growth.
D) output growth.
A) factor growth.
B) labor productivity growth.
C) per-capita output growth.
D) output growth.
فتح الحزمة
افتح القفل للوصول البطاقات البالغ عددها 196 في هذه المجموعة.
فتح الحزمة
k this deck
23
Refer to the information provided in Figure 16.2 below to answer the questions that follow. Figure 16.2
Refer to Figure 16.2. Suboptimal production occurs when the economy is at Point
A) A.
B) B.
C) C.
D) D.
Figure 16.2Refer to Figure 16.2. Suboptimal production occurs when the economy is at Point
A) A.
B) B.
C) C.
D) D.
فتح الحزمة
افتح القفل للوصول البطاقات البالغ عددها 196 في هذه المجموعة.
فتح الحزمة
k this deck
24
The growth rate of output per worker is called
A) factor growth.
B) labor productivity growth.
C) per-capita output growth.
D) output growth.
A) factor growth.
B) labor productivity growth.
C) per-capita output growth.
D) output growth.
فتح الحزمة
افتح القفل للوصول البطاقات البالغ عددها 196 في هذه المجموعة.
فتح الحزمة
k this deck
25
An increase in real GDP per capita is the strict definition of economic growth that serves to
A) increase living standards.
B) increase the population.
C) decrease inflation.
D) increase the money supply.
A) increase living standards.
B) increase the population.
C) decrease inflation.
D) increase the money supply.
فتح الحزمة
افتح القفل للوصول البطاقات البالغ عددها 196 في هذه المجموعة.
فتح الحزمة
k this deck
26
In Ansonia, real GDP increased by 9% and the population increased by 9% in 2017. In 2017, Ansonia experienced
A) economic growth, but not an increase in living standards.
B) economic growth and an increase in living standards.
C) no economic growth, but an increase in living standards.
D) no economic growth and no increase in living standards.
A) economic growth, but not an increase in living standards.
B) economic growth and an increase in living standards.
C) no economic growth, but an increase in living standards.
D) no economic growth and no increase in living standards.
فتح الحزمة
افتح القفل للوصول البطاقات البالغ عددها 196 في هذه المجموعة.
فتح الحزمة
k this deck
27
Higher productivity can be achieved through
A) innovation.
B) new techniques of production.
C) a better-educated workforce.
D) all of the above
A) innovation.
B) new techniques of production.
C) a better-educated workforce.
D) all of the above
فتح الحزمة
افتح القفل للوصول البطاقات البالغ عددها 196 في هذه المجموعة.
فتح الحزمة
k this deck
28
Refer to the information provided in Figure 16.2 below to answer the questions that follow. Figure 16.2
Refer to Figure 16.2. Point ________ is beyond the production capacity of this economy.
A) A
B) B
C) C
D) D
Figure 16.2Refer to Figure 16.2. Point ________ is beyond the production capacity of this economy.
A) A
B) B
C) C
D) D
فتح الحزمة
افتح القفل للوصول البطاقات البالغ عددها 196 في هذه المجموعة.
فتح الحزمة
k this deck
29
For economic growth to ________, the rate of growth must exceed the rate of population increase.
A) result from a decrease in the labor force
B) occur with increasing unemployment levels
C) increase living standards
D) all of the above
A) result from a decrease in the labor force
B) occur with increasing unemployment levels
C) increase living standards
D) all of the above
فتح الحزمة
افتح القفل للوصول البطاقات البالغ عددها 196 في هذه المجموعة.
فتح الحزمة
k this deck
30
In Vidalia, real GDP increased by 6% and the population increased by 9% in 2016. In 2016, Vidalia experienced
A) economic growth, but not an increase in living standards.
B) economic growth and an increase in living standards.
C) no economic growth, but an increase in living standards.
D) an economic decline.
A) economic growth, but not an increase in living standards.
B) economic growth and an increase in living standards.
C) no economic growth, but an increase in living standards.
D) an economic decline.
فتح الحزمة
افتح القفل للوصول البطاقات البالغ عددها 196 في هذه المجموعة.
فتح الحزمة
k this deck
31
Of the following countries, which one had the highest average growth rate per year from 1996-2013?
A) China
B) the United States
C) India
D) Japan
A) China
B) the United States
C) India
D) Japan
فتح الحزمة
افتح القفل للوصول البطاقات البالغ عددها 196 في هذه المجموعة.
فتح الحزمة
k this deck
32
Refer to the information provided in Figure 16.2 below to answer the questions that follow. Figure 16.2
Refer to Figure 16.2. An economy that chooses to be at Point B rather than Point A will achieve ________ in the future.
A) lower consumption levels
B) lower employment levels
C) a higher economic growth rate
D) higher opportunity costs
Figure 16.2Refer to Figure 16.2. An economy that chooses to be at Point B rather than Point A will achieve ________ in the future.
A) lower consumption levels
B) lower employment levels
C) a higher economic growth rate
D) higher opportunity costs
فتح الحزمة
افتح القفل للوصول البطاقات البالغ عددها 196 في هذه المجموعة.
فتح الحزمة
k this deck
33
Refer to the information provided in Figure 16.2 below to answer the questions that follow. Figure 16.2
Refer to Figure 16.2. An economy that chooses to be at Point ________ can achieve higher economic growth rate in the future.
A) A
B) B
C) C
D) D
Figure 16.2Refer to Figure 16.2. An economy that chooses to be at Point ________ can achieve higher economic growth rate in the future.
A) A
B) B
C) C
D) D
فتح الحزمة
افتح القفل للوصول البطاقات البالغ عددها 196 في هذه المجموعة.
فتح الحزمة
k this deck
34
Refer to the information provided in Figure 16.2 below to answer the questions that follow. Figure 16.2
Refer to Figure 16.2. Point ________ can not be produced by the people of this society.
A) A
B) B
C) C
D) D
Figure 16.2Refer to Figure 16.2. Point ________ can not be produced by the people of this society.
A) A
B) B
C) C
D) D
فتح الحزمة
افتح القفل للوصول البطاقات البالغ عددها 196 في هذه المجموعة.
فتح الحزمة
k this deck
35
In Polynomia, real GDP increased by 8% and the population increased by 3% in 2016. In 2016, Polynomia experienced
A) economic growth, but not an increase in living standards.
B) economic growth and an increase in living standards.
C) no economic growth, but an increase in living standards.
D) an economic decline.
A) economic growth, but not an increase in living standards.
B) economic growth and an increase in living standards.
C) no economic growth, but an increase in living standards.
D) an economic decline.
فتح الحزمة
افتح القفل للوصول البطاقات البالغ عددها 196 في هذه المجموعة.
فتح الحزمة
k this deck
36
________ allows a society to consume more goods per person.
A) Economic growth
B) A population increase
C) Higher interest rates
D) Increased opportunity cost
A) Economic growth
B) A population increase
C) Higher interest rates
D) Increased opportunity cost
فتح الحزمة
افتح القفل للوصول البطاقات البالغ عددها 196 في هذه المجموعة.
فتح الحزمة
k this deck
37
The strict definition of economic growth that serves to increase living standards is
A) an increase in real GDP per capita.
B) an increase in nominal GDP per capita.
C) an increase in capital accumulation per capita.
D) an increase in investment per capita.
A) an increase in real GDP per capita.
B) an increase in nominal GDP per capita.
C) an increase in capital accumulation per capita.
D) an increase in investment per capita.
فتح الحزمة
افتح القفل للوصول البطاقات البالغ عددها 196 في هذه المجموعة.
فتح الحزمة
k this deck
38
Expanding the production possibilities frontier occurs as a result of
A) higher wages.
B) output growth.
C) a changing allocation of existing resources.
D) increased demand.
A) higher wages.
B) output growth.
C) a changing allocation of existing resources.
D) increased demand.
فتح الحزمة
افتح القفل للوصول البطاقات البالغ عددها 196 في هذه المجموعة.
فتح الحزمة
k this deck
39
The growth rate of output of the entire economy is called
A) factor growth.
B) labor productivity growth.
C) per-capita output growth.
D) output growth.
A) factor growth.
B) labor productivity growth.
C) per-capita output growth.
D) output growth.
فتح الحزمة
افتح القفل للوصول البطاقات البالغ عددها 196 في هذه المجموعة.
فتح الحزمة
k this deck
40
________ allows a society to consume a higher quality of goods.
A) Economic need
B) Increased opportunity cost
C) Government regulation
D) Economic growth
A) Economic need
B) Increased opportunity cost
C) Government regulation
D) Economic growth
فتح الحزمة
افتح القفل للوصول البطاقات البالغ عددها 196 في هذه المجموعة.
فتح الحزمة
k this deck
41
Human capital increases with on-the-job training.
فتح الحزمة
افتح القفل للوصول البطاقات البالغ عددها 196 في هذه المجموعة.
فتح الحزمة
k this deck
42
Output growth is the growth rate of output of the entire economy.
فتح الحزمة
افتح القفل للوصول البطاقات البالغ عددها 196 في هذه المجموعة.
فتح الحزمة
k this deck
43
Innovation can lead to increased productivity.
فتح الحزمة
افتح القفل للوصول البطاقات البالغ عددها 196 في هذه المجموعة.
فتح الحزمة
k this deck
44
Output growth is another name for labor productivity growth.
فتح الحزمة
افتح القفل للوصول البطاقات البالغ عددها 196 في هذه المجموعة.
فتح الحزمة
k this deck
45
Total productivity of labor is measured as the total output produced by an additional worker.
فتح الحزمة
افتح القفل للوصول البطاقات البالغ عددها 196 في هذه المجموعة.
فتح الحزمة
k this deck
46
Human capital increases with college education.
فتح الحزمة
افتح القفل للوصول البطاقات البالغ عددها 196 في هذه المجموعة.
فتح الحزمة
k this deck
47
Of the following regions, which had the lowest average growth rate per year from 1996-2013?
A) China
B) the United States
C) Japan
D) Sub-Saharan Africa
A) China
B) the United States
C) Japan
D) Sub-Saharan Africa
فتح الحزمة
افتح القفل للوصول البطاقات البالغ عددها 196 في هذه المجموعة.
فتح الحزمة
k this deck
48
Average productivity of labor is measured as the additional output produced by an additional worker.
فتح الحزمة
افتح القفل للوصول البطاقات البالغ عددها 196 في هذه المجموعة.
فتح الحزمة
k this deck
49
Convergence theory suggests that gaps in national incomes
A) tend to close over time.
B) widen over time.
C) do not seem to change over time.
D) are irrelevant in global economies.
A) tend to close over time.
B) widen over time.
C) do not seem to change over time.
D) are irrelevant in global economies.
فتح الحزمة
افتح القفل للوصول البطاقات البالغ عددها 196 في هذه المجموعة.
فتح الحزمة
k this deck
50
In Chrysalis, real GDP decreased by 3% and the population decreased by 10% in 2017. In 2017, Chrysalis experienced
A) economic growth, but not an increase in living standards.
B) economic growth and an increase in living standards.
C) no economic growth, but an increase in living standards.
D) no economic growth and no increase in living standards.
A) economic growth, but not an increase in living standards.
B) economic growth and an increase in living standards.
C) no economic growth, but an increase in living standards.
D) no economic growth and no increase in living standards.
فتح الحزمة
افتح القفل للوصول البطاقات البالغ عددها 196 في هذه المجموعة.
فتح الحزمة
k this deck
51
Increased labor productivity shifts the production possibility curve away from the origin.
فتح الحزمة
افتح القفل للوصول البطاقات البالغ عددها 196 في هذه المجموعة.
فتح الحزمة
k this deck
52
Technological progress shifts the production possibility curve away from the origin.
فتح الحزمة
افتح القفل للوصول البطاقات البالغ عددها 196 في هذه المجموعة.
فتح الحزمة
k this deck
53
If a society acquires more human capital, per capita production will fall unless it gets more physical capital too.
فتح الحزمة
افتح القفل للوصول البطاقات البالغ عددها 196 في هذه المجموعة.
فتح الحزمة
k this deck
54
The production possibility frontier shows the maximum output a nation can produce with available resources.
فتح الحزمة
افتح القفل للوصول البطاقات البالغ عددها 196 في هذه المجموعة.
فتح الحزمة
k this deck
55
Labor productivity growth is the growth rate of output per person in the economy.
فتح الحزمة
افتح القفل للوصول البطاقات البالغ عددها 196 في هذه المجموعة.
فتح الحزمة
k this deck
56
From 1996-2013, China had an average growth rate per year that was four times as high as that in the United States.
فتح الحزمة
افتح القفل للوصول البطاقات البالغ عددها 196 في هذه المجموعة.
فتح الحزمة
k this deck
57
Convergence theory suggests that when less developed countries begin to develop, they typically have higher growth rates as they catch up with more developed nations.
فتح الحزمة
افتح القفل للوصول البطاقات البالغ عددها 196 في هذه المجموعة.
فتح الحزمة
k this deck
58
If a society gets more capital, its production possibility curve increases.
فتح الحزمة
افتح القفل للوصول البطاقات البالغ عددها 196 في هذه المجموعة.
فتح الحزمة
k this deck
59
Per-capita growth is the growth rate of output per person in the economy.
فتح الحزمة
افتح القفل للوصول البطاقات البالغ عددها 196 في هذه المجموعة.
فتح الحزمة
k this deck
60
Economic decline will shift a society's production possibility frontier down and to the left.
فتح الحزمة
افتح القفل للوصول البطاقات البالغ عددها 196 في هذه المجموعة.
فتح الحزمة
k this deck
61
The aggregate production function is Y = 2K0.5L0.5. If there are 225 units of capital and 196 units of labor, aggregate output is
A) 420 units.
B) 508 units.
C) 700 units.
D) 842 units.
A) 420 units.
B) 508 units.
C) 700 units.
D) 842 units.
فتح الحزمة
افتح القفل للوصول البطاقات البالغ عددها 196 في هذه المجموعة.
فتح الحزمة
k this deck
62
If the capital stock remains fixed while the supply of labor increases, it is likely that
A) the productivity of labor will rise.
B) the productivity of labor will fall.
C) the productivity of labor will not change.
D) output per capita will rise.
A) the productivity of labor will rise.
B) the productivity of labor will fall.
C) the productivity of labor will not change.
D) output per capita will rise.
فتح الحزمة
افتح القفل للوصول البطاقات البالغ عددها 196 في هذه المجموعة.
فتح الحزمة
k this deck
63
If labor productivity in a steel mine is 3.5 tons per worker, then 400 steel workers with a fixed amount of capital produce
A) 87.5 tons.
B) 1,400 tons.
C) 1,750 tons.
D) 4,000 tons.
A) 87.5 tons.
B) 1,400 tons.
C) 1,750 tons.
D) 4,000 tons.
فتح الحزمة
افتح القفل للوصول البطاقات البالغ عددها 196 في هذه المجموعة.
فتح الحزمة
k this deck
64
Economic growth is an increase in real GDP per capita.
فتح الحزمة
افتح القفل للوصول البطاقات البالغ عددها 196 في هذه المجموعة.
فتح الحزمة
k this deck
65
The mathematical representation of the technological relationship between inputs and national output is known as the
A) aggregate supply function.
B) production possibilities frontier.
C) aggregate production function.
D) input-output table.
A) aggregate supply function.
B) production possibilities frontier.
C) aggregate production function.
D) input-output table.
فتح الحزمة
افتح القفل للوصول البطاقات البالغ عددها 196 في هذه المجموعة.
فتح الحزمة
k this deck
66
Diminishing returns to a factor implies that with capital fixed,
A) as labor increases output always increases.
B) as output increases, labor increases.
C) as labor increases, output decreases.
D) as labor increases, labor productivity eventually decreases.
A) as labor increases output always increases.
B) as output increases, labor increases.
C) as labor increases, output decreases.
D) as labor increases, labor productivity eventually decreases.
فتح الحزمة
افتح القفل للوصول البطاقات البالغ عددها 196 في هذه المجموعة.
فتح الحزمة
k this deck
67
Thomas Malthus and David Ricardo believed that to increase agricultural output, people would be forced to
A) farm land more intensively, in which case the returns to successive increases in population would diminish.
B) farm land less intensively, in which case the returns to successive increases in population would increase.
C) farm land more intensively, in which case the returns to successive increases in population would increase.
D) farm land less intensively, in which case the returns to successive increases in population would diminish.
فتح الحزمة
افتح القفل للوصول البطاقات البالغ عددها 196 في هذه المجموعة.
فتح الحزمة
k this deck
68
Labor productivity increases when
A) labor and output increase proportionately.
B) capital increases and labor remains constant.
C) output decreases and labor increases.
D) capital/labor ratio decreases.
A) labor and output increase proportionately.
B) capital increases and labor remains constant.
C) output decreases and labor increases.
D) capital/labor ratio decreases.
فتح الحزمة
افتح القفل للوصول البطاقات البالغ عددها 196 في هذه المجموعة.
فتح الحزمة
k this deck
69
With a fixed amount of capital, 300 workers produce 9,000 cars. The average labor productivity is
A) 0.03.
B) 3.
C) 27.
D) 30.
A) 0.03.
B) 3.
C) 27.
D) 30.
فتح الحزمة
افتح القفل للوصول البطاقات البالغ عددها 196 في هذه المجموعة.
فتح الحزمة
k this deck
70
An increase in the capital stock
A) can increase output, even if it is not accompanied by an increase in the labor force.
B) provides valuable services directly, but not indirectly.
C) can increase output, but only if it is accompanied by an increase in the labor force.
D) cannot increase output, even if it is accompanied by an increase in the labor force.
فتح الحزمة
افتح القفل للوصول البطاقات البالغ عددها 196 في هذه المجموعة.
فتح الحزمة
k this deck
71
A company uses 200 workers and 50 units of capital to produce 1,000 units of output. Its average labor productivity is
A) 4.
B) 5.
C) 20.
D) 25.
A) 4.
B) 5.
C) 20.
D) 25.
فتح الحزمة
افتح القفل للوصول البطاقات البالغ عددها 196 في هذه المجموعة.
فتح الحزمة
k this deck
72
An increase in capital stock
A) enhances labor productivity.
B) provides valuable services directly.
C) causes economic growth.
D) all of the above
A) enhances labor productivity.
B) provides valuable services directly.
C) causes economic growth.
D) all of the above
فتح الحزمة
افتح القفل للوصول البطاقات البالغ عددها 196 في هذه المجموعة.
فتح الحزمة
k this deck
73
An important source of increasing productivity is
A) an increase in the ratio of capital to labor.
B) an increase in the ratio of labor to capital.
C) a decrease in the ratio of capital to labor.
D) faster growth in the labor force than in the capital stock.
A) an increase in the ratio of capital to labor.
B) an increase in the ratio of labor to capital.
C) a decrease in the ratio of capital to labor.
D) faster growth in the labor force than in the capital stock.
فتح الحزمة
افتح القفل للوصول البطاقات البالغ عددها 196 في هذه المجموعة.
فتح الحزمة
k this deck
74
The aggregate production function is Y = 3KL. If there are 30 units of capital and 40 units of labor, aggregate output is
A) 3,600 units.
B) 2,500 units.
C) 2,100 units.
D) 400 units.
A) 3,600 units.
B) 2,500 units.
C) 2,100 units.
D) 400 units.
فتح الحزمة
افتح القفل للوصول البطاقات البالغ عددها 196 في هذه المجموعة.
فتح الحزمة
k this deck
75
The aggregate production function is Y = 5K0.5L0.5. If there are 49 units of capital and 16 units of labor, aggregate output is
A) 60 units.
B) 70 units.
C) 140 units.
D) 325 units.
A) 60 units.
B) 70 units.
C) 140 units.
D) 325 units.
فتح الحزمة
افتح القفل للوصول البطاقات البالغ عددها 196 في هذه المجموعة.
فتح الحزمة
k this deck
76
The aggregate production function is the mathematical representation of the technological relationship between
A) national output and fiscal policy.
B) national output and inputs.
C) fiscal and monetary policy changes and national output.
D) the rate of capital accumulation and national output.
A) national output and fiscal policy.
B) national output and inputs.
C) fiscal and monetary policy changes and national output.
D) the rate of capital accumulation and national output.
فتح الحزمة
افتح القفل للوصول البطاقات البالغ عددها 196 في هذه المجموعة.
فتح الحزمة
k this deck
77
A company uses 100 workers and 30 units of capital to produce 500 units of output. If this company increases its capital to 50 units and, as a result, its output increases by 300 units, the productivity of labor ________ to ________ units per worker.
A) increases; 8
B) increases; 1
C) increases; 3
D) decreases; 4
A) increases; 8
B) increases; 1
C) increases; 3
D) decreases; 4
فتح الحزمة
افتح القفل للوصول البطاقات البالغ عددها 196 في هذه المجموعة.
فتح الحزمة
k this deck
78
Convergence theory seems to fit the experiences of China and India since 1996.
فتح الحزمة
افتح القفل للوصول البطاقات البالغ عددها 196 في هذه المجموعة.
فتح الحزمة
k this deck
79
Globally, from 1996-2013 the highest average growth rate per year occurred on the continent of Africa.
فتح الحزمة
افتح القفل للوصول البطاقات البالغ عددها 196 في هذه المجموعة.
فتح الحزمة
k this deck
80
In all economies experiencing modern economic growth,
A) labor expands at a more rapid pace than capital.
B) capital and labor expand at a constant rate.
C) capital expands at a more rapid pace than labor.
D) capital expands, but labor remains constant.
A) labor expands at a more rapid pace than capital.
B) capital and labor expand at a constant rate.
C) capital expands at a more rapid pace than labor.
D) capital expands, but labor remains constant.
فتح الحزمة
افتح القفل للوصول البطاقات البالغ عددها 196 في هذه المجموعة.
فتح الحزمة
k this deck
فتح الحزمة
افتح القفل للوصول البطاقات البالغ عددها 196 في هذه المجموعة.


