Deck 4: Linear Regression With One Regressor
ملء الشاشة (f)
سؤال
The standard error of the regression (SER)is defined as follows
A)
B)SSR
C)1-R2
D)
A)
B)SSR
C)1-R2
D)
سؤال
The regression R2 is defined as follows:
A)
B)
C)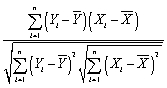
D)
A)
B)
C)
D)
سؤال
When the estimated slope coefficient in the simple regression model,  1,is zero,then
A)R2 = .
.
B)0 < R2 < 1.
C)R2 = 0.
D)R2 > (SSR/TSS).
1,is zero,thenA)R2 =
.B)0 < R2 < 1.
C)R2 = 0.
D)R2 > (SSR/TSS).
سؤال
سؤال
سؤال
سؤال
سؤال
سؤال
(Requires Appendix)The sample regression line estimated by OLS
A)will always have a slope smaller than the intercept.
B)is exactly the same as the population regression line.
C)cannot have a slope of zero.
D)will always run through the point ( ,
,
 ).
).
A)will always have a slope smaller than the intercept.
B)is exactly the same as the population regression line.
C)cannot have a slope of zero.
D)will always run through the point (
, ). سؤال
سؤال
سؤال
سؤال
سؤال
سؤال
The normal approximation to the sampling distribution of  1 is powerful because
A)many explanatory variables in real life are normally distributed.
B)it allows econometricians to develop methods for statistical inference.
C)many other distributions are not symmetric.
D)is implies that OLS is the BLUE estimator for β1.
1 is powerful becauseA)many explanatory variables in real life are normally distributed.
B)it allows econometricians to develop methods for statistical inference.
C)many other distributions are not symmetric.
D)is implies that OLS is the BLUE estimator for β1.
سؤال
سؤال
If the three least squares assumptions hold,then the large sample normal distribution of  1 is
1 is
A)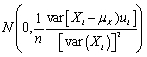 .
.
B)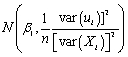 .
.
C)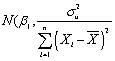 .
.
D)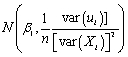 .
.
1 isA)
.B)
.C)
.D)
. سؤال
سؤال
The OLS residuals,  i,are defined as follows:
A) i -
i -
 0 -
0 -
 1Xi
1Xi
B)Yi - β0 - β1Xi
C)Yi - i
i
D)(Yi - )2
)2
i,are defined as follows:A)
i - 0 - 1XiB)Yi - β0 - β1Xi
C)Yi -
iD)(Yi -
)2 سؤال
The variance of Yi is given by
A) +
+
 var(Xi)+ var(ui).
B)the variance of ui.
C) var(Xi)+ var(ui).
D)the variance of the residuals.
A)
+ var(Xi)+ var(ui).B)the variance of ui.
C)
var(Xi)+ var(ui).D)the variance of the residuals.
سؤال
In 2001,the Arizona Diamondbacks defeated the New York Yankees in the Baseball World Series in 7 games.Some players,such as Bautista and Finley for the Diamondbacks,had a substantially higher batting average during the World Series than during the regular season.Others,such as Brosius and Jeter for the Yankees,did substantially poorer.You set out to investigate whether or not the regular season batting average is a good indicator for the World Series batting average.The results for 11 players who had the most at bats for the two teams are:  = -0.347 + 2.290 AZSeasavg ,R2=0.11,SER = 0.145,
  = 0.134 + 0.136 NYSeasavg ,R2=0.001,SER = 0.092,
where Wsavg and Seasavg indicate the batting average during the World Series and the regular season respectively.
(a)Focusing on the coefficients first,what is your interpretation?
(b)What can you say about the explanatory power of your equation? What do you conclude from this?
= -0.347 + 2.290 AZSeasavg ,R2=0.11,SER = 0.145, = 0.134 + 0.136 NYSeasavg ,R2=0.001,SER = 0.092,where Wsavg and Seasavg indicate the batting average during the World Series and the regular season respectively.
(a)Focusing on the coefficients first,what is your interpretation?
(b)What can you say about the explanatory power of your equation? What do you conclude from this?
سؤال
The neoclassical growth model predicts that for identical savings rates and population growth rates,countries should converge to the per capita income level.This is referred to as the convergence hypothesis.One way to test for the presence of convergence is to compare the growth rates over time to the initial starting level.
(a)If you regressed the average growth rate over a time period (1960-1990)on the initial level of per capita income,what would the sign of the slope have to be to indicate this type of convergence? Explain.Would this result confirm or reject the prediction of the neoclassical growth model?
(b)The results of the regression for 104 countries were as follows: = 0.019 - 0.0006 × RelProd60 ,R2 = 0.00007,SER = 0.016,
where g6090 is the average annual growth rate of GDP per worker for the 1960-1990 sample period,and RelProd60 is GDP per worker relative to the United States in 1960.
Interpret the results.Is there any evidence of unconditional convergence between the countries of the world? Is this result surprising? What other concept could you think about to test for convergence between countries?
(c)You decide to restrict yourself to the 24 OECD countries in the sample.This changes your regression output as follows: = 0.048 - 0.0404 RelProd60 ,R2 = 0.82 ,SER = 0.0046
How does this result affect your conclusions from above?
(a)If you regressed the average growth rate over a time period (1960-1990)on the initial level of per capita income,what would the sign of the slope have to be to indicate this type of convergence? Explain.Would this result confirm or reject the prediction of the neoclassical growth model?
(b)The results of the regression for 104 countries were as follows:
= 0.019 - 0.0006 × RelProd60 ,R2 = 0.00007,SER = 0.016,where g6090 is the average annual growth rate of GDP per worker for the 1960-1990 sample period,and RelProd60 is GDP per worker relative to the United States in 1960.
Interpret the results.Is there any evidence of unconditional convergence between the countries of the world? Is this result surprising? What other concept could you think about to test for convergence between countries?
(c)You decide to restrict yourself to the 24 OECD countries in the sample.This changes your regression output as follows:
= 0.048 - 0.0404 RelProd60 ,R2 = 0.82 ,SER = 0.0046How does this result affect your conclusions from above?
سؤال
For the simple regression model of Chapter 4,you have been given the following data:  = 274,745.75;
  = 8,248.979;
  = 5,392,705;
  = 163,513.03;
  = 179,878,841.13
(a)Calculate the regression slope and the intercept.
(b)Calculate the regression R2
= 274,745.75; = 8,248.979; = 5,392,705; = 163,513.03; = 179,878,841.13(a)Calculate the regression slope and the intercept.
(b)Calculate the regression R2
سؤال
سؤال
سؤال
سؤال
سؤال
سؤال
سؤال
The OLS residuals,  i,are sample counterparts of the population
A)regression function slope
B)errors
C)regression function's predicted values
D)regression function intercept
i,are sample counterparts of the populationA)regression function slope
B)errors
C)regression function's predicted values
D)regression function intercept
سؤال
You have obtained a sub-sample of 1744 individuals from the Current Population Survey (CPS)and are interested in the relationship between weekly earnings and age.The regression,using heteroskedasticity-robust standard errors,yielded the following result:  = 239.16 + 5.20 × Age,R2 = 0.05,SER = 287.21. ,
where Earn and Age are measured in dollars and years respectively.
(a)Interpret the results.
(b)Is the effect of age on earnings large?
(c)Why should age matter in the determination of earnings? Do the results suggest that there is a guarantee for earnings to rise for everyone as they become older? Do you think that the relationship between age and earnings is linear?
(d)The average age in this sample is 37.5 years.What is annual income in the sample?
(e)Interpret the measures of fit.
= 239.16 + 5.20 × Age,R2 = 0.05,SER = 287.21. ,where Earn and Age are measured in dollars and years respectively.
(a)Interpret the results.
(b)Is the effect of age on earnings large?
(c)Why should age matter in the determination of earnings? Do the results suggest that there is a guarantee for earnings to rise for everyone as they become older? Do you think that the relationship between age and earnings is linear?
(d)The average age in this sample is 37.5 years.What is annual income in the sample?
(e)Interpret the measures of fit.
سؤال
Your textbook presented you with the following regression output:  = 698.9 - 2.28 × STR
n = 420,R2 = 0.051,SER = 18.6
(a)How would the slope coefficient change,if you decided one day to measure testscores in 100s,i.e. ,a test score of 650 became 6.5? Would this have an effect on your interpretation?
(b)Do you think the regression R2 will change? Why or why not?
(c)Although Chapter 4 in your textbook did not deal with hypothesis testing,it presented you with the large sample distribution for the slope and the intercept estimator.Given the change in the units of measurement in (a),do you think that the variance of the slope estimator will change numerically? Why or why not?
= 698.9 - 2.28 × STRn = 420,R2 = 0.051,SER = 18.6
(a)How would the slope coefficient change,if you decided one day to measure testscores in 100s,i.e. ,a test score of 650 became 6.5? Would this have an effect on your interpretation?
(b)Do you think the regression R2 will change? Why or why not?
(c)Although Chapter 4 in your textbook did not deal with hypothesis testing,it presented you with the large sample distribution for the slope and the intercept estimator.Given the change in the units of measurement in (a),do you think that the variance of the slope estimator will change numerically? Why or why not?
سؤال
سؤال
سؤال
Assume that you have collected a sample of observations from over 100 households and their consumption and income patterns.Using these observations,you estimate the following regression Ci = β0+β1Yi+ ui where C is consumption and Y is disposable income.The estimate of β1 will tell you
A)
B)The amount you need to consume to survive
C)
D)
A)
B)The amount you need to consume to survive
C)
D)
سؤال
E(ui  Xi)= 0 says that
A)dividing the error by the explanatory variable results in a zero (on average).
B)the sample regression function residuals are unrelated to the explanatory variable.
C)the sample mean of the Xs is much larger than the sample mean of the errors.
D)the conditional distribution of the error given the explanatory variable has a zero mean.
Xi)= 0 says thatA)dividing the error by the explanatory variable results in a zero (on average).
B)the sample regression function residuals are unrelated to the explanatory variable.
C)the sample mean of the Xs is much larger than the sample mean of the errors.
D)the conditional distribution of the error given the explanatory variable has a zero mean.
سؤال
(Requires Appendix material)At a recent county fair,you observed that at one stand people's weight was forecasted,and were surprised by the accuracy (within a range).Thinking about how the person could have predicted your weight fairly accurately (despite the fact that she did not know about your "heavy bones"),you think about how this could have been accomplished.You remember that medical charts for children contain 5%,25%,50%,75% and 95% lines for a weight/height relationship and decide to conduct an experiment with 110 of your peers.You collect the data and calculate the following sums: 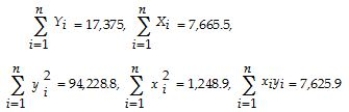 where the height is measured in inches and weight in pounds.(Small letters refer to deviations from means as in zi = Zi -
  )
)
(a)Calculate the slope and intercept of the regression and interpret these.
(b)Find the regression R2 and explain its meaning.What other factors can you think of that might have an influence on the weight of an individual?
where the height is measured in inches and weight in pounds.(Small letters refer to deviations from means as in zi = Zi - )(a)Calculate the slope and intercept of the regression and interpret these.
(b)Find the regression R2 and explain its meaning.What other factors can you think of that might have an influence on the weight of an individual?
سؤال
The baseball team nearest to your home town is,once again,not doing well.Given that your knowledge of what it takes to win in baseball is vastly superior to that of management,you want to find out what it takes to win in Major League Baseball (MLB).You therefore collect the winning percentage of all 30 baseball teams in MLB for 1999 and regress the winning percentage on what you consider the primary determinant for wins,which is quality pitching (team earned run average).You find the following information on team performance:
Summary of the Distribution of Winning Percentage and
Team Earned Run Average for MLB in 1999
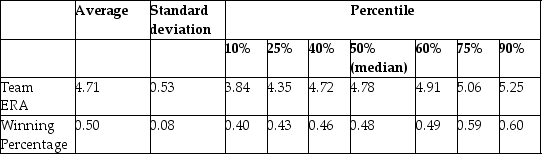 (a)What is your expected sign for the regression slope? Will it make sense to interpret the intercept? If not,should you omit it from your regression and force the regression line through the origin?
(b)OLS estimation of the relationship between the winning percentage and the team ERA yield the following: = 0.9 - 0.10 × teamera ,R2=0.49,SER = 0.06,
where winpct is measured as wins divided by games played,so for example a team that won half of its games would have Winpct = 0.50.Interpret your regression results.
(c)It is typically sufficient to win 90 games to be in the playoffs and/or to win a division.Winning over 100 games a season is exceptional: the Atlanta Braves had the most wins in 1999 with 103.Teams play a total of 162 games a year.Given this information,do you consider the slope coefficient to be large or small?
(d)What would be the effect on the slope,the intercept,and the regression R2 if you measured Winpct in percentage points,i.e. ,as (Wins/Games)× 100?
(e)Are you impressed with the size of the regression R2? Given that there is 51% of unexplained variation in the winning percentage,what might some of these factors be?
Summary of the Distribution of Winning Percentage and
Team Earned Run Average for MLB in 1999
(a)What is your expected sign for the regression slope? Will it make sense to interpret the intercept? If not,should you omit it from your regression and force the regression line through the origin?(b)OLS estimation of the relationship between the winning percentage and the team ERA yield the following:
= 0.9 - 0.10 × teamera ,R2=0.49,SER = 0.06,where winpct is measured as wins divided by games played,so for example a team that won half of its games would have Winpct = 0.50.Interpret your regression results.
(c)It is typically sufficient to win 90 games to be in the playoffs and/or to win a division.Winning over 100 games a season is exceptional: the Atlanta Braves had the most wins in 1999 with 103.Teams play a total of 162 games a year.Given this information,do you consider the slope coefficient to be large or small?
(d)What would be the effect on the slope,the intercept,and the regression R2 if you measured Winpct in percentage points,i.e. ,as (Wins/Games)× 100?
(e)Are you impressed with the size of the regression R2? Given that there is 51% of unexplained variation in the winning percentage,what might some of these factors be?
سؤال
Sir Francis Galton,a cousin of James Darwin,examined the relationship between the height of children and their parents towards the end of the 19th century.It is from this study that the name "regression" originated.You decide to update his findings by collecting data from 110 college students,and estimate the following relationship:  = 19.6 + 0.73 × Midparh,R2 = 0.45,SER = 2.0
where Studenth is the height of students in inches,and Midparh is the average of the parental heights.(Following Galton's methodology,both variables were adjusted so that the average female height was equal to the average male height. )
(a)Interpret the estimated coefficients.
(b)What is the meaning of the regression R2?
(c)What is the prediction for the height of a child whose parents have an average height of 70.06 inches?
(d)What is the interpretation of the SER here?
(e)Given the positive intercept and the fact that the slope lies between zero and one,what can you say about the height of students who have quite tall parents? Those who have quite short parents?
(f)Galton was concerned about the height of the English aristocracy and referred to the above result as "regression towards mediocrity." Can you figure out what his concern was? Why do you think that we refer to this result today as "Galton's Fallacy"?
= 19.6 + 0.73 × Midparh,R2 = 0.45,SER = 2.0where Studenth is the height of students in inches,and Midparh is the average of the parental heights.(Following Galton's methodology,both variables were adjusted so that the average female height was equal to the average male height. )
(a)Interpret the estimated coefficients.
(b)What is the meaning of the regression R2?
(c)What is the prediction for the height of a child whose parents have an average height of 70.06 inches?
(d)What is the interpretation of the SER here?
(e)Given the positive intercept and the fact that the slope lies between zero and one,what can you say about the height of students who have quite tall parents? Those who have quite short parents?
(f)Galton was concerned about the height of the English aristocracy and referred to the above result as "regression towards mediocrity." Can you figure out what his concern was? Why do you think that we refer to this result today as "Galton's Fallacy"?
سؤال
You have learned in one of your economics courses that one of the determinants of per capita income (the "Wealth of Nations")is the population growth rate.Furthermore you also found out that the Penn World Tables contain income and population data for 104 countries of the world.To test this theory,you regress the GDP per worker (relative to the United States)in 1990 (RelPersInc)on the difference between the average population growth rate of that country (n)to the U.S.average population growth rate (nus )for the years 1980 to 1990.This results in the following regression output:  = 0.518 - 18.831 × 18.831 × (n - nus),R2 = 0.522,SER = 0.197
(a)Interpret the results carefully.Is this relationship economically important?
(b)What would happen to the slope,intercept,and regression R2 if you ran another regression where the above explanatory variable was replaced by n only,i.e. ,the average population growth rate of the country? (The population growth rate of the United States from 1980 to 1990 was 0.009. )Should this have any effect on the t-statistic of the slope?
(c)31 of the 104 countries have a dependent variable of less than 0.10.Does it therefore make sense to interpret the intercept?
= 0.518 - 18.831 × 18.831 × (n - nus),R2 = 0.522,SER = 0.197(a)Interpret the results carefully.Is this relationship economically important?
(b)What would happen to the slope,intercept,and regression R2 if you ran another regression where the above explanatory variable was replaced by n only,i.e. ,the average population growth rate of the country? (The population growth rate of the United States from 1980 to 1990 was 0.009. )Should this have any effect on the t-statistic of the slope?
(c)31 of the 104 countries have a dependent variable of less than 0.10.Does it therefore make sense to interpret the intercept?
سؤال
سؤال
سؤال
Consider the sample regression function
Yi = 0 +
0 +  1Xi +
1Xi +  i.
i.
First,take averages on both sides of the equation.Second,subtract the resulting equation from the above equation to write the sample regression function in deviations from means.(For simplicity,you may want to use small letters to indicate deviations from the mean,i.e. ,zi = Zi - . )Finally,illustrate in a two-dimensional diagram with SSR on the vertical axis and the regression slope on the horizontal axis how you could find the least squares estimator for the slope by varying its values through trial and error.
Yi =
0 + 1Xi + i.First,take averages on both sides of the equation.Second,subtract the resulting equation from the above equation to write the sample regression function in deviations from means.(For simplicity,you may want to use small letters to indicate deviations from the mean,i.e. ,zi = Zi -
. )Finally,illustrate in a two-dimensional diagram with SSR on the vertical axis and the regression slope on the horizontal axis how you could find the least squares estimator for the slope by varying its values through trial and error. سؤال
(Requires Appendix material)Consider the sample regression function 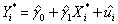 ,
,
where * indicates that the variable has been standardized.What are the units of measurement for the dependent and explanatory variable? Why would you want to transform both variables in this way? Show that the OLS estimator for the intercept equals zero.Next prove that the OLS estimator for the slope in this case is identical to the formula for the least squares estimator where the variables have not been standardized,times the ratio of the sample standard deviation of X and Y,i.e. , .
.
,where * indicates that the variable has been standardized.What are the units of measurement for the dependent and explanatory variable? Why would you want to transform both variables in this way? Show that the OLS estimator for the intercept equals zero.Next prove that the OLS estimator for the slope in this case is identical to the formula for the least squares estimator where the variables have not been standardized,times the ratio of the sample standard deviation of X and Y,i.e. ,
. سؤال
سؤال
(Requires Appendix material)In deriving the OLS estimator,you minimize the sum of squared residuals with respect to the two parameters  0 and
0 and  1.The resulting two equations imply two restrictions that OLS places on the data,namely that
  and
and  .Show that you get the same formula for the regression slope and the intercept if you impose these two conditions on the sample regression function.
0 and 1.The resulting two equations imply two restrictions that OLS places on the data,namely that and .Show that you get the same formula for the regression slope and the intercept if you impose these two conditions on the sample regression function. سؤال
سؤال
سؤال
سؤال
سؤال
(Requires Appendix material)Show that the two alternative formulae for the slope given in your textbook are identical. 
سؤال
Imagine that you had discovered a relationship that would generate a scatterplot very similar to the relationship Yi =  ,and that you would try to fit a linear regression through your data points.What do you expect the slope coefficient to be? What do you think the value of your regression R2 is in this situation? What are the implications from your answers in terms of fitting a linear regression through a non-linear relationship?
,and that you would try to fit a linear regression through your data points.What do you expect the slope coefficient to be? What do you think the value of your regression R2 is in this situation? What are the implications from your answers in terms of fitting a linear regression through a non-linear relationship? سؤال
At the Stock and Watson (http://www.pearsonhighered.com/stock_watson)website go to Student Resources and select the option "Datasets for Replicating Empirical Results." Then select the "California Test Score Data Used in Chapters 4-9" (caschool.xls)and open it in a spreadsheet program such as Excel.
In this exercise you will estimate various statistics of the Linear Regression Model with One Regressor through construction of various sums and ratio within a spreadsheet program.
Throughout this exercise,let Y correspond to Test Scores (testscore)and X to the Student Teacher Ratio (str).To generate answers to all exercises here,you will have to create seven columns and the sums of five of these.They are
(i)Yi, (ii)Xi, (iii)(Yi- ), (iv)(Xi-
  ), (v)(Yi-
  )×(Xi-
  ), (vi)(Xi-
  )2, (vii)(Yi-
  )2
)2
Although neither the sum of (iii)or (iv)will be required for further calculations,you may want to generate these as a check (both have to sum to zero).
a.Use equation (4.7)and the sums of columns (v)and (vi)to generate the slope of the regression.
b.Use equation (4.8)to generate the intercept.
c.Display the regression line (4.9)and interpret the coefficients.
d.Use equation (4.16)and the sum of column (vii)to calculate the regression R2.
e.Use equation (4.19)to calculate the SER.
f.Use the "Regression" function in Excel to verify the results.
In this exercise you will estimate various statistics of the Linear Regression Model with One Regressor through construction of various sums and ratio within a spreadsheet program.
Throughout this exercise,let Y correspond to Test Scores (testscore)and X to the Student Teacher Ratio (str).To generate answers to all exercises here,you will have to create seven columns and the sums of five of these.They are
(i)Yi, (ii)Xi, (iii)(Yi-
), (iv)(Xi- ), (v)(Yi- )×(Xi- ), (vi)(Xi- )2, (vii)(Yi- )2Although neither the sum of (iii)or (iv)will be required for further calculations,you may want to generate these as a check (both have to sum to zero).
a.Use equation (4.7)and the sums of columns (v)and (vi)to generate the slope of the regression.
b.Use equation (4.8)to generate the intercept.
c.Display the regression line (4.9)and interpret the coefficients.
d.Use equation (4.16)and the sum of column (vii)to calculate the regression R2.
e.Use equation (4.19)to calculate the SER.
f.Use the "Regression" function in Excel to verify the results.
سؤال
The help function for a commonly used spreadsheet program gives the following definition for the regression slope it estimates:  Prove that this formula is the same as the one given in the textbook.
Prove that this formula is the same as the one given in the textbook. سؤال
سؤال
سؤال
(Requires Appendix material)A necessary and sufficient condition to derive the OLS estimator is that the following two conditions hold:  = 0 and
  = 0.Show that these conditions imply that
  = 0.
= 0.
= 0 and = 0.Show that these conditions imply that = 0. سؤال
سؤال
You have obtained a sample of 14,925 individuals from the Current Population Survey (CPS)and are interested in the relationship between average hourly earnings and years of education.The regression yields the following result:  = -4.58 + 1.71×educ ,R2 = 0.182,SER = 9.30
where ahe and educ are measured in dollars and years respectively.
a.Interpret the coefficients and the regression R2.
b.Is the effect of education on earnings large?
c.Why should education matter in the determination of earnings? Do the results suggest that there is a guarantee for average hourly earnings to rise for everyone as they receive an additional year of education? Do you think that the relationship between education and average hourly earnings is linear?
d.The average years of education in this sample is 13.5 years.What is mean of average hourly earnings in the sample?
e.Interpret the measure SER.What is its unit of measurement.
= -4.58 + 1.71×educ ,R2 = 0.182,SER = 9.30where ahe and educ are measured in dollars and years respectively.
a.Interpret the coefficients and the regression R2.
b.Is the effect of education on earnings large?
c.Why should education matter in the determination of earnings? Do the results suggest that there is a guarantee for average hourly earnings to rise for everyone as they receive an additional year of education? Do you think that the relationship between education and average hourly earnings is linear?
d.The average years of education in this sample is 13.5 years.What is mean of average hourly earnings in the sample?
e.Interpret the measure SER.What is its unit of measurement.
سؤال
سؤال
In a simple regression with an intercept and a single explanatory variable,the variation in Y  can be decomposed into the explained sums of squares
  and the sum of squared residuals
  (see,for example,equation (4.35)in the textbook).
Consider any regression line,positively or negatively sloped in {X,Y} space.Draw a horizontal line where,hypothetically,you consider the sample mean of Y to be.Next add a single actual observation of Y.
In this graph,indicate where you find the following distances: the
(i)residual
(ii)actual minus the mean of Y
(iii)fitted value minus the mean of Y
can be decomposed into the explained sums of squares and the sum of squared residuals (see,for example,equation (4.35)in the textbook).Consider any regression line,positively or negatively sloped in {X,Y} space.Draw a horizontal line where,hypothetically,you consider the sample mean of Y
to be.Next add a single actual observation of Y.In this graph,indicate where you find the following distances: the
(i)residual
(ii)actual minus the mean of Y
(iii)fitted value minus the mean of Y
سؤال
سؤال
سؤال
سؤال

فتح الحزمة
قم بالتسجيل لفتح البطاقات في هذه المجموعة!
Unlock Deck
Unlock Deck
1/65
العب
ملء الشاشة (f)
Deck 4: Linear Regression With One Regressor
1
The standard error of the regression (SER)is defined as follows
A)
B)SSR
C)1-R2
D)
A)
B)SSR
C)1-R2
D)
A
2
The regression R2 is defined as follows:
A)
B)
C)
D)
A)
B)
C)
D)
A
3
When the estimated slope coefficient in the simple regression model, 1,is zero,then
A)R2 = .
B)0 < R2 < 1.
C)R2 = 0.
D)R2 > (SSR/TSS).
1,is zero,thenA)R2 =
.B)0 < R2 < 1.
C)R2 = 0.
D)R2 > (SSR/TSS).
C
4
(Requires Appendix)The sample average of the OLS residuals is
A)some positive number since OLS uses squares.
B)zero.
C)unobservable since the population regression function is unknown.
D)dependent on whether the explanatory variable is mostly positive or negative.
A)some positive number since OLS uses squares.
B)zero.
C)unobservable since the population regression function is unknown.
D)dependent on whether the explanatory variable is mostly positive or negative.
فتح الحزمة
افتح القفل للوصول البطاقات البالغ عددها 65 في هذه المجموعة.
فتح الحزمة
k this deck
5
In the simple linear regression model Yi = β0 + β1Xi + ui,
A)the intercept is typically small and unimportant.
B)β0 + β1Xi represents the population regression function.
C)the absolute value of the slope is typically between 0 and 1.
D)β0 + β1Xi represents the sample regression function.
A)the intercept is typically small and unimportant.
B)β0 + β1Xi represents the population regression function.
C)the absolute value of the slope is typically between 0 and 1.
D)β0 + β1Xi represents the sample regression function.
فتح الحزمة
افتح القفل للوصول البطاقات البالغ عددها 65 في هذه المجموعة.
فتح الحزمة
k this deck
6
The OLS estimator is derived by
A)connecting the Yi corresponding to the lowest Xi observation with the Yi corresponding to the highest Xi observation.
B)making sure that the standard error of the regression equals the standard error of the slope estimator.
C)minimizing the sum of absolute residuals.
D)minimizing the sum of squared residuals.
فتح الحزمة
افتح القفل للوصول البطاقات البالغ عددها 65 في هذه المجموعة.
فتح الحزمة
k this deck
7
In the simple linear regression model,the regression slope
A)indicates by how many percent Y increases,given a one percent increase in X.
B)when multiplied with the explanatory variable will give you the predicted Y.
C)indicates by how many units Y increases,given a one unit increase in X.
D)represents the elasticity of Y on X.
A)indicates by how many percent Y increases,given a one percent increase in X.
B)when multiplied with the explanatory variable will give you the predicted Y.
C)indicates by how many units Y increases,given a one unit increase in X.
D)represents the elasticity of Y on X.
فتح الحزمة
افتح القفل للوصول البطاقات البالغ عددها 65 في هذه المجموعة.
فتح الحزمة
k this deck
8
(Requires Appendix material)Which of the following statements is correct?
A)TSS = ESS + SSR
B)ESS = SSR + TSS
C)ESS > TSS
D)R2 = 1 - (ESS/TSS)
A)TSS = ESS + SSR
B)ESS = SSR + TSS
C)ESS > TSS
D)R2 = 1 - (ESS/TSS)
فتح الحزمة
افتح القفل للوصول البطاقات البالغ عددها 65 في هذه المجموعة.
فتح الحزمة
k this deck
9
(Requires Appendix)The sample regression line estimated by OLS
A)will always have a slope smaller than the intercept.
B)is exactly the same as the population regression line.
C)cannot have a slope of zero.
D)will always run through the point ( ,
).
A)will always have a slope smaller than the intercept.
B)is exactly the same as the population regression line.
C)cannot have a slope of zero.
D)will always run through the point (
, ). فتح الحزمة
افتح القفل للوصول البطاقات البالغ عددها 65 في هذه المجموعة.
فتح الحزمة
k this deck
10
The reason why estimators have a sampling distribution is that
A)economics is not a precise science.
B)individuals respond differently to incentives.
C)in real life you typically get to sample many times.
D)the values of the explanatory variable and the error term differ across samples.
A)economics is not a precise science.
B)individuals respond differently to incentives.
C)in real life you typically get to sample many times.
D)the values of the explanatory variable and the error term differ across samples.
فتح الحزمة
افتح القفل للوصول البطاقات البالغ عددها 65 في هذه المجموعة.
فتح الحزمة
k this deck
11
Interpreting the intercept in a sample regression function is
A)not reasonable because you never observe values of the explanatory variables around the origin.
B)reasonable because under certain conditions the estimator is BLUE.
C)reasonable if your sample contains values of Xi around the origin.
D)not reasonable because economists are interested in the effect of a change in X on the change in Y.
فتح الحزمة
افتح القفل للوصول البطاقات البالغ عددها 65 في هذه المجموعة.
فتح الحزمة
k this deck
12
Binary variables
A)are generally used to control for outliers in your sample.
B)can take on more than two values.
C)exclude certain individuals from your sample.
D)can take on only two values.
A)are generally used to control for outliers in your sample.
B)can take on more than two values.
C)exclude certain individuals from your sample.
D)can take on only two values.
فتح الحزمة
افتح القفل للوصول البطاقات البالغ عددها 65 في هذه المجموعة.
فتح الحزمة
k this deck
13
The slope estimator,β1,has a smaller standard error,other things equal,if
A)there is more variation in the explanatory variable,X.
B)there is a large variance of the error term,u.
C)the sample size is smaller.
D)the intercept,β0,is small.
A)there is more variation in the explanatory variable,X.
B)there is a large variance of the error term,u.
C)the sample size is smaller.
D)the intercept,β0,is small.
فتح الحزمة
افتح القفل للوصول البطاقات البالغ عددها 65 في هذه المجموعة.
فتح الحزمة
k this deck
14
The OLS residuals
A)can be calculated using the errors from the regression function.
B)can be calculated by subtracting the fitted values from the actual values.
C)are unknown since we do not know the population regression function.
D)should not be used in practice since they indicate that your regression does not run through all your observations.
فتح الحزمة
افتح القفل للوصول البطاقات البالغ عددها 65 في هذه المجموعة.
فتح الحزمة
k this deck
15
The normal approximation to the sampling distribution of 1 is powerful because
A)many explanatory variables in real life are normally distributed.
B)it allows econometricians to develop methods for statistical inference.
C)many other distributions are not symmetric.
D)is implies that OLS is the BLUE estimator for β1.
1 is powerful becauseA)many explanatory variables in real life are normally distributed.
B)it allows econometricians to develop methods for statistical inference.
C)many other distributions are not symmetric.
D)is implies that OLS is the BLUE estimator for β1.
فتح الحزمة
افتح القفل للوصول البطاقات البالغ عددها 65 في هذه المجموعة.
فتح الحزمة
k this deck
16
The regression R2 is a measure of
A)whether or not X causes Y.
B)the goodness of fit of your regression line.
C)whether or not ESS > TSS.
D)the square of the determinant of R.
A)whether or not X causes Y.
B)the goodness of fit of your regression line.
C)whether or not ESS > TSS.
D)the square of the determinant of R.
فتح الحزمة
افتح القفل للوصول البطاقات البالغ عددها 65 في هذه المجموعة.
فتح الحزمة
k this deck
17
If the three least squares assumptions hold,then the large sample normal distribution of 1 is
A) .
B) .
C) .
D) .
1 isA)
.B)
.C)
.D)
. فتح الحزمة
افتح القفل للوصول البطاقات البالغ عددها 65 في هذه المجموعة.
فتح الحزمة
k this deck
18
The following are all least squares assumptions with the exception of:
A)The conditional distribution of ui given Xi has a mean of zero.
B)The explanatory variable in regression model is normally distributed.
C)(Xi,Yi),i = 1,... ,n are independently and identically distributed.
D)Large outliers are unlikely.
A)The conditional distribution of ui given Xi has a mean of zero.
B)The explanatory variable in regression model is normally distributed.
C)(Xi,Yi),i = 1,... ,n are independently and identically distributed.
D)Large outliers are unlikely.
فتح الحزمة
افتح القفل للوصول البطاقات البالغ عددها 65 في هذه المجموعة.
فتح الحزمة
k this deck
19
The OLS residuals, i,are defined as follows:
A) i -
0 -
1Xi
B)Yi - β0 - β1Xi
C)Yi - i
D)(Yi - )2
i,are defined as follows:A)
i - 0 - 1XiB)Yi - β0 - β1Xi
C)Yi -
iD)(Yi -
)2 فتح الحزمة
افتح القفل للوصول البطاقات البالغ عددها 65 في هذه المجموعة.
فتح الحزمة
k this deck
20
The variance of Yi is given by
A) +
var(Xi)+ var(ui).
B)the variance of ui.
C) var(Xi)+ var(ui).
D)the variance of the residuals.
A)
+ var(Xi)+ var(ui).B)the variance of ui.
C)
var(Xi)+ var(ui).D)the variance of the residuals.
فتح الحزمة
افتح القفل للوصول البطاقات البالغ عددها 65 في هذه المجموعة.
فتح الحزمة
k this deck
21
In 2001,the Arizona Diamondbacks defeated the New York Yankees in the Baseball World Series in 7 games.Some players,such as Bautista and Finley for the Diamondbacks,had a substantially higher batting average during the World Series than during the regular season.Others,such as Brosius and Jeter for the Yankees,did substantially poorer.You set out to investigate whether or not the regular season batting average is a good indicator for the World Series batting average.The results for 11 players who had the most at bats for the two teams are: = -0.347 + 2.290 AZSeasavg ,R2=0.11,SER = 0.145, = 0.134 + 0.136 NYSeasavg ,R2=0.001,SER = 0.092,
where Wsavg and Seasavg indicate the batting average during the World Series and the regular season respectively.
(a)Focusing on the coefficients first,what is your interpretation?
(b)What can you say about the explanatory power of your equation? What do you conclude from this?
= -0.347 + 2.290 AZSeasavg ,R2=0.11,SER = 0.145, = 0.134 + 0.136 NYSeasavg ,R2=0.001,SER = 0.092,where Wsavg and Seasavg indicate the batting average during the World Series and the regular season respectively.
(a)Focusing on the coefficients first,what is your interpretation?
(b)What can you say about the explanatory power of your equation? What do you conclude from this?
فتح الحزمة
افتح القفل للوصول البطاقات البالغ عددها 65 في هذه المجموعة.
فتح الحزمة
k this deck
22
The neoclassical growth model predicts that for identical savings rates and population growth rates,countries should converge to the per capita income level.This is referred to as the convergence hypothesis.One way to test for the presence of convergence is to compare the growth rates over time to the initial starting level.
(a)If you regressed the average growth rate over a time period (1960-1990)on the initial level of per capita income,what would the sign of the slope have to be to indicate this type of convergence? Explain.Would this result confirm or reject the prediction of the neoclassical growth model?
(b)The results of the regression for 104 countries were as follows: = 0.019 - 0.0006 × RelProd60 ,R2 = 0.00007,SER = 0.016,
where g6090 is the average annual growth rate of GDP per worker for the 1960-1990 sample period,and RelProd60 is GDP per worker relative to the United States in 1960.
Interpret the results.Is there any evidence of unconditional convergence between the countries of the world? Is this result surprising? What other concept could you think about to test for convergence between countries?
(c)You decide to restrict yourself to the 24 OECD countries in the sample.This changes your regression output as follows: = 0.048 - 0.0404 RelProd60 ,R2 = 0.82 ,SER = 0.0046
How does this result affect your conclusions from above?
(a)If you regressed the average growth rate over a time period (1960-1990)on the initial level of per capita income,what would the sign of the slope have to be to indicate this type of convergence? Explain.Would this result confirm or reject the prediction of the neoclassical growth model?
(b)The results of the regression for 104 countries were as follows:
= 0.019 - 0.0006 × RelProd60 ,R2 = 0.00007,SER = 0.016,where g6090 is the average annual growth rate of GDP per worker for the 1960-1990 sample period,and RelProd60 is GDP per worker relative to the United States in 1960.
Interpret the results.Is there any evidence of unconditional convergence between the countries of the world? Is this result surprising? What other concept could you think about to test for convergence between countries?
(c)You decide to restrict yourself to the 24 OECD countries in the sample.This changes your regression output as follows:
= 0.048 - 0.0404 RelProd60 ,R2 = 0.82 ,SER = 0.0046How does this result affect your conclusions from above?
فتح الحزمة
افتح القفل للوصول البطاقات البالغ عددها 65 في هذه المجموعة.
فتح الحزمة
k this deck
23
For the simple regression model of Chapter 4,you have been given the following data: = 274,745.75; = 8,248.979; = 5,392,705; = 163,513.03; = 179,878,841.13
(a)Calculate the regression slope and the intercept.
(b)Calculate the regression R2
= 274,745.75; = 8,248.979; = 5,392,705; = 163,513.03; = 179,878,841.13(a)Calculate the regression slope and the intercept.
(b)Calculate the regression R2
فتح الحزمة
افتح القفل للوصول البطاقات البالغ عددها 65 في هذه المجموعة.
فتح الحزمة
k this deck
24
Multiplying the dependent variable by 100 and the explanatory variable by 100,000 leaves the
A)OLS estimate of the slope the same.
B)OLS estimate of the intercept the same.
C)regression R2 the same.
D)variance of the OLS estimators the same.
A)OLS estimate of the slope the same.
B)OLS estimate of the intercept the same.
C)regression R2 the same.
D)variance of the OLS estimators the same.
فتح الحزمة
افتح القفل للوصول البطاقات البالغ عددها 65 في هذه المجموعة.
فتح الحزمة
k this deck
25
To obtain the slope estimator using the least squares principle,you divide the
A)sample variance of X by the sample variance of Y.
B)sample covariance of X and Y by the sample variance of Y.
C)sample covariance of X and Y by the sample variance of X.
D)sample variance of X by the sample covariance of X and Y.
A)sample variance of X by the sample variance of Y.
B)sample covariance of X and Y by the sample variance of Y.
C)sample covariance of X and Y by the sample variance of X.
D)sample variance of X by the sample covariance of X and Y.
فتح الحزمة
افتح القفل للوصول البطاقات البالغ عددها 65 في هذه المجموعة.
فتح الحزمة
k this deck
26
Changing the units of measurement,e.g.measuring testscores in 100s,will do all of the following EXCEPT for changing the
A)residuals
B)numerical value of the slope estimate
C)interpretation of the effect that a change in X has on the change in Y
D)numerical value of the intercept
A)residuals
B)numerical value of the slope estimate
C)interpretation of the effect that a change in X has on the change in Y
D)numerical value of the intercept
فتح الحزمة
افتح القفل للوصول البطاقات البالغ عددها 65 في هذه المجموعة.
فتح الحزمة
k this deck
27
To decide whether the slope coefficient indicates a "large" effect of X on Y,you look at the
A)size of the slope coefficient
B)regression R2
C)economic importance implied by the slope coefficient
D)value of the intercept
A)size of the slope coefficient
B)regression R2
C)economic importance implied by the slope coefficient
D)value of the intercept
فتح الحزمة
افتح القفل للوصول البطاقات البالغ عددها 65 في هذه المجموعة.
فتح الحزمة
k this deck
28
To decide whether or not the slope coefficient is large or small,
A)you should analyze the economic importance of a given increase in X.
B)the slope coefficient must be larger than one.
C)the slope coefficient must be statistically significant.
D)you should change the scale of the X variable if the coefficient appears to be too small.
A)you should analyze the economic importance of a given increase in X.
B)the slope coefficient must be larger than one.
C)the slope coefficient must be statistically significant.
D)you should change the scale of the X variable if the coefficient appears to be too small.
فتح الحزمة
افتح القفل للوصول البطاقات البالغ عددها 65 في هذه المجموعة.
فتح الحزمة
k this deck
29
The news-magazine The Economist regularly publishes data on the so called Big Mac index and exchange rates between countries.The data for 30 countries from the April 29,2000 issue is listed below:
Price of Actual Exchange Rate
Country Currency Big Mac per U.S.dollar
Indonesia Rupiah 14,500 7,945
Italy Lira 4,500 2,088
South Korea Won 3,000 1,108
Chile Peso 1,260 514
Spain Peseta 375 179
Hungary Forint 339 279
Japan Yen 294 106
Taiwan Dollar 70 30.6
Thailand Baht 55 38.0
Czech Rep.Crown 54.37 39.1
Russia Ruble 39.50 28.5
Denmark Crown 24.75 8.04
Sweden Crown 24.0 8.84
Mexico Peso 20.9 9.41
France Franc 18.5 .07
Israel Shekel 14.5 4.05
China Yuan 9.90 8.28
South Africa Rand 9.0 6.72
Switzerland Franc 5.90 1.70
Poland Zloty 5.50 4.30
Germany Mark 4.99 2.11
Malaysia Dollar 4.52 3.80
New Zealand Dollar 3.40 2.01
Singapore Dollar 3.20 1.70
Brazil Real 2.95 1.79
Canada Dollar 2.85 1.47
Australia Dollar 2.59 1.68
Argentina Peso 2.50 1.00
Britain Pound 1.90 0.63
United States Dollar 2.51
The concept of purchasing power parity or PPP ("the idea that similar foreign and domestic goods … should have the same price in terms of the same currency," Abel,A.and B.Bernanke,Macroeconomics,4th edition,Boston: Addison Wesley,476)suggests that the ratio of the Big Mac priced in the local currency to the U.S.dollar price should equal the exchange rate between the two countries.
(a)Enter the data into your regression analysis program (EViews,Stata,Excel,SAS,etc. ).Calculate the predicted exchange rate per U.S.dollar by dividing the price of a Big Mac in local currency by the U.S.price of a Big Mac ($2.51).
(b)Run a regression of the actual exchange rate on the predicted exchange rate.If purchasing power parity held,what would you expect the slope and the intercept of the regression to be? Is the value of the slope and the intercept "far" from the values you would expect to hold under PPP?
(c)Plot the actual exchange rate against the predicted exchange rate.Include the 45 degree line in your graph.Which observations might cause the slope and the intercept to differ from zero and one?
فتح الحزمة
افتح القفل للوصول البطاقات البالغ عددها 65 في هذه المجموعة.
فتح الحزمة
k this deck
30
The OLS residuals, i,are sample counterparts of the population
A)regression function slope
B)errors
C)regression function's predicted values
D)regression function intercept
i,are sample counterparts of the populationA)regression function slope
B)errors
C)regression function's predicted values
D)regression function intercept
فتح الحزمة
افتح القفل للوصول البطاقات البالغ عددها 65 في هذه المجموعة.
فتح الحزمة
k this deck
31
You have obtained a sub-sample of 1744 individuals from the Current Population Survey (CPS)and are interested in the relationship between weekly earnings and age.The regression,using heteroskedasticity-robust standard errors,yielded the following result: = 239.16 + 5.20 × Age,R2 = 0.05,SER = 287.21. ,
where Earn and Age are measured in dollars and years respectively.
(a)Interpret the results.
(b)Is the effect of age on earnings large?
(c)Why should age matter in the determination of earnings? Do the results suggest that there is a guarantee for earnings to rise for everyone as they become older? Do you think that the relationship between age and earnings is linear?
(d)The average age in this sample is 37.5 years.What is annual income in the sample?
(e)Interpret the measures of fit.
= 239.16 + 5.20 × Age,R2 = 0.05,SER = 287.21. ,where Earn and Age are measured in dollars and years respectively.
(a)Interpret the results.
(b)Is the effect of age on earnings large?
(c)Why should age matter in the determination of earnings? Do the results suggest that there is a guarantee for earnings to rise for everyone as they become older? Do you think that the relationship between age and earnings is linear?
(d)The average age in this sample is 37.5 years.What is annual income in the sample?
(e)Interpret the measures of fit.
فتح الحزمة
افتح القفل للوصول البطاقات البالغ عددها 65 في هذه المجموعة.
فتح الحزمة
k this deck
32
Your textbook presented you with the following regression output: = 698.9 - 2.28 × STR
n = 420,R2 = 0.051,SER = 18.6
(a)How would the slope coefficient change,if you decided one day to measure testscores in 100s,i.e. ,a test score of 650 became 6.5? Would this have an effect on your interpretation?
(b)Do you think the regression R2 will change? Why or why not?
(c)Although Chapter 4 in your textbook did not deal with hypothesis testing,it presented you with the large sample distribution for the slope and the intercept estimator.Given the change in the units of measurement in (a),do you think that the variance of the slope estimator will change numerically? Why or why not?
= 698.9 - 2.28 × STRn = 420,R2 = 0.051,SER = 18.6
(a)How would the slope coefficient change,if you decided one day to measure testscores in 100s,i.e. ,a test score of 650 became 6.5? Would this have an effect on your interpretation?
(b)Do you think the regression R2 will change? Why or why not?
(c)Although Chapter 4 in your textbook did not deal with hypothesis testing,it presented you with the large sample distribution for the slope and the intercept estimator.Given the change in the units of measurement in (a),do you think that the variance of the slope estimator will change numerically? Why or why not?
فتح الحزمة
افتح القفل للوصول البطاقات البالغ عددها 65 في هذه المجموعة.
فتح الحزمة
k this deck
33
In the linear regression model,Yi = β0 + β1Xi + ui,β0 + β1Xi is referred to as
A)the population regression function.
B)the sample regression function.
C)exogenous variation.
D)the right-hand variable or regressor.
A)the population regression function.
B)the sample regression function.
C)exogenous variation.
D)the right-hand variable or regressor.
فتح الحزمة
افتح القفل للوصول البطاقات البالغ عددها 65 في هذه المجموعة.
فتح الحزمة
k this deck
34
In which of the following relationships does the intercept have a real-world interpretation?
A)the relationship between the change in the unemployment rate and the growth rate of real GDP ("Okun's Law")
B)the demand for coffee and its price
C)test scores and class-size
D)weight and height of individuals
A)the relationship between the change in the unemployment rate and the growth rate of real GDP ("Okun's Law")
B)the demand for coffee and its price
C)test scores and class-size
D)weight and height of individuals
فتح الحزمة
افتح القفل للوصول البطاقات البالغ عددها 65 في هذه المجموعة.
فتح الحزمة
k this deck
35
Assume that you have collected a sample of observations from over 100 households and their consumption and income patterns.Using these observations,you estimate the following regression Ci = β0+β1Yi+ ui where C is consumption and Y is disposable income.The estimate of β1 will tell you
A)
B)The amount you need to consume to survive
C)
D)
A)
B)The amount you need to consume to survive
C)
D)
فتح الحزمة
افتح القفل للوصول البطاقات البالغ عددها 65 في هذه المجموعة.
فتح الحزمة
k this deck
36
E(ui Xi)= 0 says that
A)dividing the error by the explanatory variable results in a zero (on average).
B)the sample regression function residuals are unrelated to the explanatory variable.
C)the sample mean of the Xs is much larger than the sample mean of the errors.
D)the conditional distribution of the error given the explanatory variable has a zero mean.
Xi)= 0 says thatA)dividing the error by the explanatory variable results in a zero (on average).
B)the sample regression function residuals are unrelated to the explanatory variable.
C)the sample mean of the Xs is much larger than the sample mean of the errors.
D)the conditional distribution of the error given the explanatory variable has a zero mean.
فتح الحزمة
افتح القفل للوصول البطاقات البالغ عددها 65 في هذه المجموعة.
فتح الحزمة
k this deck
37
(Requires Appendix material)At a recent county fair,you observed that at one stand people's weight was forecasted,and were surprised by the accuracy (within a range).Thinking about how the person could have predicted your weight fairly accurately (despite the fact that she did not know about your "heavy bones"),you think about how this could have been accomplished.You remember that medical charts for children contain 5%,25%,50%,75% and 95% lines for a weight/height relationship and decide to conduct an experiment with 110 of your peers.You collect the data and calculate the following sums: where the height is measured in inches and weight in pounds.(Small letters refer to deviations from means as in zi = Zi - )
(a)Calculate the slope and intercept of the regression and interpret these.
(b)Find the regression R2 and explain its meaning.What other factors can you think of that might have an influence on the weight of an individual?
where the height is measured in inches and weight in pounds.(Small letters refer to deviations from means as in zi = Zi - )(a)Calculate the slope and intercept of the regression and interpret these.
(b)Find the regression R2 and explain its meaning.What other factors can you think of that might have an influence on the weight of an individual?
فتح الحزمة
افتح القفل للوصول البطاقات البالغ عددها 65 في هذه المجموعة.
فتح الحزمة
k this deck
38
The baseball team nearest to your home town is,once again,not doing well.Given that your knowledge of what it takes to win in baseball is vastly superior to that of management,you want to find out what it takes to win in Major League Baseball (MLB).You therefore collect the winning percentage of all 30 baseball teams in MLB for 1999 and regress the winning percentage on what you consider the primary determinant for wins,which is quality pitching (team earned run average).You find the following information on team performance:
Summary of the Distribution of Winning Percentage and
Team Earned Run Average for MLB in 1999
(a)What is your expected sign for the regression slope? Will it make sense to interpret the intercept? If not,should you omit it from your regression and force the regression line through the origin?
(b)OLS estimation of the relationship between the winning percentage and the team ERA yield the following: = 0.9 - 0.10 × teamera ,R2=0.49,SER = 0.06,
where winpct is measured as wins divided by games played,so for example a team that won half of its games would have Winpct = 0.50.Interpret your regression results.
(c)It is typically sufficient to win 90 games to be in the playoffs and/or to win a division.Winning over 100 games a season is exceptional: the Atlanta Braves had the most wins in 1999 with 103.Teams play a total of 162 games a year.Given this information,do you consider the slope coefficient to be large or small?
(d)What would be the effect on the slope,the intercept,and the regression R2 if you measured Winpct in percentage points,i.e. ,as (Wins/Games)× 100?
(e)Are you impressed with the size of the regression R2? Given that there is 51% of unexplained variation in the winning percentage,what might some of these factors be?
Summary of the Distribution of Winning Percentage and
Team Earned Run Average for MLB in 1999
(a)What is your expected sign for the regression slope? Will it make sense to interpret the intercept? If not,should you omit it from your regression and force the regression line through the origin?(b)OLS estimation of the relationship between the winning percentage and the team ERA yield the following:
= 0.9 - 0.10 × teamera ,R2=0.49,SER = 0.06,where winpct is measured as wins divided by games played,so for example a team that won half of its games would have Winpct = 0.50.Interpret your regression results.
(c)It is typically sufficient to win 90 games to be in the playoffs and/or to win a division.Winning over 100 games a season is exceptional: the Atlanta Braves had the most wins in 1999 with 103.Teams play a total of 162 games a year.Given this information,do you consider the slope coefficient to be large or small?
(d)What would be the effect on the slope,the intercept,and the regression R2 if you measured Winpct in percentage points,i.e. ,as (Wins/Games)× 100?
(e)Are you impressed with the size of the regression R2? Given that there is 51% of unexplained variation in the winning percentage,what might some of these factors be?
فتح الحزمة
افتح القفل للوصول البطاقات البالغ عددها 65 في هذه المجموعة.
فتح الحزمة
k this deck
39
Sir Francis Galton,a cousin of James Darwin,examined the relationship between the height of children and their parents towards the end of the 19th century.It is from this study that the name "regression" originated.You decide to update his findings by collecting data from 110 college students,and estimate the following relationship: = 19.6 + 0.73 × Midparh,R2 = 0.45,SER = 2.0
where Studenth is the height of students in inches,and Midparh is the average of the parental heights.(Following Galton's methodology,both variables were adjusted so that the average female height was equal to the average male height. )
(a)Interpret the estimated coefficients.
(b)What is the meaning of the regression R2?
(c)What is the prediction for the height of a child whose parents have an average height of 70.06 inches?
(d)What is the interpretation of the SER here?
(e)Given the positive intercept and the fact that the slope lies between zero and one,what can you say about the height of students who have quite tall parents? Those who have quite short parents?
(f)Galton was concerned about the height of the English aristocracy and referred to the above result as "regression towards mediocrity." Can you figure out what his concern was? Why do you think that we refer to this result today as "Galton's Fallacy"?
= 19.6 + 0.73 × Midparh,R2 = 0.45,SER = 2.0where Studenth is the height of students in inches,and Midparh is the average of the parental heights.(Following Galton's methodology,both variables were adjusted so that the average female height was equal to the average male height. )
(a)Interpret the estimated coefficients.
(b)What is the meaning of the regression R2?
(c)What is the prediction for the height of a child whose parents have an average height of 70.06 inches?
(d)What is the interpretation of the SER here?
(e)Given the positive intercept and the fact that the slope lies between zero and one,what can you say about the height of students who have quite tall parents? Those who have quite short parents?
(f)Galton was concerned about the height of the English aristocracy and referred to the above result as "regression towards mediocrity." Can you figure out what his concern was? Why do you think that we refer to this result today as "Galton's Fallacy"?
فتح الحزمة
افتح القفل للوصول البطاقات البالغ عددها 65 في هذه المجموعة.
فتح الحزمة
k this deck
40
You have learned in one of your economics courses that one of the determinants of per capita income (the "Wealth of Nations")is the population growth rate.Furthermore you also found out that the Penn World Tables contain income and population data for 104 countries of the world.To test this theory,you regress the GDP per worker (relative to the United States)in 1990 (RelPersInc)on the difference between the average population growth rate of that country (n)to the U.S.average population growth rate (nus )for the years 1980 to 1990.This results in the following regression output: = 0.518 - 18.831 × 18.831 × (n - nus),R2 = 0.522,SER = 0.197
(a)Interpret the results carefully.Is this relationship economically important?
(b)What would happen to the slope,intercept,and regression R2 if you ran another regression where the above explanatory variable was replaced by n only,i.e. ,the average population growth rate of the country? (The population growth rate of the United States from 1980 to 1990 was 0.009. )Should this have any effect on the t-statistic of the slope?
(c)31 of the 104 countries have a dependent variable of less than 0.10.Does it therefore make sense to interpret the intercept?
= 0.518 - 18.831 × 18.831 × (n - nus),R2 = 0.522,SER = 0.197(a)Interpret the results carefully.Is this relationship economically important?
(b)What would happen to the slope,intercept,and regression R2 if you ran another regression where the above explanatory variable was replaced by n only,i.e. ,the average population growth rate of the country? (The population growth rate of the United States from 1980 to 1990 was 0.009. )Should this have any effect on the t-statistic of the slope?
(c)31 of the 104 countries have a dependent variable of less than 0.10.Does it therefore make sense to interpret the intercept?
فتح الحزمة
افتح القفل للوصول البطاقات البالغ عددها 65 في هذه المجموعة.
فتح الحزمة
k this deck
41
(Requires Calculus)Consider the following model:
Yi = β1Xi + ui.
Derive the OLS estimator for β1.
Yi = β1Xi + ui.
Derive the OLS estimator for β1.
فتح الحزمة
افتح القفل للوصول البطاقات البالغ عددها 65 في هذه المجموعة.
فتح الحزمة
k this deck
42
The OLS slope estimator is not defined if there is no variation in the data for the explanatory variable.You are interested in estimating a regression relating earnings to years of schooling.Imagine that you had collected data on earnings for different individuals,but that all these individuals had completed a college education (16 years of education).Sketch what the data would look like and explain intuitively why the OLS coefficient does not exist in this situation.
فتح الحزمة
افتح القفل للوصول البطاقات البالغ عددها 65 في هذه المجموعة.
فتح الحزمة
k this deck
43
Consider the sample regression function
Yi = 0 + 1Xi + i.
First,take averages on both sides of the equation.Second,subtract the resulting equation from the above equation to write the sample regression function in deviations from means.(For simplicity,you may want to use small letters to indicate deviations from the mean,i.e. ,zi = Zi - . )Finally,illustrate in a two-dimensional diagram with SSR on the vertical axis and the regression slope on the horizontal axis how you could find the least squares estimator for the slope by varying its values through trial and error.
Yi =
0 + 1Xi + i.First,take averages on both sides of the equation.Second,subtract the resulting equation from the above equation to write the sample regression function in deviations from means.(For simplicity,you may want to use small letters to indicate deviations from the mean,i.e. ,zi = Zi -
. )Finally,illustrate in a two-dimensional diagram with SSR on the vertical axis and the regression slope on the horizontal axis how you could find the least squares estimator for the slope by varying its values through trial and error. فتح الحزمة
افتح القفل للوصول البطاقات البالغ عددها 65 في هذه المجموعة.
فتح الحزمة
k this deck
44
(Requires Appendix material)Consider the sample regression function ,
where * indicates that the variable has been standardized.What are the units of measurement for the dependent and explanatory variable? Why would you want to transform both variables in this way? Show that the OLS estimator for the intercept equals zero.Next prove that the OLS estimator for the slope in this case is identical to the formula for the least squares estimator where the variables have not been standardized,times the ratio of the sample standard deviation of X and Y,i.e. , .
,where * indicates that the variable has been standardized.What are the units of measurement for the dependent and explanatory variable? Why would you want to transform both variables in this way? Show that the OLS estimator for the intercept equals zero.Next prove that the OLS estimator for the slope in this case is identical to the formula for the least squares estimator where the variables have not been standardized,times the ratio of the sample standard deviation of X and Y,i.e. ,
. فتح الحزمة
افتح القفل للوصول البطاقات البالغ عددها 65 في هذه المجموعة.
فتح الحزمة
k this deck
45
A peer of yours,who is a major in another social science,says he is not interested in the regression slope and/or intercept.Instead he only cares about correlations.For example,in the testscore/student-teacher ratio regression,he claims to get all the information he needs from the negative correlation coefficient corr(X,Y)=-0.226.What response might you have for your peer?
فتح الحزمة
افتح القفل للوصول البطاقات البالغ عددها 65 في هذه المجموعة.
فتح الحزمة
k this deck
46
(Requires Appendix material)In deriving the OLS estimator,you minimize the sum of squared residuals with respect to the two parameters 0 and 1.The resulting two equations imply two restrictions that OLS places on the data,namely that and .Show that you get the same formula for the regression slope and the intercept if you impose these two conditions on the sample regression function.
0 and 1.The resulting two equations imply two restrictions that OLS places on the data,namely that and .Show that you get the same formula for the regression slope and the intercept if you impose these two conditions on the sample regression function. فتح الحزمة
افتح القفل للوصول البطاقات البالغ عددها 65 في هذه المجموعة.
فتح الحزمة
k this deck
47
Given the amount of money and effort that you have spent on your education,you wonder if it was (is)all worth it.You therefore collect data from the Current Population Survey (CPS)and estimate a linear relationship between earnings and the years of education of individuals.What would be the effect on your regression slope and intercept if you measured earnings in thousands of dollars rather than in dollars? Would the regression R2 be affected? Should statistical inference be dependent on the scale of variables? Discuss.
فتح الحزمة
افتح القفل للوصول البطاقات البالغ عددها 65 في هذه المجموعة.
فتح الحزمة
k this deck
48
In order to calculate the regression R2 you need the TSS and either the SSR or the ESS.The TSS is fairly straightforward to calculate,being just the variation of Y.However,if you had to calculate the SSR or ESS by hand (or in a spreadsheet),you would need all fitted values from the regression function and their deviations from the sample mean,or the residuals.Can you think of a quicker way to calculate the ESS simply using terms you have already used to calculate the slope coefficient?
فتح الحزمة
افتح القفل للوصول البطاقات البالغ عددها 65 في هذه المجموعة.
فتح الحزمة
k this deck
49
Indicate in a scatterplot what the data for your dependent variable and your explanatory variable would look like in a regression with an R2 equal to zero.How would this change if the regression R2 was equal to one?
فتح الحزمة
افتح القفل للوصول البطاقات البالغ عددها 65 في هذه المجموعة.
فتح الحزمة
k this deck
50
Prove that the regression R2 is identical to the square of the correlation coefficient between two variables Y and X.Regression functions are written in a form that suggests causation running from X to Y.Given your proof,does a high regression R2 present supportive evidence of a causal relationship? Can you think of some regression examples where the direction of causality is not clear? Is without a doubt?
فتح الحزمة
افتح القفل للوصول البطاقات البالغ عددها 65 في هذه المجموعة.
فتح الحزمة
k this deck
51
(Requires Appendix material)Show that the two alternative formulae for the slope given in your textbook are identical.
فتح الحزمة
افتح القفل للوصول البطاقات البالغ عددها 65 في هذه المجموعة.
فتح الحزمة
k this deck
52
Imagine that you had discovered a relationship that would generate a scatterplot very similar to the relationship Yi = ,and that you would try to fit a linear regression through your data points.What do you expect the slope coefficient to be? What do you think the value of your regression R2 is in this situation? What are the implications from your answers in terms of fitting a linear regression through a non-linear relationship?
,and that you would try to fit a linear regression through your data points.What do you expect the slope coefficient to be? What do you think the value of your regression R2 is in this situation? What are the implications from your answers in terms of fitting a linear regression through a non-linear relationship? فتح الحزمة
افتح القفل للوصول البطاقات البالغ عددها 65 في هذه المجموعة.
فتح الحزمة
k this deck
53
At the Stock and Watson (http://www.pearsonhighered.com/stock_watson)website go to Student Resources and select the option "Datasets for Replicating Empirical Results." Then select the "California Test Score Data Used in Chapters 4-9" (caschool.xls)and open it in a spreadsheet program such as Excel.
In this exercise you will estimate various statistics of the Linear Regression Model with One Regressor through construction of various sums and ratio within a spreadsheet program.
Throughout this exercise,let Y correspond to Test Scores (testscore)and X to the Student Teacher Ratio (str).To generate answers to all exercises here,you will have to create seven columns and the sums of five of these.They are
(i)Yi, (ii)Xi, (iii)(Yi- ), (iv)(Xi- ), (v)(Yi- )×(Xi- ), (vi)(Xi- )2, (vii)(Yi- )2
Although neither the sum of (iii)or (iv)will be required for further calculations,you may want to generate these as a check (both have to sum to zero).
a.Use equation (4.7)and the sums of columns (v)and (vi)to generate the slope of the regression.
b.Use equation (4.8)to generate the intercept.
c.Display the regression line (4.9)and interpret the coefficients.
d.Use equation (4.16)and the sum of column (vii)to calculate the regression R2.
e.Use equation (4.19)to calculate the SER.
f.Use the "Regression" function in Excel to verify the results.
In this exercise you will estimate various statistics of the Linear Regression Model with One Regressor through construction of various sums and ratio within a spreadsheet program.
Throughout this exercise,let Y correspond to Test Scores (testscore)and X to the Student Teacher Ratio (str).To generate answers to all exercises here,you will have to create seven columns and the sums of five of these.They are
(i)Yi, (ii)Xi, (iii)(Yi-
), (iv)(Xi- ), (v)(Yi- )×(Xi- ), (vi)(Xi- )2, (vii)(Yi- )2Although neither the sum of (iii)or (iv)will be required for further calculations,you may want to generate these as a check (both have to sum to zero).
a.Use equation (4.7)and the sums of columns (v)and (vi)to generate the slope of the regression.
b.Use equation (4.8)to generate the intercept.
c.Display the regression line (4.9)and interpret the coefficients.
d.Use equation (4.16)and the sum of column (vii)to calculate the regression R2.
e.Use equation (4.19)to calculate the SER.
f.Use the "Regression" function in Excel to verify the results.
فتح الحزمة
افتح القفل للوصول البطاقات البالغ عددها 65 في هذه المجموعة.
فتح الحزمة
k this deck
54
The help function for a commonly used spreadsheet program gives the following definition for the regression slope it estimates: Prove that this formula is the same as the one given in the textbook.
Prove that this formula is the same as the one given in the textbook. فتح الحزمة
افتح القفل للوصول البطاقات البالغ عددها 65 في هذه المجموعة.
فتح الحزمة
k this deck
55
(Requires Calculus)Consider the following model:
Yi = β0 + ui.
Derive the OLS estimator for β0.
Yi = β0 + ui.
Derive the OLS estimator for β0.
فتح الحزمة
افتح القفل للوصول البطاقات البالغ عددها 65 في هذه المجموعة.
فتح الحزمة
k this deck
56
Show first that the regression R2 is the square of the sample correlation coefficient.Next,show that the slope of a simple regression of Y on X is only identical to the inverse of the regression slope of X on Y if the regression R2 equals one.
فتح الحزمة
افتح القفل للوصول البطاقات البالغ عددها 65 في هذه المجموعة.
فتح الحزمة
k this deck
57
(Requires Appendix material)A necessary and sufficient condition to derive the OLS estimator is that the following two conditions hold: = 0 and = 0.Show that these conditions imply that = 0.
= 0 and = 0.Show that these conditions imply that = 0. فتح الحزمة
افتح القفل للوصول البطاقات البالغ عددها 65 في هذه المجموعة.
فتح الحزمة
k this deck
58
In order to calculate the slope,the intercept,and the regression R2 for a simple sample regression function,list the five sums of data that you need.
فتح الحزمة
افتح القفل للوصول البطاقات البالغ عددها 65 في هذه المجموعة.
فتح الحزمة
k this deck
59
You have obtained a sample of 14,925 individuals from the Current Population Survey (CPS)and are interested in the relationship between average hourly earnings and years of education.The regression yields the following result: = -4.58 + 1.71×educ ,R2 = 0.182,SER = 9.30
where ahe and educ are measured in dollars and years respectively.
a.Interpret the coefficients and the regression R2.
b.Is the effect of education on earnings large?
c.Why should education matter in the determination of earnings? Do the results suggest that there is a guarantee for average hourly earnings to rise for everyone as they receive an additional year of education? Do you think that the relationship between education and average hourly earnings is linear?
d.The average years of education in this sample is 13.5 years.What is mean of average hourly earnings in the sample?
e.Interpret the measure SER.What is its unit of measurement.
= -4.58 + 1.71×educ ,R2 = 0.182,SER = 9.30where ahe and educ are measured in dollars and years respectively.
a.Interpret the coefficients and the regression R2.
b.Is the effect of education on earnings large?
c.Why should education matter in the determination of earnings? Do the results suggest that there is a guarantee for average hourly earnings to rise for everyone as they receive an additional year of education? Do you think that the relationship between education and average hourly earnings is linear?
d.The average years of education in this sample is 13.5 years.What is mean of average hourly earnings in the sample?
e.Interpret the measure SER.What is its unit of measurement.
فتح الحزمة
افتح القفل للوصول البطاقات البالغ عددها 65 في هذه المجموعة.
فتح الحزمة
k this deck
60
You have analyzed the relationship between the weight and height of individuals.Although you are quite confident about the accuracy of your measurements,you feel that some of the observations are extreme,say,two standard deviations above and below the mean.Your therefore decide to disregard these individuals.What consequence will this have on the standard deviation of the OLS estimator of the slope?
فتح الحزمة
افتح القفل للوصول البطاقات البالغ عددها 65 في هذه المجموعة.
فتح الحزمة
k this deck
61
In a simple regression with an intercept and a single explanatory variable,the variation in Y can be decomposed into the explained sums of squares and the sum of squared residuals (see,for example,equation (4.35)in the textbook).
Consider any regression line,positively or negatively sloped in {X,Y} space.Draw a horizontal line where,hypothetically,you consider the sample mean of Y to be.Next add a single actual observation of Y.
In this graph,indicate where you find the following distances: the
(i)residual
(ii)actual minus the mean of Y
(iii)fitted value minus the mean of Y
can be decomposed into the explained sums of squares and the sum of squared residuals (see,for example,equation (4.35)in the textbook).Consider any regression line,positively or negatively sloped in {X,Y} space.Draw a horizontal line where,hypothetically,you consider the sample mean of Y
to be.Next add a single actual observation of Y.In this graph,indicate where you find the following distances: the
(i)residual
(ii)actual minus the mean of Y
(iii)fitted value minus the mean of Y
فتح الحزمة
افتح القفل للوصول البطاقات البالغ عددها 65 في هذه المجموعة.
فتح الحزمة
k this deck
62
At the Stock and Watson (http://www.pearsonhighered.com/stock_watson)website,go to Student Resources and select the option "Datasets for Replicating Empirical Results." Then select the "California Test Score Data Used in Chapters 4-9" and read the data either into Excel or STATA (or another statistical program).
Run a regression of the average reading score (read_scr)on the average math score (math_scr).What values for the slope and the intercept would you expect? Interpret the coefficients in the resulting regression output and the regression R2.
Run a regression of the average reading score (read_scr)on the average math score (math_scr).What values for the slope and the intercept would you expect? Interpret the coefficients in the resulting regression output and the regression R2.
فتح الحزمة
افتح القفل للوصول البطاقات البالغ عددها 65 في هذه المجموعة.
فتح الحزمة
k this deck
63
Assume that there is a change in the units of measurement on both Y and X.The new variables are Y*= aY and X* = bX.What effect will this change have on the regression slope?
فتح الحزمة
افتح القفل للوصول البطاقات البالغ عددها 65 في هذه المجموعة.
فتح الحزمة
k this deck
64
At the Stock and Watson (http://www.pearsonhighered.com/stock_watson)website,go to Student Resources and select the option "Datasets for Replicating Empirical Results." Then select the "California Test Score Data Used in Chapters 4-9" and read the data either into Excel or STATA (or another statistical program).First run a regression where the dependent variable is test scores and the independent variable is the student-teacher ratio.Record the regression R2.Then run a regression where the dependent variable is the student-teacher ratio and the independent variable is test scores.Record the regression R2 from this regression.How do they compare?
فتح الحزمة
افتح القفل للوصول البطاقات البالغ عددها 65 في هذه المجموعة.
فتح الحزمة
k this deck
65
Assume that there is a change in the units of measurement on X.The new variables X* = bX.Prove that this change in the units of measurement on the explanatory variable has no effect on the intercept in the resulting regression.
فتح الحزمة
افتح القفل للوصول البطاقات البالغ عددها 65 في هذه المجموعة.
فتح الحزمة
k this deck
فتح الحزمة
افتح القفل للوصول البطاقات البالغ عددها 65 في هذه المجموعة.


