Deck 7: Inference for Means
ملء الشاشة (f)
سؤال
سؤال
A simple random sample of 100 postal employees is used to test if the average time postal employees have worked for the postal service has changed from the value of 7.5 years recorded 20 years ago.The sample mean was  = 7 years with a standard deviation of s = 2 years.Assume the distribution of the time the employees have worked for the postal service is approximately Normal.The hypotheses being tested are H0: = 7.5 versus Ha: 7.5.A one-sample t test will be used.Suppose the mean and standard deviation obtained were based on a sample of size n = 25 postal workers rather than 100.What do we know about the value of the P-value?
A)It would be larger.
B)It would be smaller.
C)It would be unchanged because the difference between and the hypothesized value = 7.5 is unchanged.
D)It would be unchanged because the variability measured by the standard deviation stays the same.
= 7 years with a standard deviation of s = 2 years.Assume the distribution of the time the employees have worked for the postal service is approximately Normal.The hypotheses being tested are H0: = 7.5 versus Ha: 7.5.A one-sample t test will be used.Suppose the mean and standard deviation obtained were based on a sample of size n = 25 postal workers rather than 100.What do we know about the value of the P-value?A)It would be larger.
B)It would be smaller.
C)It would be unchanged because the difference between
and the hypothesized value = 7.5 is unchanged.D)It would be unchanged because the variability measured by the standard deviation stays the same.
سؤال
A simple random sample of 100 postal employees is used to test if the average time postal employees have worked for the postal service has changed from the value of 7.5 years recorded 20 years ago.The sample mean was  = 7 years with a standard deviation of s = 2 years.Assume the distribution of the time the employees have worked for the postal service is approximately Normal.The hypotheses being tested are H0: = 7.5 versus Ha: 7.5.A one-sample t test will be used.What are the appropriate degrees of freedom for this test?
A)7
B)19
C)99
D)100
= 7 years with a standard deviation of s = 2 years.Assume the distribution of the time the employees have worked for the postal service is approximately Normal.The hypotheses being tested are H0: = 7.5 versus Ha: 7.5.A one-sample t test will be used.What are the appropriate degrees of freedom for this test?A)7
B)19
C)99
D)100
سؤال
سؤال
سؤال
سؤال
سؤال
سؤال
The heights (in inches)of men in the United States are believed to be Normally distributed.The average height of a random sample of 25 American adult men is found to be  = 69.72 inches with a standard deviation of s = 4.15.What is the standard error of
  ?
?
A)0.17
B)0.69
C)0.83
D)2.04
= 69.72 inches with a standard deviation of s = 4.15.What is the standard error of ?A)0.17
B)0.69
C)0.83
D)2.04
سؤال
We wish to see if the electronic control indicating the oven temperature for a certain model oven is properly calibrated.Four ovens of this model are selected at random.The electronic control on each is set to 300°F;after 1 hour,the actual temperature of each is measured.The temperatures measured are 305°F,310°F,300°F,and 305°F.Assume that the distribution of the actual temperatures for this model when the electronic control is set to 300°F is Normal.To test if the electronic control is properly calibrated,we will test the following hypotheses: H0: = 300 versus Ha: 300.Are the data statistically significant at the 5% significance level?
A)Yes,because the P-value is less than 0.05.
B)Yes,because the sample mean = 305°F,which is much higher than 300°F.
C)No,because a difference of 5°F (between and )as compared with 300°F is very small (insignificant).
D)No,because the P-value is greater than 0.05.
A)Yes,because the P-value is less than 0.05.
B)Yes,because the sample mean
= 305°F,which is much higher than 300°F.C)No,because a difference of 5°F (between
and )as compared with 300°F is very small (insignificant).D)No,because the P-value is greater than 0.05.
سؤال
سؤال
A simple random sample of 100 postal employees is used to test if the average time postal employees have worked for the postal service has changed from the value of 7.5 years recorded 20 years ago.The sample mean was  = 7 years with a standard deviation of s = 2 years.Assume the distribution of the time the employees have worked for the postal service is approximately Normal.The hypotheses being tested are H0: = 7.5 versus Ha: 7.5.A one-sample t test will be used.What is the P-value for the one-sample t test?
A)P-value < 0.01
B)0.01 < P-value < 0.05
C)0.05 < P-value < 0.10
D)P-value > 0.10
= 7 years with a standard deviation of s = 2 years.Assume the distribution of the time the employees have worked for the postal service is approximately Normal.The hypotheses being tested are H0: = 7.5 versus Ha: 7.5.A one-sample t test will be used.What is the P-value for the one-sample t test?A)P-value < 0.01
B)0.01 < P-value < 0.05
C)0.05 < P-value < 0.10
D)P-value > 0.10
سؤال
سؤال
A simple random sample of 100 postal employees is used to test if the average time postal employees have worked for the postal service has changed from the value of 7.5 years recorded 20 years ago.The sample mean was  = 7 years with a standard deviation of s = 2 years.Assume the distribution of the time the employees have worked for the postal service is approximately Normal.The hypotheses being tested are H0: = 7.5 versus Ha: 7.5.A one-sample t test will be used.What is a 95% confidence interval for ,the population mean time the postal service employees have spent with the postal service?
A)7 ± 2
B)7 ± 1.984
C)7 ± 0.4
D)7 ± 0.2
= 7 years with a standard deviation of s = 2 years.Assume the distribution of the time the employees have worked for the postal service is approximately Normal.The hypotheses being tested are H0: = 7.5 versus Ha: 7.5.A one-sample t test will be used.What is a 95% confidence interval for ,the population mean time the postal service employees have spent with the postal service?A)7 ± 2
B)7 ± 1.984
C)7 ± 0.4
D)7 ± 0.2
سؤال
سؤال
سؤال
سؤال
سؤال
سؤال
سؤال
Sixteen people volunteered to be part of an experiment.All 16 people were Caucasian,between the ages of 25 and 35,and supplied with nice clothes.Eight of the people were men and eight were women.The question of interest in this experiment was whether females received faster service at restaurants than males.Each of the eight male participants was randomly assigned a restaurant,and each of the eight female were randomly assigned to one of these same eight restaurants.One Friday night,all 16 people went out to eat,each one alone.The men and women assigned to the same restaurant arrived within 5 min of each other,with the order determined by flipping a coin (man first or woman first).Each person then ordered a similar drink and a similar meal.The times (in minutes)until the food arrived at the table was recorded.They are shown below.  The hypotheses being tested are H0: = 0 versus Ha: > 0,where represents the mean of the differences in service time (men - women).Assume that the differences are Normally distributed.What is the value of the t test statistic?
A)t = 1.05
B)t = 1.75
C)t = 2.99
D)t = 8.00
The hypotheses being tested are H0: = 0 versus Ha: > 0,where represents the mean of the differences in service time (men - women).Assume that the differences are Normally distributed.What is the value of the t test statistic?A)t = 1.05
B)t = 1.75
C)t = 2.99
D)t = 8.00
سؤال
A study was to be undertaken to determine if a particular training program would improve physical fitness.An SRS of 31 university students was selected to be enrolled in the fitness program.One important measure of fitness is maximum oxygen uptake.Measurements of oxygen uptake in untrained individuals are known to follow a Normal distribution with a mean of = 45 mL/kg/min.The researchers wished to determine if there was evidence that their sample of students differed from the general population of untrained subjects.The measurements made on the subjects coming into this study produced a mean of  = 47.4 mL/kg/min with a standard deviation of s = 5.3mL/kg/min.If the 98% confidence interval were determined to be (45.2,49.6)an interval,which may or may not be correct,what would the researchers conclude?
A)The sample is not statistically significant at the 0.02 level.
B)The sample mean is significantly different from = 45 at the 0.04 level.
C)There would be no reason to believe the selected students come from a different population.
D)At the 0.02 level of significance,there is evidence to conclude that the sample comes from a population with a mean different from = 45.
E)The true mean oxygen uptake for these students is = 45.
= 47.4 mL/kg/min with a standard deviation of s = 5.3mL/kg/min.If the 98% confidence interval were determined to be (45.2,49.6)an interval,which may or may not be correct,what would the researchers conclude?A)The sample is not statistically significant at the 0.02 level.
B)The sample mean is significantly different from = 45 at the 0.04 level.
C)There would be no reason to believe the selected students come from a different population.
D)At the 0.02 level of significance,there is evidence to conclude that the sample comes from a population with a mean different from = 45.
E)The true mean oxygen uptake for these students is = 45.
سؤال
Sixteen people volunteered to be part of an experiment.All 16 people were Caucasian,between the ages of 25 and 35,and supplied with nice clothes.Eight of the people were men and eight were women.The question of interest in this experiment was whether females received faster service at restaurants than males.Each of the eight male participants was randomly assigned a restaurant,and each of the eight female were randomly assigned to one of these same eight restaurants.One Friday night,all 16 people went out to eat,each one alone.The men and women assigned to the same restaurant arrived within 5 min of each other,with the order determined by flipping a coin (man first or woman first).Each person then ordered a similar drink and a similar meal.The times (in minutes)until the food arrived at the table was recorded.They are shown below. 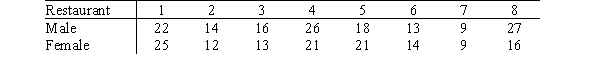 The hypotheses being tested are H0: = 0 versus Ha: > 0,where represents the mean of the differences in service time (men - women).Assume that the differences are Normally distributed.What can you say about the value of the P-value?
A)P-value < 0.025
B)0.025 < P-value < 0.05
C)0.05 < P-value < 0.10
D)P-value > 0.10
The hypotheses being tested are H0: = 0 versus Ha: > 0,where represents the mean of the differences in service time (men - women).Assume that the differences are Normally distributed.What can you say about the value of the P-value?A)P-value < 0.025
B)0.025 < P-value < 0.05
C)0.05 < P-value < 0.10
D)P-value > 0.10
سؤال
A test of significance is to be carried out on the H0: = 36 against the Ha: < 36,based on data from an SRS selected from a Normally distributed population variable.It was decided to use a level of significance of = 0.02 to decide whether or not to reject the null hypothesis.The sample data produced a standard deviation of s = 15.6 based on 12 sample values.What values of  would lead to the rejection of H0?
A) > 46.5
B) < 26.7
C) < 25.5
D) > 45.3
E)This can't be determined with the information provided.
would lead to the rejection of H0?A)
> 46.5B)
< 26.7C)
< 25.5D)
> 45.3E)This can't be determined with the information provided.
سؤال
سؤال
Ten couples are participating in a small study on cholesterol.Neither the man nor the woman in each couple is known to have any problems with high cholesterol.The researcher conducting the study wishes to use the sign test for matched pairs to determine if there is evidence that the cholesterol level for the husband tends to be higher than the cholesterol level for the wife.The cholesterol measurements for the 10 couples are given below. 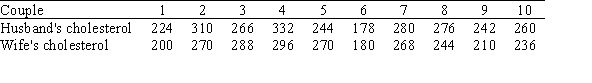 What is the (approximate)value of the P-value?
A)0.039
B)0.055
C)0.079
D)0.172
What is the (approximate)value of the P-value?A)0.039
B)0.055
C)0.079
D)0.172
سؤال
A one-sample t test of H0: = 125 against Ha: > 125 is carried out based on sample data from a Normal population.The SRS of size n = 15 produced a mean of  = 132.8 and s = 12.6.What is the value of the appropriate test statistic?
A)z = 2.40
B)t = 2.32
C)t = 2.40
D)z = 2.32
E)t = 1.76
= 132.8 and s = 12.6.What is the value of the appropriate test statistic?A)z = 2.40
B)t = 2.32
C)t = 2.40
D)z = 2.32
E)t = 1.76
سؤال
Ten couples are participating in a small study on cholesterol.Neither the man nor the woman in each couple is known to have any problems with high cholesterol.The researcher conducting the study wishes to use the sign test for matched pairs to determine if there is evidence that the cholesterol level for the husband tends to be higher than the cholesterol level for the wife.The cholesterol measurements for the 10 couples are given below.  What are the hypotheses the researcher wishes to test?
A)H0: = 0 versus Ha: > 0,where = the mean of the differences in cholesterol levels (husband - wife)for all couples without cholesterol problems
B)H0: p = 1/2 versus Ha: p 1/2,where p = the proportion of cholesterol levels of the husband that are higher than those of the wife
C)H0: p = 1/2 versus Ha: p < 1/2,where p = the proportion of cholesterol levels of the husband that are higher than those of the wife
D)H0: population median = 0 versus Ha: population median > 0,where the differences for which the median is calculated are measured as husband - wife
What are the hypotheses the researcher wishes to test? A)H0: = 0 versus Ha: > 0,where = the mean of the differences in cholesterol levels (husband - wife)for all couples without cholesterol problems
B)H0: p = 1/2 versus Ha: p 1/2,where p = the proportion of cholesterol levels of the husband that are higher than those of the wife
C)H0: p = 1/2 versus Ha: p < 1/2,where p = the proportion of cholesterol levels of the husband that are higher than those of the wife
D)H0: population median = 0 versus Ha: population median > 0,where the differences for which the median is calculated are measured as husband - wife
سؤال
A study was conducted to determine if taking a popularly advertised herbal supplement will result in weight loss in obese males.A random sample of clinically obese males was obtained.Each subject was weighed before taking the supplement and again after 60 days using the supplement.Subjects were told not to alter their diet in any way during the study period.The following table shows the observed results for the six subjects. 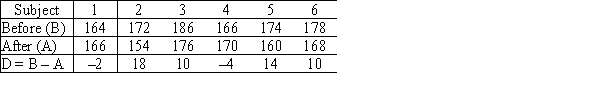 What are the appropriate hypotheses to use in this case to determine if the herbal supplement is effective in achieving weight loss in obese males?
A)H0: = 0 and Ha:
 0
0
B)H0: = 0 and Ha:
 0
0
C)H0: = 0 and Ha:
 < 0
< 0
D)H0: = 0 and Ha:
 > 0
> 0
E)H0: = 0 and Ha:
 > 0
> 0
What are the appropriate hypotheses to use in this case to determine if the herbal supplement is effective in achieving weight loss in obese males?A)H0:
= 0 and Ha: 0B)H0:
= 0 and Ha: 0C)H0:
= 0 and Ha: < 0D)H0:
= 0 and Ha: > 0E)H0:
= 0 and Ha: > 0 سؤال
Do students tend to improve their SAT Mathematics (SAT-M)scores the second time they take the test? A random sample of four students who took the test twice received the following scores.  Assume that the change in SAT-M score (second score - first score)for the population of all students taking the test twice is Normally distributed.What is a 90% confidence interval for ,the mean change in SAT-M score?
A)(-8.24,58.24)
B)(-18.08,68.08)
C)(-22.56,72.56)
D)(-39.31,89.31)
Assume that the change in SAT-M score (second score - first score)for the population of all students taking the test twice is Normally distributed.What is a 90% confidence interval for ,the mean change in SAT-M score?A)(-8.24,58.24)
B)(-18.08,68.08)
C)(-22.56,72.56)
D)(-39.31,89.31)
سؤال
A study was to be undertaken to determine if a particular training program would improve physical fitness.An SRS of 31 university students was selected to be enrolled in the fitness program.One important measure of fitness is maximum oxygen uptake.Measurements of oxygen uptake in untrained individuals are known to follow a Normal distribution with a mean of = 45 mL/kg/min.The researchers wished to determine if there was evidence that their sample of students differed from the general population of untrained subjects.The measurements made on the subjects coming into this study produced a mean of  = 47.4 mL/kg/min with a standard deviation of s = 5.3 mL/kg/min.What is the appropriate alternative hypothesis in this situation?
A)Ha: > 45
> 45
B)Ha: < 45
C)Ha: 45
D)Ha: 45
45
E)Ha: > 45
= 47.4 mL/kg/min with a standard deviation of s = 5.3 mL/kg/min.What is the appropriate alternative hypothesis in this situation?A)Ha:
> 45B)Ha: < 45
C)Ha: 45
D)Ha:
45E)Ha: > 45
سؤال
A study was to be undertaken to determine if a particular training program would improve physical fitness.An SRS of 31 university students was selected to be enrolled in the fitness program.One important measure of fitness is maximum oxygen uptake.Measurements of oxygen uptake in untrained individuals are known to follow a Normal distribution with a mean of = 45 mL/kg/min.The researchers wished to determine if there was evidence that their sample of students differed from the general population of untrained subjects.The measurements made on the subjects coming into this study produced a mean of  = 47.4 mL/kg/min with a standard deviation of s = 5.3 mL/kg/min.What is the approximate P-value for the test?
A)P < 0.005
B)0.005 < P < 0.01
C)0.01 < P < 0.02
D)P > 0.02
E)P = 0.0118
= 47.4 mL/kg/min with a standard deviation of s = 5.3 mL/kg/min.What is the approximate P-value for the test?A)P < 0.005
B)0.005 < P < 0.01
C)0.01 < P < 0.02
D)P > 0.02
E)P = 0.0118
سؤال
A one-sample t test of H0: = 125 against Ha: > 125 is carried out based on sample data from a Normal population.The SRS of size n = 15 produced a mean of  = 132.8 and s = 12.6.What is the P-value of the test in this situation?
A)P = 0.008
B)P > 0.02
C)0.02 < P < 0.04
D)0.01 < P < 0.02
E)0.02 < P < 0.025
= 132.8 and s = 12.6.What is the P-value of the test in this situation?A)P = 0.008
B)P > 0.02
C)0.02 < P < 0.04
D)0.01 < P < 0.02
E)0.02 < P < 0.025
سؤال
Twelve runners are asked to run a 10-kilometer race on each of two consecutive weeks.In one of the races,the runners wear one brand of shoe and in the other,a different brand.The brand of shoe they wear in each race is determined at random.All runners are timed and are asked to run their best in each race.The results (in minutes)are given below. 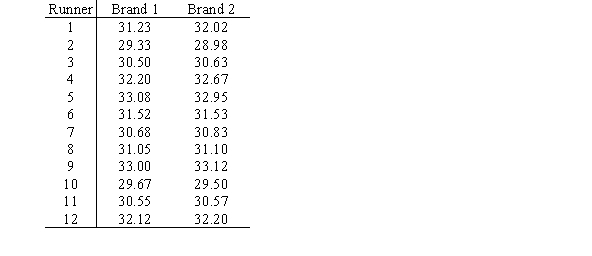 Use the sign test for matched pairs to determine if there is evidence that times using Brand 1 tend to be faster than times using Brand 2.Determine which of the following statements is TRUE.
A)We would not reject the null hypothesis of no difference at the 0.10 level.
B)We would reject the null hypothesis of no difference at the 0.10 level but not at the 0.05 level.
C)We would reject the null hypothesis of no difference at the 0.05 level but not at the 0.01 level.
D)We would reject the null hypothesis of no difference at the 0.01 level.
Use the sign test for matched pairs to determine if there is evidence that times using Brand 1 tend to be faster than times using Brand 2.Determine which of the following statements is TRUE.A)We would not reject the null hypothesis of no difference at the 0.10 level.
B)We would reject the null hypothesis of no difference at the 0.10 level but not at the 0.05 level.
C)We would reject the null hypothesis of no difference at the 0.05 level but not at the 0.01 level.
D)We would reject the null hypothesis of no difference at the 0.01 level.
سؤال
A study was to be undertaken to determine if a particular training program would improve physical fitness.An SRS of 31 university students was selected to be enrolled in the fitness program.One important measure of fitness is maximum oxygen uptake.Measurements of oxygen uptake in untrained individuals are known to follow a Normal distribution with a mean of = 45 mL/kg/min.The researchers wished to determine if there was evidence that their sample of students differed from the general population of untrained subjects.The measurements made on the subjects coming into this study produced a mean of  = 47.4 mL/kg/min with a standard deviation of s = 5.3 mL/kg/min.Suppose the 98% confidence interval were determined to be (45.2,49.6)an interval.If the level of confidence were changed to 95%,what would happen to the confidence interval and the P-value?
A)The confidence interval would become longer and the P-value would decrease.
B)The confidence interval would become shorter and the P-value would increase.
C)The confidence interval would not change and the P-value also would not change.
D)The confidence interval would become shorter and the P-value would decrease.
E)The confidence interval would become shorter but the P-value would not change.
= 47.4 mL/kg/min with a standard deviation of s = 5.3 mL/kg/min.Suppose the 98% confidence interval were determined to be (45.2,49.6)an interval.If the level of confidence were changed to 95%,what would happen to the confidence interval and the P-value?A)The confidence interval would become longer and the P-value would decrease.
B)The confidence interval would become shorter and the P-value would increase.
C)The confidence interval would not change and the P-value also would not change.
D)The confidence interval would become shorter and the P-value would decrease.
E)The confidence interval would become shorter but the P-value would not change.
سؤال
A random sample of 20 observations produced a sample mean of  = 92.4 and s = 25.8.What is the value of the standard error of
  ?
?
A)4.6
B)15.9
C)1.3
D)5.8
E)2.6
= 92.4 and s = 25.8.What is the value of the standard error of ?A)4.6
B)15.9
C)1.3
D)5.8
E)2.6
سؤال
Twelve runners are asked to run a 10-kilometer race on each of two consecutive weeks.In one of the races,the runners wear one brand of shoe and in the other,a different brand.The brand of shoe they wear in each race is determined at random.All runners are timed and are asked to run their best in each race.The results (in minutes)are given below.  Use the sign test for matched pairs to determine if there is evidence that times using Brand 1 tend to be faster than times using Brand 2.What is the (approximate)value of the P-value?
A)0.019
B)0.042
C)0.05
D)0.073
Use the sign test for matched pairs to determine if there is evidence that times using Brand 1 tend to be faster than times using Brand 2.What is the (approximate)value of the P-value?A)0.019
B)0.042
C)0.05
D)0.073
سؤال
Twelve runners are asked to run a 10-kilometer race on each of two consecutive weeks.In one of the races,the runners wear one brand of shoe and in the other,a different brand.The brand of shoe they wear in each race is determined at random.All runners are timed and are asked to run their best in each race.The results (in minutes)are given below. 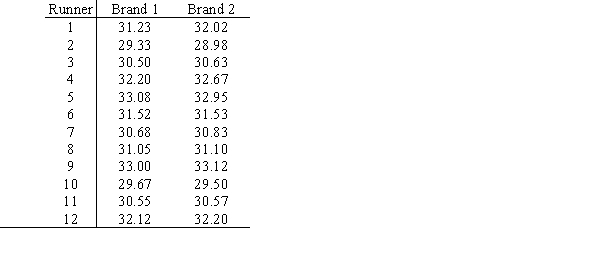 Use the sign test for matched pairs to determine if there is evidence that times using Brand 1 tend to be faster than times using Brand 2.What are the hypotheses we wish to test?
A)H0: = 0 versus Ha: > 0,where = the mean of the differences in running times (Brand 2 - Brand 1)for all runners who run this race twice wearing the two brands of shoes
B)H0: p = 1/2 versus Ha: p 1/2,where p = the proportion of running times using Brand 1 that are faster than times using Brand 2
C)H0: p = 1/2 versus Ha: p > 1/2,where p = the proportion of running times using Brand 1 that are faster than times using Brand 2
D)H0: population median = 0 versus Ha: population median 0,where the median of the differences in running times for all runners who run this race twice wearing the two brands of shoes is measured for Brand 2 - Brand 1
Use the sign test for matched pairs to determine if there is evidence that times using Brand 1 tend to be faster than times using Brand 2.What are the hypotheses we wish to test?A)H0: = 0 versus Ha: > 0,where = the mean of the differences in running times (Brand 2 - Brand 1)for all runners who run this race twice wearing the two brands of shoes
B)H0: p = 1/2 versus Ha: p 1/2,where p = the proportion of running times using Brand 1 that are faster than times using Brand 2
C)H0: p = 1/2 versus Ha: p > 1/2,where p = the proportion of running times using Brand 1 that are faster than times using Brand 2
D)H0: population median = 0 versus Ha: population median 0,where the median of the differences in running times for all runners who run this race twice wearing the two brands of shoes is measured for Brand 2 - Brand 1
سؤال
Do students tend to improve their SAT Mathematics (SAT-M)scores the second time they take the test? A random sample of four students who took the test twice received the following scores. 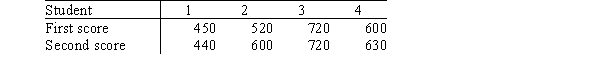 Assume that the change in SAT-M score (second score - first score)for the population of all students taking the test twice is Normally distributed.Suppose we do not believe that students tend to improve their SAT-M scores the second time they take the test.Based on a 90% confidence interval,we wish to test H0: = 0 versus Ha: 0 at the 5% significance level.Determine which of the following statements is true.
A)We cannot make a decision since the confidence interval is so wide.
B)We cannot make a decision since the confidence level we used to calculate the confidence interval is 90%,and we would need a 95% confidence interval.
C)We accept H0 since the value 0 falls in the 90% confidence interval and would therefore also fall in the 95% confidence interval.
D)We reject H0 since the value 0 falls in the 90% confidence interval.
Assume that the change in SAT-M score (second score - first score)for the population of all students taking the test twice is Normally distributed.Suppose we do not believe that students tend to improve their SAT-M scores the second time they take the test.Based on a 90% confidence interval,we wish to test H0: = 0 versus Ha: 0 at the 5% significance level.Determine which of the following statements is true.A)We cannot make a decision since the confidence interval is so wide.
B)We cannot make a decision since the confidence level we used to calculate the confidence interval is 90%,and we would need a 95% confidence interval.
C)We accept H0 since the value 0 falls in the 90% confidence interval and would therefore also fall in the 95% confidence interval.
D)We reject H0 since the value 0 falls in the 90% confidence interval.
سؤال
A study was to be undertaken to determine if a particular training program would improve physical fitness.An SRS of 31 university students was selected to be enrolled in the fitness program.One important measure of fitness is maximum oxygen uptake.Measurements of oxygen uptake in untrained individuals are known to follow a Normal distribution with a mean of = 45 mL/kg/min.The researchers wished to determine if there was evidence that their sample of students differed from the general population of untrained subjects.The measurements made on the subjects coming into this study produced a mean of  = 47.4 mL/kg/min with a standard deviation of s = 5.3 mL/kg/min.Based on these data,what is the 98% confidence interval estimate for the mean oxygen uptake for the population from which the sample of students was selected?
A)47.4 ± 2.147 ( )
)
B)47.4 ± 2.054 ( )
)
C)47.4 ± 2.457 ( )
)
D)47.4 ± 2.147 ( )
)
E)47.4 ± 2.457 ( )
)
= 47.4 mL/kg/min with a standard deviation of s = 5.3 mL/kg/min.Based on these data,what is the 98% confidence interval estimate for the mean oxygen uptake for the population from which the sample of students was selected?A)47.4 ± 2.147 (
)B)47.4 ± 2.054 (
)C)47.4 ± 2.457 (
)D)47.4 ± 2.147 (
)E)47.4 ± 2.457 (
) سؤال
سؤال
سؤال
سؤال
سؤال
سؤال
سؤال
سؤال
سؤال
سؤال
سؤال
سؤال
سؤال
A study was conducted to determine if taking a popularly advertised herbal supplement will result in weight loss in obese males.A random sample of clinically obese males was obtained.Each subject was weighed before taking the supplement and again after 60 days using the supplement.Subjects were told not to alter their diet in any way during the study period.The following table shows the observed results for the six subjects.  With = 0.05,what observed values of the test statistic would cause the sample results to be declared statistically significant?
A)z > 1.645
B)t > 2.015
C)t > 1.796
D)z > 1.960
E)| t | > 2.571
With = 0.05,what observed values of the test statistic would cause the sample results to be declared statistically significant?A)z > 1.645
B)t > 2.015
C)t > 1.796
D)z > 1.960
E)| t | > 2.571
سؤال
سؤال
سؤال
سؤال
سؤال
سؤال
Assume that sample data,based on two independent samples of size 25,give us  = 505,
  = 515,s1 = 23,and s2 = 28.What is a 95% confidence interval (use the conservative value for the degrees of freedom)for 2 - 1?
A)(-2.40,22.40)
B)(-4.57,24.57)
C)(-4.96,24.96)
D)(5.79,14.21)
= 505, = 515,s1 = 23,and s2 = 28.What is a 95% confidence interval (use the conservative value for the degrees of freedom)for 2 - 1?A)(-2.40,22.40)
B)(-4.57,24.57)
C)(-4.96,24.96)
D)(5.79,14.21)
سؤال
سؤال
سؤال
سؤال
سؤال
سؤال
سؤال
سؤال
You are interested in determining if the average amount of time (in hours)that students spend on the Internet per day is greater than 2 hours.The data below are from a random sample of 11 students.  What is the value of the t statistic after removing the second observation (value = 100)?
A)6.65
B)1.43
C)0
D)None of the above
What is the value of the t statistic after removing the second observation (value = 100)?A)6.65
B)1.43
C)0
D)None of the above
سؤال
You are interested in determining if the average amount of time (in hours)that students spend on the Internet per day is greater than 2 hours.The data below are from a random sample of 11 students.  What did you notice from your preliminary analysis of the data?
A)The data were not approximately normal.
B)There are outliers.
C)The data are normal.
D)A and B are both correct.
What did you notice from your preliminary analysis of the data?A)The data were not approximately normal.
B)There are outliers.
C)The data are normal.
D)A and B are both correct.
سؤال
سؤال
You are interested in determining if the average amount of time (in hours)that students spend on the Internet per day is greater than 2 hours.The data below are from a random sample of 11 students.  If we remove the second observation (value = 100),we could test the hypothesis using a ____ .
A)z statistic
B)t statistic
If we remove the second observation (value = 100),we could test the hypothesis using a ____ .A)z statistic
B)t statistic
سؤال
سؤال
You are interested in determining if the average amount of time (in hours)that students spend on the Internet per day is greater than 2 hours.The data below are from a random sample of 11 students.  Would the null hypothesis be rejected at the .05 significance level after removing the second observation (value = 100)?
A)Yes,because the P-value is greater than .05.
B)Yes,because the P-value is less than .05.
C)No,because the P-value is greater than .05.
D)No,because the P-value is less than .05.
Would the null hypothesis be rejected at the .05 significance level after removing the second observation (value = 100)?A)Yes,because the P-value is greater than .05.
B)Yes,because the P-value is less than .05.
C)No,because the P-value is greater than .05.
D)No,because the P-value is less than .05.
سؤال
You are interested in determining if the average amount of time (in hours)that students spend on the Internet per day is greater than 2 hours.The data below are from a random sample of 11 students.  What is the standard error of the mean?
A)29.4
B)8.86
C)11.4
D)None of the above
What is the standard error of the mean?A)29.4
B)8.86
C)11.4
D)None of the above
سؤال
سؤال
You are interested in determining if the average amount of time (in hours)that students spend on the Internet per day is greater than 2 hours.The data below are from a random sample of 11 students.  Suppose you were to remove the second observation (value = 100),would a t procedure be appropriate for these data?
A)No,the data set would be too small.
B)No,you cannot remove data.
C)Yes,the assumptions would be reasonably met.
D)Yes,smaller data sets are better for t procedures.
Suppose you were to remove the second observation (value = 100),would a t procedure be appropriate for these data?A)No,the data set would be too small.
B)No,you cannot remove data.
C)Yes,the assumptions would be reasonably met.
D)Yes,smaller data sets are better for t procedures.
سؤال
You are interested in determining if the average amount of time (in hours)that students spend on the Internet per day is greater than 2 hours.The data below are from a random sample of 11 students.  What are the number of degrees of freedom after removing the second observation (value = 100)?
A)11
B)10
C)9
D)8
What are the number of degrees of freedom after removing the second observation (value = 100)?A)11
B)10
C)9
D)8
سؤال
سؤال
سؤال
You are interested in determining if the average amount of time (in hours)that students spend on the Internet per day is greater than 2 hours.The data below are from a random sample of 11 students.  The alternative hypothesis for this problem is ______.
A)one sided
B)two sided
C)three sided
D)four sided
The alternative hypothesis for this problem is ______.A)one sided
B)two sided
C)three sided
D)four sided
سؤال
You are interested in determining if the average amount of time (in hours)that students spend on the Internet per day is greater than 2 hours.The data below are from a random sample of 11 students.  Would a t procedure be appropriate for these data?
A)Yes,the necessary assumptions have been met for a t procedure
B)No,the necessary assumptions have not been met for a t procedure
Would a t procedure be appropriate for these data?A)Yes,the necessary assumptions have been met for a t procedure
B)No,the necessary assumptions have not been met for a t procedure

فتح الحزمة
قم بالتسجيل لفتح البطاقات في هذه المجموعة!
Unlock Deck
Unlock Deck
1/103
العب
ملء الشاشة (f)
Deck 7: Inference for Means
1
We wish to see if the electronic control indicating the oven temperature for a certain model oven is properly calibrated.Four ovens of this model are selected at random.The electronic control on each is set to 300°F;after 1 hour,the actual temperature of each is measured.The temperatures measured are 305°F,310°F,300°F,and 305°F.Assume that the distribution of the actual temperatures for this model when the electronic control is set to 300°F is Normal.To test if the electronic control is properly calibrated,we will test the following hypotheses: H0: = 300 versus Ha: 300.Assume the standard deviation for the distribution of actual temperatures for all ovens of this model when the electronic control is set to 300°F is = 4.At the 5% significance level,what is the power of our test when,in fact, = 310°F?
A)0.0345
B)0.9655
C)0.9959
D)0.9988
A)0.0345
B)0.9655
C)0.9959
D)0.9988
0.9988
2
A simple random sample of 100 postal employees is used to test if the average time postal employees have worked for the postal service has changed from the value of 7.5 years recorded 20 years ago.The sample mean was = 7 years with a standard deviation of s = 2 years.Assume the distribution of the time the employees have worked for the postal service is approximately Normal.The hypotheses being tested are H0: = 7.5 versus Ha: 7.5.A one-sample t test will be used.Suppose the mean and standard deviation obtained were based on a sample of size n = 25 postal workers rather than 100.What do we know about the value of the P-value?
A)It would be larger.
B)It would be smaller.
C)It would be unchanged because the difference between and the hypothesized value = 7.5 is unchanged.
D)It would be unchanged because the variability measured by the standard deviation stays the same.
= 7 years with a standard deviation of s = 2 years.Assume the distribution of the time the employees have worked for the postal service is approximately Normal.The hypotheses being tested are H0: = 7.5 versus Ha: 7.5.A one-sample t test will be used.Suppose the mean and standard deviation obtained were based on a sample of size n = 25 postal workers rather than 100.What do we know about the value of the P-value?A)It would be larger.
B)It would be smaller.
C)It would be unchanged because the difference between
and the hypothesized value = 7.5 is unchanged.D)It would be unchanged because the variability measured by the standard deviation stays the same.
It would be larger.
3
A simple random sample of 100 postal employees is used to test if the average time postal employees have worked for the postal service has changed from the value of 7.5 years recorded 20 years ago.The sample mean was = 7 years with a standard deviation of s = 2 years.Assume the distribution of the time the employees have worked for the postal service is approximately Normal.The hypotheses being tested are H0: = 7.5 versus Ha: 7.5.A one-sample t test will be used.What are the appropriate degrees of freedom for this test?
A)7
B)19
C)99
D)100
= 7 years with a standard deviation of s = 2 years.Assume the distribution of the time the employees have worked for the postal service is approximately Normal.The hypotheses being tested are H0: = 7.5 versus Ha: 7.5.A one-sample t test will be used.What are the appropriate degrees of freedom for this test?A)7
B)19
C)99
D)100
99
4
The hypotheses H0: = 10 versus Ha: 10 are examined using a sample of size n = 18.The one-sample t statistic has the value t = -2.05.Between what two values does the P-value of this test fall?
A)0.01 < P-value < 0.025
B)0.02 < P-value < 0.05
C)0.025 < P-value < 0.05
D)0.05 < P-value < 0.10
A)0.01 < P-value < 0.025
B)0.02 < P-value < 0.05
C)0.025 < P-value < 0.05
D)0.05 < P-value < 0.10
فتح الحزمة
افتح القفل للوصول البطاقات البالغ عددها 103 في هذه المجموعة.
فتح الحزمة
k this deck
5
A simple random sample of 20 third-grade children from a certain school district is selected,and each is given a test to measure his/her reading ability.You are interested in calculating a 95% confidence interval for the population mean score.In the sample,the mean score is 64 points and the standard deviation is 12 points.What is the margin of error associated with the confidence interval?
A)2.68 points
B)4.64 points
C)5.62 points
D)6.84 points
A)2.68 points
B)4.64 points
C)5.62 points
D)6.84 points
فتح الحزمة
افتح القفل للوصول البطاقات البالغ عددها 103 في هذه المجموعة.
فتح الحزمة
k this deck
6
To estimate ,the mean salary of full professors at American colleges and universities,you obtain the salaries of a random sample of 400 full professors.The sample mean is $73,220 and the sample standard deviation is $4400.What is a 99% confidence interval for the mean ?
A)73,220 ± 28
B)73,220 ± 433
C)73,220 ± 569
D)73,220 ± 4400
A)73,220 ± 28
B)73,220 ± 433
C)73,220 ± 569
D)73,220 ± 4400
فتح الحزمة
افتح القفل للوصول البطاقات البالغ عددها 103 في هذه المجموعة.
فتح الحزمة
k this deck
7
Bags of a certain brand of tortilla chips claim to have a net weight of 14 ounces.Net weights actually vary slightly from bag to bag.Assume net weights are Normally distributed.A representative of a consumer advocate group wishes to see if there is any evidence that the mean net weight is less than advertised and so intends to test the hypotheses H0: = 14 versus Ha: < 14.To do this,he selects 16 bags of tortilla chips of this brand at random and determines the net weight of each.He finds a sample mean of 13.88 ounces with a standard deviation of s = 0.24 ounces.Determine which of the following statements is true,regarding the decision the representative would make.
A)He would not reject H0 at a significance level of 0.05.
B)He would reject H0 at a significance level of 0.05 but not at 0.025.
C)He would reject H0 at a significance level of 0.025 but not at 0.01.
D)He would reject H0 at a significance level of 0.01.
A)He would not reject H0 at a significance level of 0.05.
B)He would reject H0 at a significance level of 0.05 but not at 0.025.
C)He would reject H0 at a significance level of 0.025 but not at 0.01.
D)He would reject H0 at a significance level of 0.01.
فتح الحزمة
افتح القفل للوصول البطاقات البالغ عددها 103 في هذه المجموعة.
فتح الحزمة
k this deck
8
A sample of size n = 27 is used to conduct a significance test for H0: = 75 versus Ha: > 75.The test statistic is t = 3.45.What are the degrees of freedom for this test statistic?
A)26
B)27
C)74
D)75
A)26
B)27
C)74
D)75
فتح الحزمة
افتح القفل للوصول البطاقات البالغ عددها 103 في هذه المجموعة.
فتح الحزمة
k this deck
9
The heights (in inches)of men in the United States are believed to be Normally distributed.The average height of a random sample of 25 American adult men is found to be = 69.72 inches with a standard deviation of s = 4.15.What is the standard error of ?
A)0.17
B)0.69
C)0.83
D)2.04
= 69.72 inches with a standard deviation of s = 4.15.What is the standard error of ?A)0.17
B)0.69
C)0.83
D)2.04
فتح الحزمة
افتح القفل للوصول البطاقات البالغ عددها 103 في هذه المجموعة.
فتح الحزمة
k this deck
10
We wish to see if the electronic control indicating the oven temperature for a certain model oven is properly calibrated.Four ovens of this model are selected at random.The electronic control on each is set to 300°F;after 1 hour,the actual temperature of each is measured.The temperatures measured are 305°F,310°F,300°F,and 305°F.Assume that the distribution of the actual temperatures for this model when the electronic control is set to 300°F is Normal.To test if the electronic control is properly calibrated,we will test the following hypotheses: H0: = 300 versus Ha: 300.Are the data statistically significant at the 5% significance level?
A)Yes,because the P-value is less than 0.05.
B)Yes,because the sample mean = 305°F,which is much higher than 300°F.
C)No,because a difference of 5°F (between and )as compared with 300°F is very small (insignificant).
D)No,because the P-value is greater than 0.05.
A)Yes,because the P-value is less than 0.05.
B)Yes,because the sample mean
= 305°F,which is much higher than 300°F.C)No,because a difference of 5°F (between
and )as compared with 300°F is very small (insignificant).D)No,because the P-value is greater than 0.05.
فتح الحزمة
افتح القفل للوصول البطاقات البالغ عددها 103 في هذه المجموعة.
فتح الحزمة
k this deck
11
The hypotheses H0: = 350 versus Ha: < 350 are examined using a sample of size n = 20.The one-sample t statistic has the value t = -1.68.What do we know about the P-value of this test?
A)P-value < 0.01
B)0.01 < P-value < 0.025
C)0.025 < P-value < 0.05
D)P-value > 0.05
A)P-value < 0.01
B)0.01 < P-value < 0.025
C)0.025 < P-value < 0.05
D)P-value > 0.05
فتح الحزمة
افتح القفل للوصول البطاقات البالغ عددها 103 في هذه المجموعة.
فتح الحزمة
k this deck
12
A simple random sample of 100 postal employees is used to test if the average time postal employees have worked for the postal service has changed from the value of 7.5 years recorded 20 years ago.The sample mean was = 7 years with a standard deviation of s = 2 years.Assume the distribution of the time the employees have worked for the postal service is approximately Normal.The hypotheses being tested are H0: = 7.5 versus Ha: 7.5.A one-sample t test will be used.What is the P-value for the one-sample t test?
A)P-value < 0.01
B)0.01 < P-value < 0.05
C)0.05 < P-value < 0.10
D)P-value > 0.10
= 7 years with a standard deviation of s = 2 years.Assume the distribution of the time the employees have worked for the postal service is approximately Normal.The hypotheses being tested are H0: = 7.5 versus Ha: 7.5.A one-sample t test will be used.What is the P-value for the one-sample t test?A)P-value < 0.01
B)0.01 < P-value < 0.05
C)0.05 < P-value < 0.10
D)P-value > 0.10
فتح الحزمة
افتح القفل للوصول البطاقات البالغ عددها 103 في هذه المجموعة.
فتح الحزمة
k this deck
13
Scores on the math section of the SAT are believed to be Normally distributed.The scores of a simple random sample of five students who recently took the exam are 550,620,710,520,and 480.What is a 95% confidence interval for ,the population mean score on the math section of the SAT?
A)(456.7,695.3)
B)(463.4,688.6)
C)(480.8,671.2)
D)(496.5,655.5)
A)(456.7,695.3)
B)(463.4,688.6)
C)(480.8,671.2)
D)(496.5,655.5)
فتح الحزمة
افتح القفل للوصول البطاقات البالغ عددها 103 في هذه المجموعة.
فتح الحزمة
k this deck
14
A simple random sample of 100 postal employees is used to test if the average time postal employees have worked for the postal service has changed from the value of 7.5 years recorded 20 years ago.The sample mean was = 7 years with a standard deviation of s = 2 years.Assume the distribution of the time the employees have worked for the postal service is approximately Normal.The hypotheses being tested are H0: = 7.5 versus Ha: 7.5.A one-sample t test will be used.What is a 95% confidence interval for ,the population mean time the postal service employees have spent with the postal service?
A)7 ± 2
B)7 ± 1.984
C)7 ± 0.4
D)7 ± 0.2
= 7 years with a standard deviation of s = 2 years.Assume the distribution of the time the employees have worked for the postal service is approximately Normal.The hypotheses being tested are H0: = 7.5 versus Ha: 7.5.A one-sample t test will be used.What is a 95% confidence interval for ,the population mean time the postal service employees have spent with the postal service?A)7 ± 2
B)7 ± 1.984
C)7 ± 0.4
D)7 ± 0.2
فتح الحزمة
افتح القفل للوصول البطاقات البالغ عددها 103 في هذه المجموعة.
فتح الحزمة
k this deck
15
A simple random sample of six patients over the age of 65 is being used in a blood pressure study.The standard error of the mean blood pressure of these six men was 22.8.What is the standard deviation of these six blood pressure measurements?
A)9.31
B)50.98
C)55.85
D)136.8
A)9.31
B)50.98
C)55.85
D)136.8
فتح الحزمة
افتح القفل للوصول البطاقات البالغ عددها 103 في هذه المجموعة.
فتح الحزمة
k this deck
16
Bags of a certain brand of tortilla chips claim to have a net weight of 14 oz.Net weights slightly vary from bag to bag.Assume net weights are Normally distributed.A representative of a consumer advocate group wishes to see if there is any evidence that the mean net weight is less than advertised and so intends to test the hypotheses H0: = 14 versus Ha: < 14.To do this,he selects 16 bags of tortilla chips of this brand at random and determines the net weight of each.He finds a sample mean of 13.88 oz with a standard deviation of s = 0.24 oz.Assume the standard deviation for the distribution of actual net weights for bags of tortilla chips of this brand is = 0.25.At the 5% significance level,what is the power of our test when,in fact, = 13.8 oz?
A)0.654
B)0.857
C)0.940
D)0.997
A)0.654
B)0.857
C)0.940
D)0.997
فتح الحزمة
افتح القفل للوصول البطاقات البالغ عددها 103 في هذه المجموعة.
فتح الحزمة
k this deck
17
Bags of a certain brand of tortilla chips claim to have a net weight of 14 oz.Net weights slightly vary from bag to bag.Assume net weights are Normally distributed.A representative of a consumer advocate group wishes to see if there is any evidence that the mean net weight is less than advertised and so intends to test the hypotheses H0: = 14 versus Ha: < 14.To do this,he selects 16 bags of tortilla chips of this brand at random and determines the net weight of each.He finds a sample mean of 13.88 oz with a standard deviation of s = 0.24 oz.Suppose we were not sure if the distribution of net weights were Normal.In which of the following circumstances would the t procedure not be robust in this problem?
A)The mean and median of the data are nearly equal.
B)A histogram of the data is moderately skewed.
C)A boxplot of the data shows the presence of a large outlier.
D)The sample standard deviation is large.
A)The mean and median of the data are nearly equal.
B)A histogram of the data is moderately skewed.
C)A boxplot of the data shows the presence of a large outlier.
D)The sample standard deviation is large.
فتح الحزمة
افتح القفل للوصول البطاقات البالغ عددها 103 في هذه المجموعة.
فتح الحزمة
k this deck
18
Bags of a certain brand of tortilla chips claim to have a net weight of 14 ounces.Net weights actually vary slightly from bag to bag.Assume net weights are Normally distributed.A representative of a consumer advocate group wishes to see if there is any evidence that the mean net weight is less than advertised and so intends to test the hypotheses H0: = 14 versus Ha: < 14.To do this,he selects 16 bags of tortilla chips of this brand at random and determines the net weight of each.He finds a sample mean of 13.88 ounces with a standard deviation of s = 0.24 ounces.What is the value of the test statistic?
A)t = -0.50
B)t = -2.00
C)t = -8.00
D)t = -8.33
A)t = -0.50
B)t = -2.00
C)t = -8.00
D)t = -8.33
فتح الحزمة
افتح القفل للوصول البطاقات البالغ عددها 103 في هذه المجموعة.
فتح الحزمة
k this deck
19
A simple random sample of five basketball players is selected.Their heights (in centimeters)are 170,175,169,183,and 177.What is the standard error of the mean of these height measurements?
A)2.538
B)2.837
C)5.075
D)5.675
A)2.538
B)2.837
C)5.075
D)5.675
فتح الحزمة
افتح القفل للوصول البطاقات البالغ عددها 103 في هذه المجموعة.
فتح الحزمة
k this deck
20
We wish to see if the electronic control indicating the oven temperature for a certain model oven is properly calibrated.Four ovens of this model are selected at random.The electronic control on each is set to 300°F;after 1 hour,the actual temperature of each is measured.The temperatures measured are 305°F,310°F,300°F,and 305°F.Assume that the distribution of the actual temperatures for this model when the electronic control is set to 300°F is Normal.To test if the electronic control is properly calibrated,we will test the following hypotheses: H0: = 300 versus Ha: 300.Based on the data,what is the value of the one-sample t statistic?
A)1.23
B)2.45
C)4.90
D)5.0
A)1.23
B)2.45
C)4.90
D)5.0
فتح الحزمة
افتح القفل للوصول البطاقات البالغ عددها 103 في هذه المجموعة.
فتح الحزمة
k this deck
21
Sixteen people volunteered to be part of an experiment.All 16 people were Caucasian,between the ages of 25 and 35,and supplied with nice clothes.Eight of the people were men and eight were women.The question of interest in this experiment was whether females received faster service at restaurants than males.Each of the eight male participants was randomly assigned a restaurant,and each of the eight female were randomly assigned to one of these same eight restaurants.One Friday night,all 16 people went out to eat,each one alone.The men and women assigned to the same restaurant arrived within 5 min of each other,with the order determined by flipping a coin (man first or woman first).Each person then ordered a similar drink and a similar meal.The times (in minutes)until the food arrived at the table was recorded.They are shown below. The hypotheses being tested are H0: = 0 versus Ha: > 0,where represents the mean of the differences in service time (men - women).Assume that the differences are Normally distributed.What is the value of the t test statistic?
A)t = 1.05
B)t = 1.75
C)t = 2.99
D)t = 8.00
The hypotheses being tested are H0: = 0 versus Ha: > 0,where represents the mean of the differences in service time (men - women).Assume that the differences are Normally distributed.What is the value of the t test statistic?A)t = 1.05
B)t = 1.75
C)t = 2.99
D)t = 8.00
فتح الحزمة
افتح القفل للوصول البطاقات البالغ عددها 103 في هذه المجموعة.
فتح الحزمة
k this deck
22
A study was to be undertaken to determine if a particular training program would improve physical fitness.An SRS of 31 university students was selected to be enrolled in the fitness program.One important measure of fitness is maximum oxygen uptake.Measurements of oxygen uptake in untrained individuals are known to follow a Normal distribution with a mean of = 45 mL/kg/min.The researchers wished to determine if there was evidence that their sample of students differed from the general population of untrained subjects.The measurements made on the subjects coming into this study produced a mean of = 47.4 mL/kg/min with a standard deviation of s = 5.3mL/kg/min.If the 98% confidence interval were determined to be (45.2,49.6)an interval,which may or may not be correct,what would the researchers conclude?
A)The sample is not statistically significant at the 0.02 level.
B)The sample mean is significantly different from = 45 at the 0.04 level.
C)There would be no reason to believe the selected students come from a different population.
D)At the 0.02 level of significance,there is evidence to conclude that the sample comes from a population with a mean different from = 45.
E)The true mean oxygen uptake for these students is = 45.
= 47.4 mL/kg/min with a standard deviation of s = 5.3mL/kg/min.If the 98% confidence interval were determined to be (45.2,49.6)an interval,which may or may not be correct,what would the researchers conclude?A)The sample is not statistically significant at the 0.02 level.
B)The sample mean is significantly different from = 45 at the 0.04 level.
C)There would be no reason to believe the selected students come from a different population.
D)At the 0.02 level of significance,there is evidence to conclude that the sample comes from a population with a mean different from = 45.
E)The true mean oxygen uptake for these students is = 45.
فتح الحزمة
افتح القفل للوصول البطاقات البالغ عددها 103 في هذه المجموعة.
فتح الحزمة
k this deck
23
Sixteen people volunteered to be part of an experiment.All 16 people were Caucasian,between the ages of 25 and 35,and supplied with nice clothes.Eight of the people were men and eight were women.The question of interest in this experiment was whether females received faster service at restaurants than males.Each of the eight male participants was randomly assigned a restaurant,and each of the eight female were randomly assigned to one of these same eight restaurants.One Friday night,all 16 people went out to eat,each one alone.The men and women assigned to the same restaurant arrived within 5 min of each other,with the order determined by flipping a coin (man first or woman first).Each person then ordered a similar drink and a similar meal.The times (in minutes)until the food arrived at the table was recorded.They are shown below. The hypotheses being tested are H0: = 0 versus Ha: > 0,where represents the mean of the differences in service time (men - women).Assume that the differences are Normally distributed.What can you say about the value of the P-value?
A)P-value < 0.025
B)0.025 < P-value < 0.05
C)0.05 < P-value < 0.10
D)P-value > 0.10
The hypotheses being tested are H0: = 0 versus Ha: > 0,where represents the mean of the differences in service time (men - women).Assume that the differences are Normally distributed.What can you say about the value of the P-value?A)P-value < 0.025
B)0.025 < P-value < 0.05
C)0.05 < P-value < 0.10
D)P-value > 0.10
فتح الحزمة
افتح القفل للوصول البطاقات البالغ عددها 103 في هذه المجموعة.
فتح الحزمة
k this deck
24
A test of significance is to be carried out on the H0: = 36 against the Ha: < 36,based on data from an SRS selected from a Normally distributed population variable.It was decided to use a level of significance of = 0.02 to decide whether or not to reject the null hypothesis.The sample data produced a standard deviation of s = 15.6 based on 12 sample values.What values of would lead to the rejection of H0?
A) > 46.5
B) < 26.7
C) < 25.5
D) > 45.3
E)This can't be determined with the information provided.
would lead to the rejection of H0?A)
> 46.5B)
< 26.7C)
< 25.5D)
> 45.3E)This can't be determined with the information provided.
فتح الحزمة
افتح القفل للوصول البطاقات البالغ عددها 103 في هذه المجموعة.
فتح الحزمة
k this deck
25
We are interested in testing a null hypothesis about a population mean being equal to a specified value using a simple random sample of size 25.In the past the population variable has shown a slight tendency to non-Normality (slight skewness but no strong outliers).Why can we safely use a t procedure in this testing situation?
A)The sample standard deviation is robust against such things as outliers.
B)The one-sample t procedure requires that the sample be selected using an SRS design,which is what was done in this case.
C)The t procedures are quite robust against non-Normality,unless there are strong outliers.
D)All of the above are reasons.
E)Only B and C are justifications for using the t procedure here.
فتح الحزمة
افتح القفل للوصول البطاقات البالغ عددها 103 في هذه المجموعة.
فتح الحزمة
k this deck
26
Ten couples are participating in a small study on cholesterol.Neither the man nor the woman in each couple is known to have any problems with high cholesterol.The researcher conducting the study wishes to use the sign test for matched pairs to determine if there is evidence that the cholesterol level for the husband tends to be higher than the cholesterol level for the wife.The cholesterol measurements for the 10 couples are given below. What is the (approximate)value of the P-value?
A)0.039
B)0.055
C)0.079
D)0.172
What is the (approximate)value of the P-value?A)0.039
B)0.055
C)0.079
D)0.172
فتح الحزمة
افتح القفل للوصول البطاقات البالغ عددها 103 في هذه المجموعة.
فتح الحزمة
k this deck
27
A one-sample t test of H0: = 125 against Ha: > 125 is carried out based on sample data from a Normal population.The SRS of size n = 15 produced a mean of = 132.8 and s = 12.6.What is the value of the appropriate test statistic?
A)z = 2.40
B)t = 2.32
C)t = 2.40
D)z = 2.32
E)t = 1.76
= 132.8 and s = 12.6.What is the value of the appropriate test statistic?A)z = 2.40
B)t = 2.32
C)t = 2.40
D)z = 2.32
E)t = 1.76
فتح الحزمة
افتح القفل للوصول البطاقات البالغ عددها 103 في هذه المجموعة.
فتح الحزمة
k this deck
28
Ten couples are participating in a small study on cholesterol.Neither the man nor the woman in each couple is known to have any problems with high cholesterol.The researcher conducting the study wishes to use the sign test for matched pairs to determine if there is evidence that the cholesterol level for the husband tends to be higher than the cholesterol level for the wife.The cholesterol measurements for the 10 couples are given below. What are the hypotheses the researcher wishes to test?
A)H0: = 0 versus Ha: > 0,where = the mean of the differences in cholesterol levels (husband - wife)for all couples without cholesterol problems
B)H0: p = 1/2 versus Ha: p 1/2,where p = the proportion of cholesterol levels of the husband that are higher than those of the wife
C)H0: p = 1/2 versus Ha: p < 1/2,where p = the proportion of cholesterol levels of the husband that are higher than those of the wife
D)H0: population median = 0 versus Ha: population median > 0,where the differences for which the median is calculated are measured as husband - wife
What are the hypotheses the researcher wishes to test? A)H0: = 0 versus Ha: > 0,where = the mean of the differences in cholesterol levels (husband - wife)for all couples without cholesterol problems
B)H0: p = 1/2 versus Ha: p 1/2,where p = the proportion of cholesterol levels of the husband that are higher than those of the wife
C)H0: p = 1/2 versus Ha: p < 1/2,where p = the proportion of cholesterol levels of the husband that are higher than those of the wife
D)H0: population median = 0 versus Ha: population median > 0,where the differences for which the median is calculated are measured as husband - wife
فتح الحزمة
افتح القفل للوصول البطاقات البالغ عددها 103 في هذه المجموعة.
فتح الحزمة
k this deck
29
A study was conducted to determine if taking a popularly advertised herbal supplement will result in weight loss in obese males.A random sample of clinically obese males was obtained.Each subject was weighed before taking the supplement and again after 60 days using the supplement.Subjects were told not to alter their diet in any way during the study period.The following table shows the observed results for the six subjects. What are the appropriate hypotheses to use in this case to determine if the herbal supplement is effective in achieving weight loss in obese males?
A)H0: = 0 and Ha:
0
B)H0: = 0 and Ha:
0
C)H0: = 0 and Ha:
< 0
D)H0: = 0 and Ha:
> 0
E)H0: = 0 and Ha:
> 0
What are the appropriate hypotheses to use in this case to determine if the herbal supplement is effective in achieving weight loss in obese males?A)H0:
= 0 and Ha: 0B)H0:
= 0 and Ha: 0C)H0:
= 0 and Ha: < 0D)H0:
= 0 and Ha: > 0E)H0:
= 0 and Ha: > 0 فتح الحزمة
افتح القفل للوصول البطاقات البالغ عددها 103 في هذه المجموعة.
فتح الحزمة
k this deck
30
Do students tend to improve their SAT Mathematics (SAT-M)scores the second time they take the test? A random sample of four students who took the test twice received the following scores. Assume that the change in SAT-M score (second score - first score)for the population of all students taking the test twice is Normally distributed.What is a 90% confidence interval for ,the mean change in SAT-M score?
A)(-8.24,58.24)
B)(-18.08,68.08)
C)(-22.56,72.56)
D)(-39.31,89.31)
Assume that the change in SAT-M score (second score - first score)for the population of all students taking the test twice is Normally distributed.What is a 90% confidence interval for ,the mean change in SAT-M score?A)(-8.24,58.24)
B)(-18.08,68.08)
C)(-22.56,72.56)
D)(-39.31,89.31)
فتح الحزمة
افتح القفل للوصول البطاقات البالغ عددها 103 في هذه المجموعة.
فتح الحزمة
k this deck
31
A study was to be undertaken to determine if a particular training program would improve physical fitness.An SRS of 31 university students was selected to be enrolled in the fitness program.One important measure of fitness is maximum oxygen uptake.Measurements of oxygen uptake in untrained individuals are known to follow a Normal distribution with a mean of = 45 mL/kg/min.The researchers wished to determine if there was evidence that their sample of students differed from the general population of untrained subjects.The measurements made on the subjects coming into this study produced a mean of = 47.4 mL/kg/min with a standard deviation of s = 5.3 mL/kg/min.What is the appropriate alternative hypothesis in this situation?
A)Ha: > 45
B)Ha: < 45
C)Ha: 45
D)Ha: 45
E)Ha: > 45
= 47.4 mL/kg/min with a standard deviation of s = 5.3 mL/kg/min.What is the appropriate alternative hypothesis in this situation?A)Ha:
> 45B)Ha: < 45
C)Ha: 45
D)Ha:
45E)Ha: > 45
فتح الحزمة
افتح القفل للوصول البطاقات البالغ عددها 103 في هذه المجموعة.
فتح الحزمة
k this deck
32
A study was to be undertaken to determine if a particular training program would improve physical fitness.An SRS of 31 university students was selected to be enrolled in the fitness program.One important measure of fitness is maximum oxygen uptake.Measurements of oxygen uptake in untrained individuals are known to follow a Normal distribution with a mean of = 45 mL/kg/min.The researchers wished to determine if there was evidence that their sample of students differed from the general population of untrained subjects.The measurements made on the subjects coming into this study produced a mean of = 47.4 mL/kg/min with a standard deviation of s = 5.3 mL/kg/min.What is the approximate P-value for the test?
A)P < 0.005
B)0.005 < P < 0.01
C)0.01 < P < 0.02
D)P > 0.02
E)P = 0.0118
= 47.4 mL/kg/min with a standard deviation of s = 5.3 mL/kg/min.What is the approximate P-value for the test?A)P < 0.005
B)0.005 < P < 0.01
C)0.01 < P < 0.02
D)P > 0.02
E)P = 0.0118
فتح الحزمة
افتح القفل للوصول البطاقات البالغ عددها 103 في هذه المجموعة.
فتح الحزمة
k this deck
33
A one-sample t test of H0: = 125 against Ha: > 125 is carried out based on sample data from a Normal population.The SRS of size n = 15 produced a mean of = 132.8 and s = 12.6.What is the P-value of the test in this situation?
A)P = 0.008
B)P > 0.02
C)0.02 < P < 0.04
D)0.01 < P < 0.02
E)0.02 < P < 0.025
= 132.8 and s = 12.6.What is the P-value of the test in this situation?A)P = 0.008
B)P > 0.02
C)0.02 < P < 0.04
D)0.01 < P < 0.02
E)0.02 < P < 0.025
فتح الحزمة
افتح القفل للوصول البطاقات البالغ عددها 103 في هذه المجموعة.
فتح الحزمة
k this deck
34
Twelve runners are asked to run a 10-kilometer race on each of two consecutive weeks.In one of the races,the runners wear one brand of shoe and in the other,a different brand.The brand of shoe they wear in each race is determined at random.All runners are timed and are asked to run their best in each race.The results (in minutes)are given below. Use the sign test for matched pairs to determine if there is evidence that times using Brand 1 tend to be faster than times using Brand 2.Determine which of the following statements is TRUE.
A)We would not reject the null hypothesis of no difference at the 0.10 level.
B)We would reject the null hypothesis of no difference at the 0.10 level but not at the 0.05 level.
C)We would reject the null hypothesis of no difference at the 0.05 level but not at the 0.01 level.
D)We would reject the null hypothesis of no difference at the 0.01 level.
Use the sign test for matched pairs to determine if there is evidence that times using Brand 1 tend to be faster than times using Brand 2.Determine which of the following statements is TRUE.A)We would not reject the null hypothesis of no difference at the 0.10 level.
B)We would reject the null hypothesis of no difference at the 0.10 level but not at the 0.05 level.
C)We would reject the null hypothesis of no difference at the 0.05 level but not at the 0.01 level.
D)We would reject the null hypothesis of no difference at the 0.01 level.
فتح الحزمة
افتح القفل للوصول البطاقات البالغ عددها 103 في هذه المجموعة.
فتح الحزمة
k this deck
35
A study was to be undertaken to determine if a particular training program would improve physical fitness.An SRS of 31 university students was selected to be enrolled in the fitness program.One important measure of fitness is maximum oxygen uptake.Measurements of oxygen uptake in untrained individuals are known to follow a Normal distribution with a mean of = 45 mL/kg/min.The researchers wished to determine if there was evidence that their sample of students differed from the general population of untrained subjects.The measurements made on the subjects coming into this study produced a mean of = 47.4 mL/kg/min with a standard deviation of s = 5.3 mL/kg/min.Suppose the 98% confidence interval were determined to be (45.2,49.6)an interval.If the level of confidence were changed to 95%,what would happen to the confidence interval and the P-value?
A)The confidence interval would become longer and the P-value would decrease.
B)The confidence interval would become shorter and the P-value would increase.
C)The confidence interval would not change and the P-value also would not change.
D)The confidence interval would become shorter and the P-value would decrease.
E)The confidence interval would become shorter but the P-value would not change.
= 47.4 mL/kg/min with a standard deviation of s = 5.3 mL/kg/min.Suppose the 98% confidence interval were determined to be (45.2,49.6)an interval.If the level of confidence were changed to 95%,what would happen to the confidence interval and the P-value?A)The confidence interval would become longer and the P-value would decrease.
B)The confidence interval would become shorter and the P-value would increase.
C)The confidence interval would not change and the P-value also would not change.
D)The confidence interval would become shorter and the P-value would decrease.
E)The confidence interval would become shorter but the P-value would not change.
فتح الحزمة
افتح القفل للوصول البطاقات البالغ عددها 103 في هذه المجموعة.
فتح الحزمة
k this deck
36
A random sample of 20 observations produced a sample mean of = 92.4 and s = 25.8.What is the value of the standard error of ?
A)4.6
B)15.9
C)1.3
D)5.8
E)2.6
= 92.4 and s = 25.8.What is the value of the standard error of ?A)4.6
B)15.9
C)1.3
D)5.8
E)2.6
فتح الحزمة
افتح القفل للوصول البطاقات البالغ عددها 103 في هذه المجموعة.
فتح الحزمة
k this deck
37
Twelve runners are asked to run a 10-kilometer race on each of two consecutive weeks.In one of the races,the runners wear one brand of shoe and in the other,a different brand.The brand of shoe they wear in each race is determined at random.All runners are timed and are asked to run their best in each race.The results (in minutes)are given below. Use the sign test for matched pairs to determine if there is evidence that times using Brand 1 tend to be faster than times using Brand 2.What is the (approximate)value of the P-value?
A)0.019
B)0.042
C)0.05
D)0.073
Use the sign test for matched pairs to determine if there is evidence that times using Brand 1 tend to be faster than times using Brand 2.What is the (approximate)value of the P-value?A)0.019
B)0.042
C)0.05
D)0.073
فتح الحزمة
افتح القفل للوصول البطاقات البالغ عددها 103 في هذه المجموعة.
فتح الحزمة
k this deck
38
Twelve runners are asked to run a 10-kilometer race on each of two consecutive weeks.In one of the races,the runners wear one brand of shoe and in the other,a different brand.The brand of shoe they wear in each race is determined at random.All runners are timed and are asked to run their best in each race.The results (in minutes)are given below. Use the sign test for matched pairs to determine if there is evidence that times using Brand 1 tend to be faster than times using Brand 2.What are the hypotheses we wish to test?
A)H0: = 0 versus Ha: > 0,where = the mean of the differences in running times (Brand 2 - Brand 1)for all runners who run this race twice wearing the two brands of shoes
B)H0: p = 1/2 versus Ha: p 1/2,where p = the proportion of running times using Brand 1 that are faster than times using Brand 2
C)H0: p = 1/2 versus Ha: p > 1/2,where p = the proportion of running times using Brand 1 that are faster than times using Brand 2
D)H0: population median = 0 versus Ha: population median 0,where the median of the differences in running times for all runners who run this race twice wearing the two brands of shoes is measured for Brand 2 - Brand 1
Use the sign test for matched pairs to determine if there is evidence that times using Brand 1 tend to be faster than times using Brand 2.What are the hypotheses we wish to test?A)H0: = 0 versus Ha: > 0,where = the mean of the differences in running times (Brand 2 - Brand 1)for all runners who run this race twice wearing the two brands of shoes
B)H0: p = 1/2 versus Ha: p 1/2,where p = the proportion of running times using Brand 1 that are faster than times using Brand 2
C)H0: p = 1/2 versus Ha: p > 1/2,where p = the proportion of running times using Brand 1 that are faster than times using Brand 2
D)H0: population median = 0 versus Ha: population median 0,where the median of the differences in running times for all runners who run this race twice wearing the two brands of shoes is measured for Brand 2 - Brand 1
فتح الحزمة
افتح القفل للوصول البطاقات البالغ عددها 103 في هذه المجموعة.
فتح الحزمة
k this deck
39
Do students tend to improve their SAT Mathematics (SAT-M)scores the second time they take the test? A random sample of four students who took the test twice received the following scores. Assume that the change in SAT-M score (second score - first score)for the population of all students taking the test twice is Normally distributed.Suppose we do not believe that students tend to improve their SAT-M scores the second time they take the test.Based on a 90% confidence interval,we wish to test H0: = 0 versus Ha: 0 at the 5% significance level.Determine which of the following statements is true.
A)We cannot make a decision since the confidence interval is so wide.
B)We cannot make a decision since the confidence level we used to calculate the confidence interval is 90%,and we would need a 95% confidence interval.
C)We accept H0 since the value 0 falls in the 90% confidence interval and would therefore also fall in the 95% confidence interval.
D)We reject H0 since the value 0 falls in the 90% confidence interval.
Assume that the change in SAT-M score (second score - first score)for the population of all students taking the test twice is Normally distributed.Suppose we do not believe that students tend to improve their SAT-M scores the second time they take the test.Based on a 90% confidence interval,we wish to test H0: = 0 versus Ha: 0 at the 5% significance level.Determine which of the following statements is true.A)We cannot make a decision since the confidence interval is so wide.
B)We cannot make a decision since the confidence level we used to calculate the confidence interval is 90%,and we would need a 95% confidence interval.
C)We accept H0 since the value 0 falls in the 90% confidence interval and would therefore also fall in the 95% confidence interval.
D)We reject H0 since the value 0 falls in the 90% confidence interval.
فتح الحزمة
افتح القفل للوصول البطاقات البالغ عددها 103 في هذه المجموعة.
فتح الحزمة
k this deck
40
A study was to be undertaken to determine if a particular training program would improve physical fitness.An SRS of 31 university students was selected to be enrolled in the fitness program.One important measure of fitness is maximum oxygen uptake.Measurements of oxygen uptake in untrained individuals are known to follow a Normal distribution with a mean of = 45 mL/kg/min.The researchers wished to determine if there was evidence that their sample of students differed from the general population of untrained subjects.The measurements made on the subjects coming into this study produced a mean of = 47.4 mL/kg/min with a standard deviation of s = 5.3 mL/kg/min.Based on these data,what is the 98% confidence interval estimate for the mean oxygen uptake for the population from which the sample of students was selected?
A)47.4 ± 2.147 ( )
B)47.4 ± 2.054 ( )
C)47.4 ± 2.457 ( )
D)47.4 ± 2.147 ( )
E)47.4 ± 2.457 ( )
= 47.4 mL/kg/min with a standard deviation of s = 5.3 mL/kg/min.Based on these data,what is the 98% confidence interval estimate for the mean oxygen uptake for the population from which the sample of students was selected?A)47.4 ± 2.147 (
)B)47.4 ± 2.054 (
)C)47.4 ± 2.457 (
)D)47.4 ± 2.147 (
)E)47.4 ± 2.457 (
) فتح الحزمة
افتح القفل للوصول البطاقات البالغ عددها 103 في هذه المجموعة.
فتح الحزمة
k this deck
41
Robustness refers to how sensitive probability calculations are when assumptions are not met.
فتح الحزمة
افتح القفل للوصول البطاقات البالغ عددها 103 في هذه المجموعة.
فتح الحزمة
k this deck
42
The sign test is more powerful than the t test.
فتح الحزمة
افتح القفل للوصول البطاقات البالغ عددها 103 في هذه المجموعة.
فتح الحزمة
k this deck
43
The probability calculations from a t procedure are valid if there are outliers in the data as long as the sample size is large and the data are Normal.
فتح الحزمة
افتح القفل للوصول البطاقات البالغ عددها 103 في هذه المجموعة.
فتح الحزمة
k this deck
44
Suppose we were interested in determining if there were differences in the average prices among two local supermarkets.We randomly pick six items to compare at both supermarkets.Which statistical procedure would be best to use for this study?
A)Matched-pairs t procedure
B)One-sample t test
C)Two-sample t test
D)None of the above
A)Matched-pairs t procedure
B)One-sample t test
C)Two-sample t test
D)None of the above
فتح الحزمة
افتح القفل للوصول البطاقات البالغ عددها 103 في هذه المجموعة.
فتح الحزمة
k this deck
45
P-values for the sign test for matched pairs are calculated using which distribution? (Note: n is the number of trials where the difference is not zero. )
A)t(n)
B)N(0,1)
C)B(n,1/2)
D)None of the above
A)t(n)
B)N(0,1)
C)B(n,1/2)
D)None of the above
فتح الحزمة
افتح القفل للوصول البطاقات البالغ عددها 103 في هذه المجموعة.
فتح الحزمة
k this deck
46
When the sample size is very large,the corresponding t distribution is very close to the normal distribution.
فتح الحزمة
افتح القفل للوصول البطاقات البالغ عددها 103 في هذه المجموعة.
فتح الحزمة
k this deck
47
When calculating a one-sample t confidence interval,which level of confidence will give the smallest interval?
A)80%
B)90%
C)95%
D)100%
A)80%
B)90%
C)95%
D)100%
فتح الحزمة
افتح القفل للوصول البطاقات البالغ عددها 103 في هذه المجموعة.
فتح الحزمة
k this deck
48
One-sample t test procedures are for use on subjects that are _______.
A)independent
B)the same or similar
C)binomial
D)None of the above
A)independent
B)the same or similar
C)binomial
D)None of the above
فتح الحزمة
افتح القفل للوصول البطاقات البالغ عددها 103 في هذه المجموعة.
فتح الحزمة
k this deck
49
A simple random sample should be used for the t procedure when the sample size is small.
فتح الحزمة
افتح القفل للوصول البطاقات البالغ عددها 103 في هذه المجموعة.
فتح الحزمة
k this deck
50
When calculating a one-sample t confidence interval,which level of confidence will give the largest interval?
A)80%
B)90%
C)95%
D)100%
A)80%
B)90%
C)95%
D)100%
فتح الحزمة
افتح القفل للوصول البطاقات البالغ عددها 103 في هذه المجموعة.
فتح الحزمة
k this deck
51
Which of the following is not a requirement for using the matched-pairs t procedure?
A)Subjects/experimental units are the same or similar.
B)Data are the difference between two measurements.
C)One-sample t procedures are applied to the differences of the two measurements/observations.
D)Measurements are taken on completely independent subjects.
A)Subjects/experimental units are the same or similar.
B)Data are the difference between two measurements.
C)One-sample t procedures are applied to the differences of the two measurements/observations.
D)Measurements are taken on completely independent subjects.
فتح الحزمة
افتح القفل للوصول البطاقات البالغ عددها 103 في هذه المجموعة.
فتح الحزمة
k this deck
52
Suppose a simple random sample size of n is drawn from an appropriately normal population.What degrees of freedom should be used to perform a one sample t procedure?
A)n-1
B)n+1
C)n-2
D)n+2
A)n-1
B)n+1
C)n-2
D)n+2
فتح الحزمة
افتح القفل للوصول البطاقات البالغ عددها 103 في هذه المجموعة.
فتح الحزمة
k this deck
53
A study was conducted to determine if taking a popularly advertised herbal supplement will result in weight loss in obese males.A random sample of clinically obese males was obtained.Each subject was weighed before taking the supplement and again after 60 days using the supplement.Subjects were told not to alter their diet in any way during the study period.The following table shows the observed results for the six subjects. With = 0.05,what observed values of the test statistic would cause the sample results to be declared statistically significant?
A)z > 1.645
B)t > 2.015
C)t > 1.796
D)z > 1.960
E)| t | > 2.571
With = 0.05,what observed values of the test statistic would cause the sample results to be declared statistically significant?A)z > 1.645
B)t > 2.015
C)t > 1.796
D)z > 1.960
E)| t | > 2.571
فتح الحزمة
افتح القفل للوصول البطاقات البالغ عددها 103 في هذه المجموعة.
فتح الحزمة
k this deck
54
When performing a t procedure,it is best to look at the data first and then determine if you should do a one-sided or two-sided test.
فتح الحزمة
افتح القفل للوصول البطاقات البالغ عددها 103 في هذه المجموعة.
فتح الحزمة
k this deck
55
When the underlying assumptions for the use of t procedures are not exactly met,the probability calculations are still valid as long as the data are very close to Normal.
فتح الحزمة
افتح القفل للوصول البطاقات البالغ عددها 103 في هذه المجموعة.
فتح الحزمة
k this deck
56
Researchers have selected a simple random sample of size n = 12 from a population for the purpose of testing the null hypothesis H0: = 0 against the alternative hypothesis Ha: > 0.Studies indicate that a substantial degree of skewness can be expected in the population from which the sample was obtained.What might the researchers consider doing in this situation?
A)There really isn't anything they can do;they simply have to proceed with what the data give them.
B)They might proceed as usual but alter the P-value later to compensate for the skewness in their data.
C)They might use a test procedure that doesn't require Normality,such as a sign test using the median.
D)They might apply a transformation to the data,such as a logarithm,to try to achieve symmetry.
E)C and D are each possible approaches they might consider using.
فتح الحزمة
افتح القفل للوصول البطاقات البالغ عددها 103 في هذه المجموعة.
فتح الحزمة
k this deck
57
The t procedures will be exact when the sample size is very large.
فتح الحزمة
افتح القفل للوصول البطاقات البالغ عددها 103 في هذه المجموعة.
فتح الحزمة
k this deck
58
Matched-pairs t procedures are for use on subjects that are _______.
A)independent
B)the same or similar
C)Normal
D)None of the above
A)independent
B)the same or similar
C)Normal
D)None of the above
فتح الحزمة
افتح القفل للوصول البطاقات البالغ عددها 103 في هذه المجموعة.
فتح الحزمة
k this deck
59
Assume that sample data,based on two independent samples of size 25,give us = 505, = 515,s1 = 23,and s2 = 28.What is a 95% confidence interval (use the conservative value for the degrees of freedom)for 2 - 1?
A)(-2.40,22.40)
B)(-4.57,24.57)
C)(-4.96,24.96)
D)(5.79,14.21)
= 505, = 515,s1 = 23,and s2 = 28.What is a 95% confidence interval (use the conservative value for the degrees of freedom)for 2 - 1?A)(-2.40,22.40)
B)(-4.57,24.57)
C)(-4.96,24.96)
D)(5.79,14.21)
فتح الحزمة
افتح القفل للوصول البطاقات البالغ عددها 103 في هذه المجموعة.
فتح الحزمة
k this deck
60
If the data are not normal and you wish to use a t procedure,one option is to __________.
A)transform the data
B)truncate the data
C)randomly remove some of the data
D)None of the above
A)transform the data
B)truncate the data
C)randomly remove some of the data
D)None of the above
فتح الحزمة
افتح القفل للوصول البطاقات البالغ عددها 103 في هذه المجموعة.
فتح الحزمة
k this deck
61
The t distribution has properties similar to the _____ distribution.
A)Normal
B)F
C)Uniform
D)None of the above
A)Normal
B)F
C)Uniform
D)None of the above
فتح الحزمة
افتح القفل للوصول البطاقات البالغ عددها 103 في هذه المجموعة.
فتح الحزمة
k this deck
62
Suppose you are interested in determining if the average amount of money that students spend on food at your university per day is greater than $30.You randomly choose 25 students from your campus and calculate that the mean amount of money spent per day is $18.01 with a standard deviation of $2.22.Would you use a one-sided or two-sided test for this problem?
A)One-sided
B)Two-sided
A)One-sided
B)Two-sided
فتح الحزمة
افتح القفل للوصول البطاقات البالغ عددها 103 في هذه المجموعة.
فتح الحزمة
k this deck
63
Suppose you are interested in determining if the average amount of money that students spend on food at your university per day is greater than $30.You randomly choose 25 students from your campus and calculate that the mean amount of money spent per day is $18.01 with a standard deviation of $2.22.What are the degrees of freedom for the one-sample t statistic?
A)26
B)25
C)24
D)23
A)26
B)25
C)24
D)23
فتح الحزمة
افتح القفل للوصول البطاقات البالغ عددها 103 في هذه المجموعة.
فتح الحزمة
k this deck
64
Which of the following cannot be used to check the assumptions for the t procedure?
A)Normal quantile plot
B)Stemplot
C)Boxplot
D)All of the above can be used.
A)Normal quantile plot
B)Stemplot
C)Boxplot
D)All of the above can be used.
فتح الحزمة
افتح القفل للوصول البطاقات البالغ عددها 103 في هذه المجموعة.
فتح الحزمة
k this deck
65
Distribution-free procedures are often called _____.
A)t procedures
B)non-Normal procedures
C)nonparametric procedures
D)None of the above
A)t procedures
B)non-Normal procedures
C)nonparametric procedures
D)None of the above
فتح الحزمة
افتح القفل للوصول البطاقات البالغ عددها 103 في هذه المجموعة.
فتح الحزمة
k this deck
66
Suppose you have an SRS of size n that is drawn from a population that is Normal with a mean of and a standard deviation of .The one-sample t statistic will have what distribution?
A)Normal
B)t
C)F
D)Uniform
A)Normal
B)t
C)F
D)Uniform
فتح الحزمة
افتح القفل للوصول البطاقات البالغ عددها 103 في هذه المجموعة.
فتح الحزمة
k this deck
67
You are interested in determining if the average amount of time (in hours)that students spend on the Internet per day is greater than 2 hours.The data below are from a random sample of 11 students. What is the value of the t statistic after removing the second observation (value = 100)?
A)6.65
B)1.43
C)0
D)None of the above
What is the value of the t statistic after removing the second observation (value = 100)?A)6.65
B)1.43
C)0
D)None of the above
فتح الحزمة
افتح القفل للوصول البطاقات البالغ عددها 103 في هذه المجموعة.
فتح الحزمة
k this deck
68
You are interested in determining if the average amount of time (in hours)that students spend on the Internet per day is greater than 2 hours.The data below are from a random sample of 11 students. What did you notice from your preliminary analysis of the data?
A)The data were not approximately normal.
B)There are outliers.
C)The data are normal.
D)A and B are both correct.
What did you notice from your preliminary analysis of the data?A)The data were not approximately normal.
B)There are outliers.
C)The data are normal.
D)A and B are both correct.
فتح الحزمة
افتح القفل للوصول البطاقات البالغ عددها 103 في هذه المجموعة.
فتح الحزمة
k this deck
69
What assumption is necessary in order to perform a t procedure?
A)The data are normal.
B)The data are approximately normal.
C)The data are uniform.
D)None of the above
A)The data are normal.
B)The data are approximately normal.
C)The data are uniform.
D)None of the above
فتح الحزمة
افتح القفل للوصول البطاقات البالغ عددها 103 في هذه المجموعة.
فتح الحزمة
k this deck
70
You are interested in determining if the average amount of time (in hours)that students spend on the Internet per day is greater than 2 hours.The data below are from a random sample of 11 students. If we remove the second observation (value = 100),we could test the hypothesis using a ____ .
A)z statistic
B)t statistic
If we remove the second observation (value = 100),we could test the hypothesis using a ____ .A)z statistic
B)t statistic
فتح الحزمة
افتح القفل للوصول البطاقات البالغ عددها 103 في هذه المجموعة.
فتح الحزمة
k this deck
71
The one-sample z statistic is used instead of the one-sample t statistic when ______.
A) is known
B) is unknown
C) is known
D) is unknown
A) is known
B) is unknown
C) is known
D) is unknown
فتح الحزمة
افتح القفل للوصول البطاقات البالغ عددها 103 في هذه المجموعة.
فتح الحزمة
k this deck
72
You are interested in determining if the average amount of time (in hours)that students spend on the Internet per day is greater than 2 hours.The data below are from a random sample of 11 students. Would the null hypothesis be rejected at the .05 significance level after removing the second observation (value = 100)?
A)Yes,because the P-value is greater than .05.
B)Yes,because the P-value is less than .05.
C)No,because the P-value is greater than .05.
D)No,because the P-value is less than .05.
Would the null hypothesis be rejected at the .05 significance level after removing the second observation (value = 100)?A)Yes,because the P-value is greater than .05.
B)Yes,because the P-value is less than .05.
C)No,because the P-value is greater than .05.
D)No,because the P-value is less than .05.
فتح الحزمة
افتح القفل للوصول البطاقات البالغ عددها 103 في هذه المجموعة.
فتح الحزمة
k this deck
73
You are interested in determining if the average amount of time (in hours)that students spend on the Internet per day is greater than 2 hours.The data below are from a random sample of 11 students. What is the standard error of the mean?
A)29.4
B)8.86
C)11.4
D)None of the above
What is the standard error of the mean?A)29.4
B)8.86
C)11.4
D)None of the above
فتح الحزمة
افتح القفل للوصول البطاقات البالغ عددها 103 في هذه المجموعة.
فتح الحزمة
k this deck
74
Suppose you are interested in determining if the average amount of money that students spend on food at your university per day is greater than $30.You randomly choose 25 students from your campus and calculate that the mean amount of money spent per day is $18.01 with a standard deviation of $2.22.What is the standard error of the mean?
A).44
B)0
C)18.01
D)None of the above
A).44
B)0
C)18.01
D)None of the above
فتح الحزمة
افتح القفل للوصول البطاقات البالغ عددها 103 في هذه المجموعة.
فتح الحزمة
k this deck
75
You are interested in determining if the average amount of time (in hours)that students spend on the Internet per day is greater than 2 hours.The data below are from a random sample of 11 students. Suppose you were to remove the second observation (value = 100),would a t procedure be appropriate for these data?
A)No,the data set would be too small.
B)No,you cannot remove data.
C)Yes,the assumptions would be reasonably met.
D)Yes,smaller data sets are better for t procedures.
Suppose you were to remove the second observation (value = 100),would a t procedure be appropriate for these data?A)No,the data set would be too small.
B)No,you cannot remove data.
C)Yes,the assumptions would be reasonably met.
D)Yes,smaller data sets are better for t procedures.
فتح الحزمة
افتح القفل للوصول البطاقات البالغ عددها 103 في هذه المجموعة.
فتح الحزمة
k this deck
76
You are interested in determining if the average amount of time (in hours)that students spend on the Internet per day is greater than 2 hours.The data below are from a random sample of 11 students. What are the number of degrees of freedom after removing the second observation (value = 100)?
A)11
B)10
C)9
D)8
What are the number of degrees of freedom after removing the second observation (value = 100)?A)11
B)10
C)9
D)8
فتح الحزمة
افتح القفل للوصول البطاقات البالغ عددها 103 في هذه المجموعة.
فتح الحزمة
k this deck
77
The P-values for a one-sided hypothesis test are generally _____ the P-values for the two-sided hypothesis test on the same data.
A)smaller than
B)larger than
C)the same as
A)smaller than
B)larger than
C)the same as
فتح الحزمة
افتح القفل للوصول البطاقات البالغ عددها 103 في هذه المجموعة.
فتح الحزمة
k this deck
78
The standard deviation of a statistic is known as the ________.
A)standard error
B)mean
C)standard mean
D)standard estimate
A)standard error
B)mean
C)standard mean
D)standard estimate
فتح الحزمة
افتح القفل للوصول البطاقات البالغ عددها 103 في هذه المجموعة.
فتح الحزمة
k this deck
79
You are interested in determining if the average amount of time (in hours)that students spend on the Internet per day is greater than 2 hours.The data below are from a random sample of 11 students. The alternative hypothesis for this problem is ______.
A)one sided
B)two sided
C)three sided
D)four sided
The alternative hypothesis for this problem is ______.A)one sided
B)two sided
C)three sided
D)four sided
فتح الحزمة
افتح القفل للوصول البطاقات البالغ عددها 103 في هذه المجموعة.
فتح الحزمة
k this deck
80
You are interested in determining if the average amount of time (in hours)that students spend on the Internet per day is greater than 2 hours.The data below are from a random sample of 11 students. Would a t procedure be appropriate for these data?
A)Yes,the necessary assumptions have been met for a t procedure
B)No,the necessary assumptions have not been met for a t procedure
Would a t procedure be appropriate for these data?A)Yes,the necessary assumptions have been met for a t procedure
B)No,the necessary assumptions have not been met for a t procedure
فتح الحزمة
افتح القفل للوصول البطاقات البالغ عددها 103 في هذه المجموعة.
فتح الحزمة
k this deck
فتح الحزمة
افتح القفل للوصول البطاقات البالغ عددها 103 في هذه المجموعة.


