Deck 12: One-Way Analysis of Variance
ملء الشاشة (f)
سؤال
سؤال
A storeowner wishes to compare the average amount of money high school and college students spend on music downloads.He randomly selects 10 students from three different student populations: high school,undergraduate,and graduate.The statistical assumptions required to perform a one-way ANOVA to compare the means of these three groups are reasonable based on the data.A partially completed ANOVA table is provided below.  What is the value of the F statistic?
A)3.36
B)3.73
C)5.04
D)5.99
What is the value of the F statistic?A)3.36
B)3.73
C)5.04
D)5.99
سؤال
A storeowner wishes to compare the average amount of money high school and college students spend on music downloads.He randomly selects 10 students from three different student populations: high school,undergraduate,and graduate.The statistical assumptions required to perform a one-way ANOVA to compare the means of these three groups are reasonable based on the data.A partially completed ANOVA table is provided below. 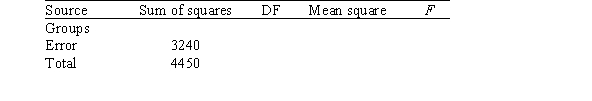 What is the value of the pooled standard deviation?
A)10.95
B)24.60
C)56.92
D)120
What is the value of the pooled standard deviation?A)10.95
B)24.60
C)56.92
D)120
سؤال
A realtor wishes to assess whether a difference exists between home prices in three subdivisions.Independent samples of homes from each of the three subdivisions are obtained and their prices are recorded.The analysis of variance results for comparing these prices are provided below.  How many homes were sampled in total?
A)15
B)17
C)18
D)19
How many homes were sampled in total?A)15
B)17
C)18
D)19
سؤال
A storeowner wishes to compare the average amount of money high school and college students spend on music downloads.He randomly selects 10 students from three different student populations: high school,undergraduate,and graduate.The statistical assumptions required to perform a one-way ANOVA to compare the means of these three groups are reasonable based on the data.A partially completed ANOVA table is provided below.  At the 1% significance level,would we reject the null hypothesis?
A)Yes
B)No
C)This cannot be determined from the information given.
At the 1% significance level,would we reject the null hypothesis?A)Yes
B)No
C)This cannot be determined from the information given.
سؤال
سؤال
A realtor wishes to assess whether a difference exists between home prices in three subdivisions.Independent samples of homes from each of the three subdivisions are obtained and their prices are recorded.The analysis of variance results for comparing these prices are provided below.  What can we say about the P-value for this F test?
A)P-value < 0.01
B)0.01 < P-value < 0.025
C)0.025 < P-value < 0.05
D)0.05 < P-value < 0.10
What can we say about the P-value for this F test?A)P-value < 0.01
B)0.01 < P-value < 0.025
C)0.025 < P-value < 0.05
D)0.05 < P-value < 0.10
سؤال
سؤال
سؤال
سؤال
In a study on scholastic test scores of entering college freshmen,a random sample of colleges across the nation is selected and the average SAT Math score for the freshman class is recorded.The colleges are categorized according to their affiliation: public,private,or church.Does it appear that freshmen entering the three different types of schools do equally well on the SAT Math? Computer output is included below.  How many colleges were included in the study?
A)3
B)63
C)65
D)66
How many colleges were included in the study?A)3
B)63
C)65
D)66
سؤال
In a study on scholastic test scores of entering college freshmen,a random sample of colleges across the nation is selected and the average SAT Math score for the freshman class is recorded.The colleges are categorized according to their affiliation: public,private,or church.Does it appear that freshmen entering the three different types of schools do equally well on the SAT Math? Computer output is included below.  Under the null hypothesis of equality of population means,what is the distribution of the test statistic?
A)F(2,63)
B)F(2,65)
C)N(0,3)
D)t(63)
Under the null hypothesis of equality of population means,what is the distribution of the test statistic?A)F(2,63)
B)F(2,65)
C)N(0,3)
D)t(63)
سؤال
سؤال
سؤال
A realtor wishes to assess whether a difference exists between home prices in three subdivisions.Independent samples of homes from each of the three subdivisions are obtained and their prices are recorded.The analysis of variance results for comparing these prices are provided below.  Under the null hypothesis of equality of population means,what is the appropriate distribution for the test statistic?
A)F(2,15)
B)F(2,17)
C)N( , )
D)t(15)
Under the null hypothesis of equality of population means,what is the appropriate distribution for the test statistic?A)F(2,15)
B)F(2,17)
C)N( , )
D)t(15)
سؤال
In a study on scholastic test scores of entering college freshmen,a random sample of colleges across the nation is selected and the average SAT Math score for the freshman class is recorded.The colleges are categorized according to their affiliation: public,private,or church.Does it appear that freshmen entering the three different types of schools do equally well on the SAT Math? Computer output is included below.  The value of the F statistic in the ANOVA table is reported as 5.696.The value of the corresponding P-value is 0.005.If we were to draw the F distribution and mark the value of 5.696 on the x axis,how would we indicate the P-value in the graph?
A)The area under the curve to the left of 5.696
B)The area under the curve to the right of 5.696
C)The area under the curve to the right of 5.696 and to the left of 0.176
D)This cannot be determined from the information given.
The value of the F statistic in the ANOVA table is reported as 5.696.The value of the corresponding P-value is 0.005.If we were to draw the F distribution and mark the value of 5.696 on the x axis,how would we indicate the P-value in the graph?A)The area under the curve to the left of 5.696
B)The area under the curve to the right of 5.696
C)The area under the curve to the right of 5.696 and to the left of 0.176
D)This cannot be determined from the information given.
سؤال
A storeowner wishes to compare the average amount of money high school and college students spend on music downloads.He randomly selects 10 students from three different student populations: high school,undergraduate,and graduate.The statistical assumptions required to perform a one-way ANOVA to compare the means of these three groups are reasonable based on the data.A partially completed ANOVA table is provided below.  What are the degrees of freedom for the F statistic?
A)2 and 10
B)2 and 27
C)3 and 27
D)3 and 30
What are the degrees of freedom for the F statistic?A)2 and 10
B)2 and 27
C)3 and 27
D)3 and 30
سؤال
A realtor wishes to assess whether a difference exists between home prices in three subdivisions.Independent samples of homes from each of the three subdivisions are obtained and their prices are recorded.The analysis of variance results for comparing these prices are provided below. 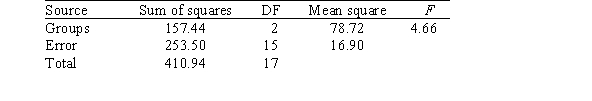 What is the value of the estimate of the common population standard deviation of the populations of home prices in the three subdivisions?
A)4.11
B)8.87
C)16.90
D)78.72
What is the value of the estimate of the common population standard deviation of the populations of home prices in the three subdivisions?A)4.11
B)8.87
C)16.90
D)78.72
سؤال
A realtor wishes to assess whether a difference exists between home prices in three subdivisions.Independent samples of homes from each of the three subdivisions are obtained and their prices are recorded.The analysis of variance results for comparing these prices are provided below.  Under the null hypothesis of equality of population means,what is the appropriate assumption for the distribution for home prices in the three populations?
A)F(2,15)
B)F(2,17)
C)N( , )
D)t(15)
Under the null hypothesis of equality of population means,what is the appropriate assumption for the distribution for home prices in the three populations?A)F(2,15)
B)F(2,17)
C)N( , )
D)t(15)
سؤال
سؤال
Which of the following statements about the one-way analysis of variance model and/or procedures is/are FALSE?
A)The ANOVA procedures are not extremely sensitive to unequal standard deviations.
B)As a general rule,if the largest standard deviation is less than twice the smallest standard deviation,the use of the ANOVA procedures assuming equal standard deviations will give results that are approximately correct.
C)Under the null hypothesis,H0: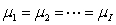
,the statistic

Has the F(I - 1,N - I)distribution.
D)The P-value of the F test is two times the probability that a random variable having the F(I - 1,N - I)distribution is greater than or equal to the calculated value of the F statistic.
E)The observations in the experiment or samples must be Normally distributed.
A)The ANOVA procedures are not extremely sensitive to unequal standard deviations.
B)As a general rule,if the largest standard deviation is less than twice the smallest standard deviation,the use of the ANOVA procedures assuming equal standard deviations will give results that are approximately correct.
C)Under the null hypothesis,H0:
,the statistic
Has the F(I - 1,N - I)distribution.
D)The P-value of the F test is two times the probability that a random variable having the F(I - 1,N - I)distribution is greater than or equal to the calculated value of the F statistic.
E)The observations in the experiment or samples must be Normally distributed.
سؤال
Wild horse populations on federal lands have been protected since 1971.Since that time,the populations have grown large and need to be managed and kept to a supportable size.Management of the mustang population has been a controversial issue;one common method is periodic removal of the horses.Researchers were curious if a new method would work better.In 1985,12 horses were rounded up and male horses in the group of 12 were treated.The number of foals in each group of 12 horses for 3 years was recorded.Year 1 was prior to treatment,year 2 was the year the treatment was applied,and year 3 was 1 year after treatment.The average number of foals per group along with the standard deviation is given in the table below. 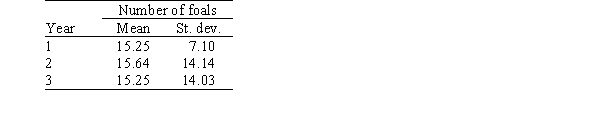 The researchers did an ANOVA F test of the data and obtained the following results.
  For this example,which of the following conclusions is most reasonable?
A)There is moderate evidence that the treatment is effective in reducing herd size for about 1 year,but then the effect appears to wear off.
B)An ANOVA F test is not appropriate for these data.The assumptions needed for the F test to be valid are not all satisfied.
C)The data provide strong evidence that the mean number of foals for the populations represented by the 3 years differ.
D)The data appear to provide little or no evidence that the treatment is effective in reducing herd size.
The researchers did an ANOVA F test of the data and obtained the following results. For this example,which of the following conclusions is most reasonable?A)There is moderate evidence that the treatment is effective in reducing herd size for about 1 year,but then the effect appears to wear off.
B)An ANOVA F test is not appropriate for these data.The assumptions needed for the F test to be valid are not all satisfied.
C)The data provide strong evidence that the mean number of foals for the populations represented by the 3 years differ.
D)The data appear to provide little or no evidence that the treatment is effective in reducing herd size.
سؤال
سؤال
Wild horse populations on federal lands have been protected since 1971.Since that time,the populations have grown large and need to be managed and kept to a supportable size.Management of the mustang population has been a controversial issue;one common method is periodic removal of the horses.Researchers were curious if a new method would work better.In 1985,12 horses were rounded up and male horses in the group of 12 were treated.The number of foals in each group of 12 horses for 3 years was recorded.Year 1 was prior to treatment,year 2 was the year the treatment was applied,and year 3 was 1 year after treatment.The average number of foals per group along with the standard deviation is given in the table below.  The researchers did an ANOVA F test of the data and obtained the following results.
  What can we say about the P-value for this F test?
A)P-value < 0.01
B)0.01 < P-value < 0.05
C)0.05 < P-value < 0.10
D)P-value > 0.10
The researchers did an ANOVA F test of the data and obtained the following results. What can we say about the P-value for this F test?A)P-value < 0.01
B)0.01 < P-value < 0.05
C)0.05 < P-value < 0.10
D)P-value > 0.10
سؤال
سؤال
سؤال
Battery life of tablet computers is of great concern to customers.A consumer group has tested four brands of such tablets to determine the battery life.Samples of tablets of each brand were fully charged and left to run until the battery died.The number of hours that each tablet lasted was recorded.The following graphs and tables from the analysis of the data are provided.(Note: Some entries have been omitted and replaced with **.) 
 To test the ANOVA null hypothesis H0:
  ,what are the test statistic and its associated P-value?
A)F(3,50)= 3.28;0.01 < P < 0.025
B)F(3,50)= 2.91;0.02 < P < 0.05
C)F(4,49)= 3.28;0.01 < P < 0.025
D)F(3,50)= 3.28;0.025 < P < 0.05
E)F(4,50)= 2.91;0.025 < P < 0.05
To test the ANOVA null hypothesis H0: ,what are the test statistic and its associated P-value?A)F(3,50)= 3.28;0.01 < P < 0.025
B)F(3,50)= 2.91;0.02 < P < 0.05
C)F(4,49)= 3.28;0.01 < P < 0.025
D)F(3,50)= 3.28;0.025 < P < 0.05
E)F(4,50)= 2.91;0.025 < P < 0.05
سؤال
Quality ratings of a new line of take-home refrigerated entrées were obtained from three randomly formed groups of customers who were exposed to different types of advertisements about the product.One group,with 55 customers,saw ads that were designed to undermine their expected positive association of quality with advertisements;a second group of 36 customers saw ads that were designed to affirm their positive association of quality with advertisements;the third group with 36 subjects served as the control group.The following is the ANOVA table obtained from the data in the study.(Some entries have been replaced by **.) 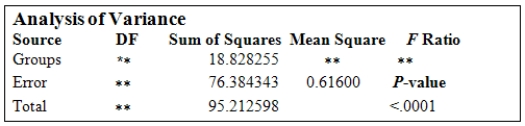 The degrees of freedom for total,groups,and error are,respectively,
A)DFT = 127;DFG = 3;and DFE = 124.
B)DFT = 127;DFG = 2;and DFE = 125.
C)DFT = 126;DFG = 3;and DFE = 123.
D)DFT = 126;DFG = 2;and DFE = 124.
E)This cannot be determined with the information given.
The degrees of freedom for total,groups,and error are,respectively,A)DFT = 127;DFG = 3;and DFE = 124.
B)DFT = 127;DFG = 2;and DFE = 125.
C)DFT = 126;DFG = 3;and DFE = 123.
D)DFT = 126;DFG = 2;and DFE = 124.
E)This cannot be determined with the information given.
سؤال
Which of the following statements about the one-way ANOVA model  for i = 1,…,I and j = 1,…,
Is/are FALSE?
A)The
Are Normally distributed.
B)The
Have a mean of 0 and a standard deviation of

,i = 1,…,I.
C)The parameters of the model are the population means
,

,…,

And .
D)The
Represent the jth observation from the ith population,which has mean

.
E)The
Are the deviations of the observations from the means and represent the random variation part of the model.
for i = 1,…,I and j = 1,…, Is/are FALSE?
A)The
Are Normally distributed.
B)The
Have a mean of 0 and a standard deviation of
,i = 1,…,I.
C)The parameters of the model are the population means
,
,…,
And .
D)The
Represent the jth observation from the ith population,which has mean
.
E)The
Are the deviations of the observations from the means and represent the random variation part of the model.
سؤال
Which of the following statements about the sums of squares associated with the analysis of variance is/are FALSE?
A)The total variation in the data is always equal to the among-group variation minus the within-group variation.
B)SSG measures the variation of the group means around the overall mean,
.
C)SSE measures the variation of each observation around its group mean,
.
D)SST measures variation of the data around the overall mean,
.
E)SST = SSG + SSE
سؤال
Wild horse populations on federal lands have been protected since 1971.Since that time,the populations have grown large and need to be managed and kept to a supportable size.Management of the mustang population has been a controversial issue;one common method is periodic removal of the horses.Researchers were curious if a new method would work better.In 1985,12 horses were rounded up and male horses in the group of 12 were treated.The number of foals in each group of 12 horses for 3 years was recorded.Year 1 was prior to treatment,year 2 was the year the treatment was applied,and year 3 was 1 year after treatment.The average number of foals per group along with the standard deviation is given in the table below.  The researchers did an ANOVA F test of the data and obtained the following results.
 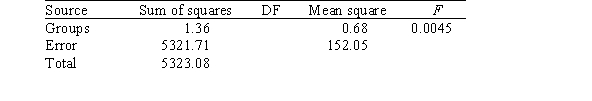 What are the degrees of freedom for the F statistic?
A)2 and 33
B)2 and 36
C)3 and 33
D)3 and 35
The researchers did an ANOVA F test of the data and obtained the following results. What are the degrees of freedom for the F statistic?A)2 and 33
B)2 and 36
C)3 and 33
D)3 and 35
سؤال
Which of the following concerning the ANOVA model,procedures,and table is/are FALSE?
A)The unbiased estimator of the common variance
Is given by
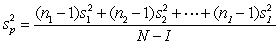
,where

.
B)The mean square for total is given by MST = MSE + MSE.
C)The coefficient of determination is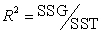
.
D)The degrees of freedom for error can be found from DFE = DFT - DFG.
E)The pooled estimate of is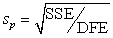
.
A)The unbiased estimator of the common variance
Is given by
,where
.
B)The mean square for total is given by MST = MSE + MSE.
C)The coefficient of determination is
.
D)The degrees of freedom for error can be found from DFE = DFT - DFG.
E)The pooled estimate of is
.
سؤال
Battery life of tablet computers is of great concern to customers.A consumer group has tested four brands of such tablets to determine the battery life.Samples of tablets of each brand were fully charged and left to run until the battery died.The number of hours that each tablet lasted was recorded.The following graphs and tables from the analysis of the data are provided.(Note: Some entries have been omitted and replaced with **.) 
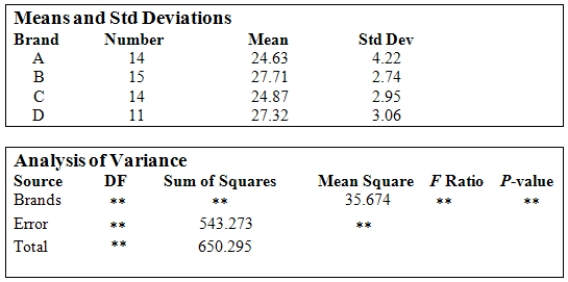 If one wanted to calculate the SST from the data,the value of the overall mean
  needs to be determined.Using the above information,what is the value of the overall mean?
A)26.13
B)26.10
C)25.23
D)24.16
E)This cannot be determined without knowing the individual data values.
If one wanted to calculate the SST from the data,the value of the overall mean needs to be determined.Using the above information,what is the value of the overall mean?A)26.13
B)26.10
C)25.23
D)24.16
E)This cannot be determined without knowing the individual data values.
سؤال
Quality ratings of a new line of take-home refrigerated entrées were obtained from three randomly formed groups of customers who were exposed to different types of advertisements about the product.One group,with 55 customers,saw ads that were designed to undermine their expected positive association of quality with advertisements;a second group of 36 customers saw ads that were designed to affirm their positive association of quality with advertisements;the third group with 36 subjects served as the control group.The following is the ANOVA table obtained from the data in the study.(Some entries have been replaced by **.)  What is the estimate of the common population standard deviation ?
A)

= 3.068
B)

= 0.785
C)

= 8.740
D)

= 0.616
E)This cannot be determined with the information given.
What is the estimate of the common population standard deviation ?A)
= 3.068
B)
= 0.785
C)
= 8.740
D)
= 0.616
E)This cannot be determined with the information given.
سؤال
In a study on scholastic test scores of entering college freshmen,a random sample of colleges across the nation is selected and the average SAT Math score for the freshman class is recorded.The colleges are categorized according to their affiliation: public,private,or church.Does it appear that freshmen entering the three different types of schools do equally well on the SAT Math? Computer output is included below. 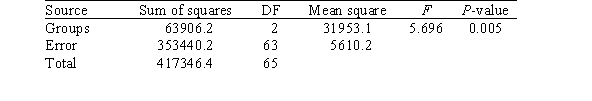 At a significance level of 0.05,what is the appropriate conclusion about the average SAT Math scores?
A)The average SAT Math scores for freshmen attending colleges with the three different affiliations appear to be the same.
B)Each of the three average SAT Math scores for freshmen attending colleges with the three different affiliations appears to be different.
C)It appears that freshmen attending at least one of the three different types of college have a different average SAT Math score.
D)Freshmen at one type of affiliated college have a significantly better average SAT Math score than the other two.
At a significance level of 0.05,what is the appropriate conclusion about the average SAT Math scores?A)The average SAT Math scores for freshmen attending colleges with the three different affiliations appear to be the same.
B)Each of the three average SAT Math scores for freshmen attending colleges with the three different affiliations appears to be different.
C)It appears that freshmen attending at least one of the three different types of college have a different average SAT Math score.
D)Freshmen at one type of affiliated college have a significantly better average SAT Math score than the other two.
سؤال
Battery life of tablet computers is of great concern to customers.A consumer group has tested four brands of such tablets to determine the battery life.Samples of tablets of each brand were fully charged and left to run until the battery died.The number of hours that each tablet lasted was recorded.The following graphs and tables from the analysis of the data are provided.(Note: Some entries have been omitted and replaced with **.) 
 What conclusion might you reach based on these analyses?
A)There is no evidence to suggest that the null hypothesis should be rejected.
B)There is evidence to support the conclusion that all the population means are different.
C)There is sufficient evidence to conclude that the sample means are not equal.
D)There is sufficient evidence to conclude that not all the population means are equal.
E)It would be dangerous to conclude anything because the sample sizes are small and some of the ANOVA assumptions are not satisfied.
What conclusion might you reach based on these analyses?A)There is no evidence to suggest that the null hypothesis should be rejected.
B)There is evidence to support the conclusion that all the population means are different.
C)There is sufficient evidence to conclude that the sample means are not equal.
D)There is sufficient evidence to conclude that not all the population means are equal.
E)It would be dangerous to conclude anything because the sample sizes are small and some of the ANOVA assumptions are not satisfied.
سؤال
Quality ratings of a new line of take-home refrigerated entrées were obtained from three randomly formed groups of customers who were exposed to different types of advertisements about the product.One group,with 55 customers,saw ads that were designed to undermine their expected positive association of quality with advertisements;a second group of 36 customers saw ads that were designed to affirm their positive association of quality with advertisements;the third group with 36 subjects served as the control group.The following is the ANOVA table obtained from the data in the study.(Some entries have been replaced by **.)  What is the value of the F statistic for testing that the three group means are equal?
A)15.28
B)10.19
C)4.06
D)7.15
E)Not within ± 1 of any of the above
What is the value of the F statistic for testing that the three group means are equal?A)15.28
B)10.19
C)4.06
D)7.15
E)Not within ± 1 of any of the above
سؤال
Battery life of tablet computers is of great concern to customers.A consumer group has tested four brands of such tablets to determine the battery life.Samples of tablets of each brand were fully charged and left to run until the battery died.The number of hours that each tablet lasted was recorded.The following graphs and tables from the analysis of the data are provided.(Note: Some entries have been omitted and replaced with **.) 
 How many degrees of freedom are there for error (DFE),and what is the value of the MSE?
A)DFE = 51;MSE = 10.65
B)DFE = 49;MSE = 11.09
C)DFE = 51;MSE = 10.87
D)DFE = 50;MSE = 12.27
E)DFE = 50;MSE = 10.87
How many degrees of freedom are there for error (DFE),and what is the value of the MSE?A)DFE = 51;MSE = 10.65
B)DFE = 49;MSE = 11.09
C)DFE = 51;MSE = 10.87
D)DFE = 50;MSE = 12.27
E)DFE = 50;MSE = 10.87
سؤال
Battery life of tablet computers is of great concern to customers.A consumer group has tested four brands of such tablets to determine the battery life.Samples of tablets of each brand were fully charged and left to run until the battery died.The number of hours that each tablet lasted was recorded.The following graphs and tables from the analysis of the data are provided.(Note: Some entries have been omitted and replaced with **.) 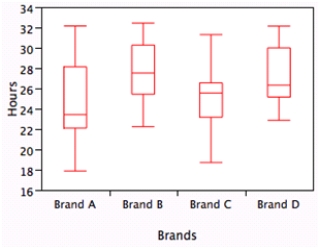
 What conclusion might one draw by looking at the side-by-side boxplots?
A)The ANOVA assumption of Normality of the data is satisfied.
B)The population means certainly are different.
C)There is insufficient data to justify reaching any conclusion here.
D)There is different variability from brand-to-brand but not enough difference to raise concern about the common variance ANOVA assumption.
E)The consumer group should look at the Normal quantile plot to verify the common variance assumption.
What conclusion might one draw by looking at the side-by-side boxplots?A)The ANOVA assumption of Normality of the data is satisfied.
B)The population means certainly are different.
C)There is insufficient data to justify reaching any conclusion here.
D)There is different variability from brand-to-brand but not enough difference to raise concern about the common variance ANOVA assumption.
E)The consumer group should look at the Normal quantile plot to verify the common variance assumption.
سؤال
Battery life of tablet computers is of great concern to customers.A consumer group has tested four brands of such tablets to determine the battery life.Samples of tablets of each brand were fully charged and left to run until the battery died.The number of hours that each tablet lasted was recorded.The following graphs and tables from the analysis of the data are provided.(Note: Some entries have been omitted and replaced with **.) 
 What is the value of the coefficient of determination,
  ?
?
A)0.835
B)0.406
C)0.165
D)0.197
E)Not within ± 0.01 of any of the above
What is the value of the coefficient of determination, ?A)0.835
B)0.406
C)0.165
D)0.197
E)Not within ± 0.01 of any of the above
سؤال
A service center for electronic equipment is conducting a study on three of their technicians: Joe,John,and James.All three specialize in repairing computer drives.The study was performed to study the service time of fixing the computer drives.The manager of the service center wishes to assess if the average service times for the three technicians are equal: H0: 1 = 2 = 3.Each technician was given a random sample of computer drives,and the service time for each was recorded.The ANOVA table and descriptive statistics are given below.  Under the null hypothesis of equality of population means,what is the point estimate of the common mean?
A)0.166
B)12.29
C)24.58
D)55.82
Under the null hypothesis of equality of population means,what is the point estimate of the common mean?A)0.166
B)12.29
C)24.58
D)55.82
سؤال
At what age do babies learn to crawl? Does it take longer to learn in the winter when babies are often bundled in clothes that restrict their movement? Data were collected from parents who brought their babies into the University of Denver Infant Study Center to participate in one of a number of experiments between 1988 and 1991.Parents reported the birth month and the age at which their child was first able to creep or crawl a distance of 4 feet within 1 minute.The resulting data were grouped by month of birth: January,May,and September:  Crawling age is given in weeks.Assume the data represent three independent simple random samples,one from each of the three populations consisting of babies born in that particular month,and that the populations of crawling ages have Normal distributions. A partial ANOVA table is given below.
  What are the degrees of freedom for the error term?
A)2
B)3
C)94
D)96
Crawling age is given in weeks.Assume the data represent three independent simple random samples,one from each of the three populations consisting of babies born in that particular month,and that the populations of crawling ages have Normal distributions. A partial ANOVA table is given below. What are the degrees of freedom for the error term?A)2
B)3
C)94
D)96
سؤال
A study on color brightness for different types of projectors involved three different brands: A,B,and C.The projectors were rated for color brightness (a higher score means brighter colors).Random samples of 15 of the ratings from each brand were taken.The SPSS output from the analysis is (partially)given below.  The SPSS output for the contrast ,which compares the color brightness of B to the average of the other two brands,is given below.
 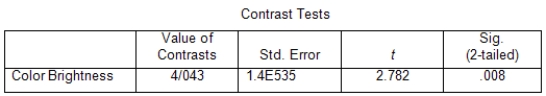 What is the P-value for testing if the color brightness of B is significantly higher than the average of the other two brands?
A)P-value = 0.004,because for performing a one-sided test we have to divide the reported P-value by 2.
B)P-value = 0.008,because that is the P-value reported in the output.
C)P-value = 0.016,because for performing a one-sided test we have to multiply the reported P-value by 2.
D)This cannot be determined without studying the actual data values.
The SPSS output for the contrast ,which compares the color brightness of B to the average of the other two brands,is given below. What is the P-value for testing if the color brightness of B is significantly higher than the average of the other two brands?A)P-value = 0.004,because for performing a one-sided test we have to divide the reported P-value by 2.
B)P-value = 0.008,because that is the P-value reported in the output.
C)P-value = 0.016,because for performing a one-sided test we have to multiply the reported P-value by 2.
D)This cannot be determined without studying the actual data values.
سؤال
A service center for electronic equipment is conducting a study on three of their technicians: Joe,John,and James.All three specialize in repairing computer drives.The study was performed to study the service time of fixing the computer drives.The manager of the service center wishes to assess if the average service times for the three technicians are equal: H0: 1 = 2 = 3.Each technician was given a random sample of computer drives,and the service time for each was recorded.The ANOVA table and descriptive statistics are given below.  How many computer drives were included in the study?
A)42
B)43
C)44
D)45
How many computer drives were included in the study?A)42
B)43
C)44
D)45
سؤال
A study on color brightness for different types of projectors involved three different brands: A,B,and C.The projectors were rated for color brightness (a higher score means brighter colors).Random samples of 15 of the ratings from each brand were taken.The SPSS output from the analysis is (partially)given below.  What is the value of the estimate of the common population variance?
A)9.054
B)47.854
C)95.707
D)380.263
What is the value of the estimate of the common population variance?A)9.054
B)47.854
C)95.707
D)380.263
سؤال
A study on color brightness for different types of projectors involved three different brands: A,B,and C.The projectors were rated for color brightness (a higher score means brighter colors).Random samples of 15 of the ratings from each brand were taken.The SPSS output from the analysis is (partially)given below.  What are the degrees of freedom for the F statistic?
A)2 and 42
B)2 and 44
C)3 and 44
D)3 and 45
What are the degrees of freedom for the F statistic?A)2 and 42
B)2 and 44
C)3 and 44
D)3 and 45
سؤال
Bleaching chemicals are used in the pulp and paper industry to increase the brightness of the paper that is produced.Four chemical agents were studied to determine their effect on the brightness of paper produced from pulp treated with the chemical.The following tables provide some details obtained from the experimental data.  The null hypothesis Ho:
 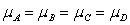 was established for the ANOVA.
What is the appropriate alternative hypothesis?
A)Ha: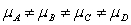
B)Ha: none of the
Is equal to any other
C)Ha: all of the pairs of the
Are different
D)Ha: one of the
Is different from all the others
E)Ha: not all of the
Are equal
The null hypothesis Ho: was established for the ANOVA.What is the appropriate alternative hypothesis?
A)Ha:
B)Ha: none of the
Is equal to any other
C)Ha: all of the pairs of the
Are different
D)Ha: one of the
Is different from all the others
E)Ha: not all of the
Are equal
سؤال
At what age do babies learn to crawl? Does it take longer to learn in the winter when babies are often bundled in clothes that restrict their movement? Data were collected from parents who brought their babies into the University of Denver Infant Study Center to participate in one of a number of experiments between 1988 and 1991.Parents reported the birth month and the age at which their child was first able to creep or crawl a distance of 4 feet within 1 minute.The resulting data were grouped by month of birth: January,May,and September:  Crawling age is given in weeks.Assume the data represent three independent simple random samples,one from each of the three populations consisting of babies born in that particular month,and that the populations of crawling ages have Normal distributions. A partial ANOVA table is given below.
  What can we say about the P-value for this F test?
A)P-value < 0.01
B)0.01 < P-value < 0.025
C)0.025 < P-value < 0.05
D)0.05 < P-value < 0.10
Crawling age is given in weeks.Assume the data represent three independent simple random samples,one from each of the three populations consisting of babies born in that particular month,and that the populations of crawling ages have Normal distributions. A partial ANOVA table is given below. What can we say about the P-value for this F test?A)P-value < 0.01
B)0.01 < P-value < 0.025
C)0.025 < P-value < 0.05
D)0.05 < P-value < 0.10
سؤال
Bleaching chemicals are used in the pulp and paper industry to increase the brightness of the paper that is produced.Four chemical agents were studied to determine their effect on the brightness of paper produced from pulp treated with the chemical.The following tables provide some details obtained from the experimental data. 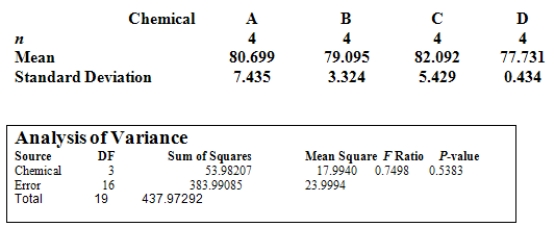 The null hypothesis Ho:
  was established for the ANOVA.
If the null hypothesis is true,the ANOVA table shows that the P-value is 0.5383.What should we conclude from this?
A)The mean of Chemical D is certainly different from the mean of Chemical A.
B)Some of the chemicals have a different effect on the brightness of the paper.
C)The null hypothesis should be rejected in favor of the alternative hypothesis.
D)Caution should be exercised on any conclusion from the ANOVA because the assumption of equal standard deviation among chemicals may be suspect.
E)With only 19 degrees of freedom for total,nothing much can be concluded from this experiment.
The null hypothesis Ho: was established for the ANOVA.If the null hypothesis is true,the ANOVA table shows that the P-value is 0.5383.What should we conclude from this?
A)The mean of Chemical D is certainly different from the mean of Chemical A.
B)Some of the chemicals have a different effect on the brightness of the paper.
C)The null hypothesis should be rejected in favor of the alternative hypothesis.
D)Caution should be exercised on any conclusion from the ANOVA because the assumption of equal standard deviation among chemicals may be suspect.
E)With only 19 degrees of freedom for total,nothing much can be concluded from this experiment.
سؤال
At what age do babies learn to crawl? Does it take longer to learn in the winter when babies are often bundled in clothes that restrict their movement? Data were collected from parents who brought their babies into the University of Denver Infant Study Center to participate in one of a number of experiments between 1988 and 1991.Parents reported the birth month and the age at which their child was first able to creep or crawl a distance of 4 feet within 1 minute.The resulting data were grouped by month of birth: January,May,and September:  Crawling age is given in weeks.Assume the data represent three independent simple random samples,one from each of the three populations consisting of babies born in that particular month,and that the populations of crawling ages have Normal distributions. A partial ANOVA table is given below.
  What are the degrees of freedom for the groups term?
A)2
B)3
C)94
D)96
Crawling age is given in weeks.Assume the data represent three independent simple random samples,one from each of the three populations consisting of babies born in that particular month,and that the populations of crawling ages have Normal distributions. A partial ANOVA table is given below. What are the degrees of freedom for the groups term?A)2
B)3
C)94
D)96
سؤال
It is widely believed that a person's level of fitness prior to undergoing corrective knee surgery is an important factor in the speed of rehabilitation following surgery.A study was undertaken with 24 randomly selected male subjects who were to undergo such surgery.The physical fitness status of each subject before the surgery was categorized as being below average (n = 8),average (n = 10),or above average (n = 6).Following surgery,the number of days spent in physical therapy by each patient until fully rehabilitated was determined.Examination of side-by-side boxplots indicated that it was reasonable to assume that the samples came from populations with equal standard deviations. The following ANOVA table was obtained.(Some entries have been replaced with **.) 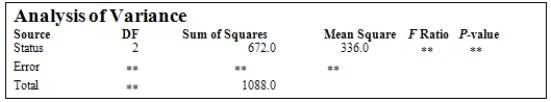 The degrees of freedom associated with the ANOVA F test are ____________.
A)F(3,21)
B)F(2,22)
C)F(2,23)
D)F(2,21)
E)F(3,20)
The degrees of freedom associated with the ANOVA F test are ____________.A)F(3,21)
B)F(2,22)
C)F(2,23)
D)F(2,21)
E)F(3,20)
سؤال
A study on color brightness for different types of projectors involved three different brands: A,B,and C.The projectors were rated for color brightness (a higher score means brighter colors).Random samples of 15 of the ratings from each brand were taken.The SPSS output from the analysis is (partially)given below. 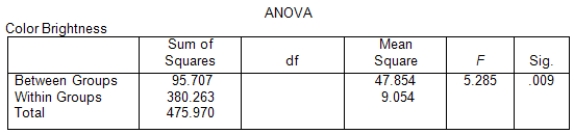 One assumption in the ANOVA is that the populations have equal standard deviations.Side-by-side boxplots of the sample data are shown below.Does this assumption seem reasonable?
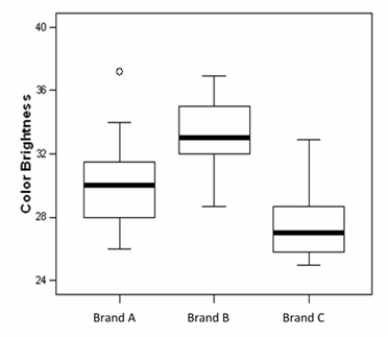
A)Yes,because the interquartile ranges are similar in the graph.
B)No,because there is an outlier present in the data.
C)No,because medians for the three different brands are so different.
D)This cannot be determined without studying the actual data values.
One assumption in the ANOVA is that the populations have equal standard deviations.Side-by-side boxplots of the sample data are shown below.Does this assumption seem reasonable? A)Yes,because the interquartile ranges are similar in the graph.
B)No,because there is an outlier present in the data.
C)No,because medians for the three different brands are so different.
D)This cannot be determined without studying the actual data values.
سؤال
A contrast expresses an effect in the population as a combination of population means,of the form  .The contrast can be estimated or tested using the sample data.Which of the following statements about or properties of contrasts is/are FALSE?
A)The corresponding sample contrast is
.
B)The coefficients of the contrast must sum to one,
.
C)The standard error of a sample contrast is given by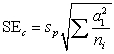
.
D)To test the hypothesis that the population contrast
= 0,the test statistic is

,which follows the t distribution with DFE associated with

From the ANOVA.
E)The confidence interval for
Takes the form

,where

Is the appropriate value of the t(DFE)distribution.
.The contrast can be estimated or tested using the sample data.Which of the following statements about or properties of contrasts is/are FALSE?A)The corresponding sample contrast is
.
B)The coefficients of the contrast must sum to one,
.
C)The standard error of a sample contrast is given by
.
D)To test the hypothesis that the population contrast
= 0,the test statistic is
,which follows the t distribution with DFE associated with
From the ANOVA.
E)The confidence interval for
Takes the form
,where
Is the appropriate value of the t(DFE)distribution.
سؤال
It is widely believed that a person's level of fitness prior to undergoing corrective knee surgery is an important factor in the speed of rehabilitation following surgery.A study was undertaken with 24 randomly selected male subjects who were to undergo such surgery.The physical fitness status of each subject before the surgery was categorized as being below average (n = 8),average (n = 10),or above average (n = 6).Following surgery,the number of days spent in physical therapy by each patient until fully rehabilitated was determined.Examination of side-by-side boxplots indicated that it was reasonable to assume that the samples came from populations with equal standard deviations. The following ANOVA table was obtained.(Some entries have been replaced with **.)  What are the values of the mean square for error (MSE)and the F statistic for testing the null hypothesis H0:
?
A) MSE = 47.30; F = 7.10
B) MSE = 19.81; F = 1.62
C) MSE = 19.81; F = 16.96
D) MSE = 416.0; F = 7.10
E) MSE = 47.30; F = 16.96
What are the values of the mean square for error (MSE)and the F statistic for testing the null hypothesis H0: ?
A) MSE = 47.30; F = 7.10
B) MSE = 19.81; F = 1.62
C) MSE = 19.81; F = 16.96
D) MSE = 416.0; F = 7.10
E) MSE = 47.30; F = 16.96
سؤال
At what age do babies learn to crawl? Does it take longer to learn in the winter when babies are often bundled in clothes that restrict their movement? Data were collected from parents who brought their babies into the University of Denver Infant Study Center to participate in one of a number of experiments between 1988 and 1991.Parents reported the birth month and the age at which their child was first able to creep or crawl a distance of 4 feet within 1 minute.The resulting data were grouped by month of birth: January,May,and September: 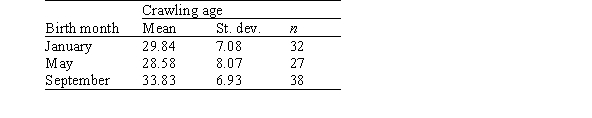 Crawling age is given in weeks.Assume the data represent three independent simple random samples,one from each of the three populations consisting of babies born in that particular month,and that the populations of crawling ages have Normal distributions. A partial ANOVA table is given below.
 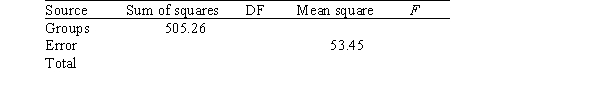 The null hypothesis for the ANOVA F test is that the population mean crawling ages are equal for all three birth months.What is the alternative hypothesis?
A)The population mean crawling age is larger for January than the other 2 months.
B)The population mean crawling age is larger for May than the other 2 months.
C)The three population mean crawling ages are all different from each other.
D)Not all three population mean crawling ages are equal to each other.
Crawling age is given in weeks.Assume the data represent three independent simple random samples,one from each of the three populations consisting of babies born in that particular month,and that the populations of crawling ages have Normal distributions. A partial ANOVA table is given below. The null hypothesis for the ANOVA F test is that the population mean crawling ages are equal for all three birth months.What is the alternative hypothesis?A)The population mean crawling age is larger for January than the other 2 months.
B)The population mean crawling age is larger for May than the other 2 months.
C)The three population mean crawling ages are all different from each other.
D)Not all three population mean crawling ages are equal to each other.
سؤال
A service center for electronic equipment is conducting a study on three of their technicians: Joe,John,and James.All three specialize in repairing computer drives.The study was performed to study the service time of fixing the computer drives.The manager of the service center wishes to assess if the average service times for the three technicians are equal: H0: 1 = 2 = 3.Each technician was given a random sample of computer drives,and the service time for each was recorded.The ANOVA table and descriptive statistics are given below.  What is the value of an estimate of the common standard deviation?
A)3.51
B)8.45
C)8.61
D)12.29
What is the value of an estimate of the common standard deviation?A)3.51
B)8.45
C)8.61
D)12.29
سؤال
It is widely believed that a person's level of fitness prior to undergoing corrective knee surgery is an important factor in the speed of rehabilitation following surgery.A study was undertaken with 24 randomly selected male subjects who were to undergo such surgery.The physical fitness status of each subject before the surgery was categorized as being below average (n = 8),average (n = 10),or above average (n = 6).Following surgery,the number of days spent in physical therapy by each patient until fully rehabilitated was determined.Examination of side-by-side boxplots indicated that it was reasonable to assume that the samples came from populations with equal standard deviations. The following ANOVA table was obtained.(Some entries have been replaced with **.)  What is the value of the estimate for the common population variance,
?
A)4.45
B)336.0
C)47.3
D)20.40
E)None of the above
What is the value of the estimate for the common population variance, ?
A)4.45
B)336.0
C)47.3
D)20.40
E)None of the above
سؤال
At what age do babies learn to crawl? Does it take longer to learn in the winter when babies are often bundled in clothes that restrict their movement? Data were collected from parents who brought their babies into the University of Denver Infant Study Center to participate in one of a number of experiments between 1988 and 1991.Parents reported the birth month and the age at which their child was first able to creep or crawl a distance of 4 feet within 1 minute.The resulting data were grouped by month of birth: January,May,and September:  Crawling age is given in weeks.Assume the data represent three independent simple random samples,one from each of the three populations consisting of babies born in that particular month,and that the populations of crawling ages have Normal distributions. A partial ANOVA table is given below.
  What is the value of the ANOVA F statistic for testing the equality of the population means?
A)3.15
B)4.73
C)6.30
D)9.45
Crawling age is given in weeks.Assume the data represent three independent simple random samples,one from each of the three populations consisting of babies born in that particular month,and that the populations of crawling ages have Normal distributions. A partial ANOVA table is given below. What is the value of the ANOVA F statistic for testing the equality of the population means?A)3.15
B)4.73
C)6.30
D)9.45
سؤال
A study on color brightness for different types of projectors involved three different brands: A,B,and C.The projectors were rated for color brightness (a higher score means brighter colors).Random samples of 15 of the ratings from each brand were taken.The SPSS output from the analysis is (partially)given below.  Suppose we wish to assess if the color brightness of B is significantly higher than the average of the other two brands,by conducting a hypothesis test for the appropriate contrast .Let 1, 2,and 3 denote the population means for A,B,and C,respectively.What are the values of the coefficients for the contrast ?
A)a1 = 1/3,a2 = 1/3,and a3 = 1/3
B)a1 = 1/2,a2 = 1,and a3 = 1/2
C)a1 = -1/2,a2 = 1,and a3 = -1/2
D)a1 = 1/2,a2 = 1/4,and a3 = 1/2
Suppose we wish to assess if the color brightness of B is significantly higher than the average of the other two brands,by conducting a hypothesis test for the appropriate contrast .Let 1, 2,and 3 denote the population means for A,B,and C,respectively.What are the values of the coefficients for the contrast ?A)a1 = 1/3,a2 = 1/3,and a3 = 1/3
B)a1 = 1/2,a2 = 1,and a3 = 1/2
C)a1 = -1/2,a2 = 1,and a3 = -1/2
D)a1 = 1/2,a2 = 1/4,and a3 = 1/2
سؤال
At what age do babies learn to crawl? Does it take longer to learn in the winter when babies are often bundled in clothes that restrict their movement? Data were collected from parents who brought their babies into the University of Denver Infant Study Center to participate in one of a number of experiments between 1988 and 1991.Parents reported the birth month and the age at which their child was first able to creep or crawl a distance of 4 feet within 1 minute.The resulting data were grouped by month of birth: January,May,and September:  Crawling age is given in weeks.Assume the data represent three independent simple random samples,one from each of the three populations consisting of babies born in that particular month,and that the populations of crawling ages have Normal distributions. A partial ANOVA table is given below.
  Multiple comparison procedures are going to be used to calculate simultaneous confidence intervals for all pairwise comparisons using the Bonferroni method.
For = 0.10,the value of t** is 2.16.What would be the 90% confidence interval for the difference between May and September using the Bonferroni method?
A)(-9.39,-1.11)
B)(-9.22,-1.28)
C)(1.28,9.22)
D)(3.29,7.21)
Crawling age is given in weeks.Assume the data represent three independent simple random samples,one from each of the three populations consisting of babies born in that particular month,and that the populations of crawling ages have Normal distributions. A partial ANOVA table is given below. Multiple comparison procedures are going to be used to calculate simultaneous confidence intervals for all pairwise comparisons using the Bonferroni method.For = 0.10,the value of t** is 2.16.What would be the 90% confidence interval for the difference between May and September using the Bonferroni method?
A)(-9.39,-1.11)
B)(-9.22,-1.28)
C)(1.28,9.22)
D)(3.29,7.21)
سؤال
At a large automobile factory,four different machines are used to produce disc brakes.To make sure that the disc brakes are all being produced with comparable diameters,daily samples of 16 disc brakes are taken from the production lines of each of the four machines and their diameters measured.The deviation from the goal diameter of 322 micrometers is measured to the nearest micrometer.Assume that the distribution of these deviations is approximately Normal with a common standard deviation.Does it appear that disc brakes made on the four machines are made with equal mean diameters? SPSS output is included below.  What are the degrees of freedom for the F statistic?
A)3 and 60
B)3 and 63
C)3 and 64
D)4 and 64
What are the degrees of freedom for the F statistic?A)3 and 60
B)3 and 63
C)3 and 64
D)4 and 64
سؤال
A service center for electronic equipment is conducting a study on three of their technicians: Joe,John,and James.All three specialize in repairing computer drives.The study was performed to study the service time of fixing the computer drives.The manager of the service center wishes to assess if the average service times for the three technicians are equal: H0: 1 = 2 = 3.Each technician was given a random sample of computer drives,and the service time for each was recorded.The ANOVA table and descriptive statistics are given below.  Under the null hypothesis of equality of population means,what is the appropriate model for the test statistic?
A)F(2,42)
B)F(2,44)
C)F(3,44)
D)F(3,45)
Under the null hypothesis of equality of population means,what is the appropriate model for the test statistic?A)F(2,42)
B)F(2,44)
C)F(3,44)
D)F(3,45)
سؤال
At a large automobile factory,four different machines are used to produce disc brakes.To make sure that the disc brakes are all being produced with comparable diameters,daily samples of 16 disc brakes are taken from the production lines of each of the four machines and their diameters measured.The deviation from the goal diameter of 322 micrometers is measured to the nearest micrometer.Assume that the distribution of these deviations is approximately Normal with a common standard deviation.Does it appear that disc brakes made on the four machines are made with equal mean diameters? SPSS output is included below.  Some summary measures for the four machines are given below.
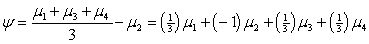
  Suppose we are interested in the contrast that compares the average of machines 1,3,and 4 (the most recently purchased machines)to machine 2 (a slightly older model).

What is the value of the standard error of the contrast ?
A)2.88
B)3.52
C)8.28
D)12.42
Some summary measures for the four machines are given below. Suppose we are interested in the contrast that compares the average of machines 1,3,and 4 (the most recently purchased machines)to machine 2 (a slightly older model). What is the value of the standard error of the contrast ?
A)2.88
B)3.52
C)8.28
D)12.42
سؤال
At a large automobile factory,four different machines are used to produce disc brakes.To make sure that the disc brakes are all being produced with comparable diameters,daily samples of 16 disc brakes are taken from the production lines of each of the four machines and their diameters measured.The deviation from the goal diameter of 322 micrometers is measured to the nearest micrometer.Assume that the distribution of these deviations is approximately Normal with a common standard deviation.Does it appear that disc brakes made on the four machines are made with equal mean diameters? SPSS output is included below.  What is the value of the estimate of the common population standard deviation?
A)9.97
B)11.75
C)34.17
D)99.37
What is the value of the estimate of the common population standard deviation?A)9.97
B)11.75
C)34.17
D)99.37
سؤال
Independent random samples of households in the four U.S.regions (Northeast,Midwest,South,and West)yielded data on last year's energy consumption.We are interested in assessing,at the 1% significance level,if the data provide sufficient evidence to conclude that last year's average energy consumption was different among the four U.S.regions.Assume that energy consumption in the four regions is Normally distributed.
SPSS was used to create the side-by-side boxplots shown below.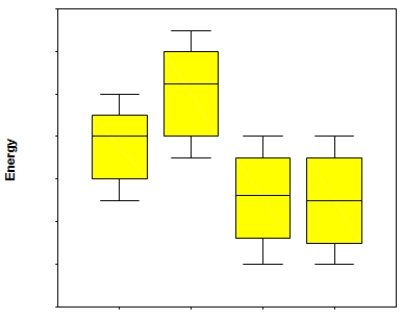 What is the null hypothesis for assessing if the mean energy consumption was the same for the four regions?
SPSS was used to create the side-by-side boxplots shown below.
What is the null hypothesis for assessing if the mean energy consumption was the same for the four regions? سؤال
Independent random samples of households in the four U.S.regions (Northeast,Midwest,South,and West)yielded data on last year's energy consumption.We are interested in assessing,at the 1% significance level,if the data provide sufficient evidence to conclude that last year's average energy consumption was different among the four U.S.regions.Assume that energy consumption in the four regions is Normally distributed.
SPSS was used to create the side-by-side boxplots shown below.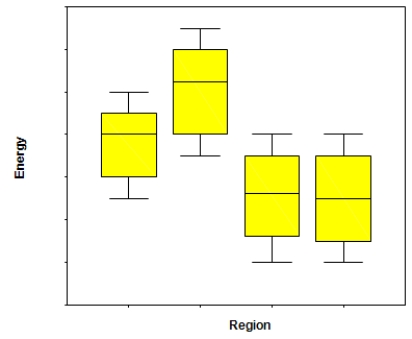 What assumption needed for an ANOVA F test can be checked with this graph?
SPSS was used to create the side-by-side boxplots shown below.
What assumption needed for an ANOVA F test can be checked with this graph? سؤال
At a large automobile factory,four different machines are used to produce disc brakes.To make sure that the disc brakes are all being produced with comparable diameters,daily samples of 16 disc brakes are taken from the production lines of each of the four machines and their diameters measured.The deviation from the goal diameter of 322 micrometers is measured to the nearest micrometer.Assume that the distribution of these deviations is approximately Normal with a common standard deviation.Does it appear that disc brakes made on the four machines are made with equal mean diameters? SPSS output is included below.  Some summary measures for the four machines are given below.
 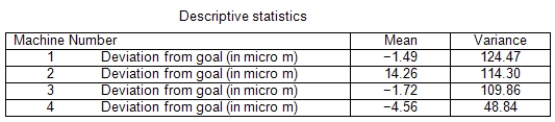 Suppose we are interested in the contrast that compares the average of machines 1,3,and 4 (the most recently purchased machines)to machine 2 (a slightly older model).

What is the value of the estimate of the contrast ?
A)-22.03
B)-16.85
C)6.49
D)11.67
Some summary measures for the four machines are given below. Suppose we are interested in the contrast that compares the average of machines 1,3,and 4 (the most recently purchased machines)to machine 2 (a slightly older model). What is the value of the estimate of the contrast ?
A)-22.03
B)-16.85
C)6.49
D)11.67
سؤال
A service center for electronic equipment is conducting a study on three of their technicians: Joe,John,and James.All three specialize in repairing computer drives.The study was performed to study the service time of fixing the computer drives.The manager of the service center wishes to assess if the average service times for the three technicians are equal: H0: 1 = 2 = 3.Each technician was given a random sample of computer drives,and the service time for each was recorded.The ANOVA table and descriptive statistics are given below.  At the 5% significance level,would we reject the null hypothesis?
A)Yes
B)No
C)This cannot be determined from the information given.
At the 5% significance level,would we reject the null hypothesis?A)Yes
B)No
C)This cannot be determined from the information given.
سؤال
A service center for electronic equipment is conducting a study on three of their technicians: Joe,John,and James.All three specialize in repairing computer drives.The study was performed to study the service time of fixing the computer drives.The manager of the service center wishes to assess if the average service times for the three technicians are equal: H0: 1 = 2 = 3.Each technician was given a random sample of computer drives,and the service time for each was recorded.The ANOVA table and descriptive statistics are given below. 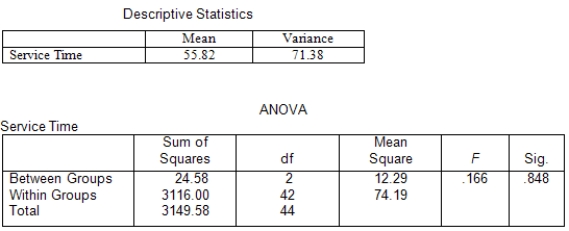 What is the value of the coefficient of determination R2?
A)0.0078
B)0.166
C)0.848
D)0.992
What is the value of the coefficient of determination R2?A)0.0078
B)0.166
C)0.848
D)0.992
سؤال
At a large automobile factory,four different machines are used to produce disc brakes.To make sure that the disc brakes are all being produced with comparable diameters,daily samples of 16 disc brakes are taken from the production lines of each of the four machines and their diameters measured.The deviation from the goal diameter of 322 micrometers is measured to the nearest micrometer.Assume that the distribution of these deviations is approximately Normal with a common standard deviation.Does it appear that disc brakes made on the four machines are made with equal mean diameters? SPSS output is included below.  Some summary measures for the four machines are given below.
  Suppose we are interested in the contrast that compares the average of machines 1,3,and 4 (the most recently purchased machines)to machine 2 (a slightly older model).
Do the data show evidence of a violation of the assumption that the four populations have the same standard deviation?
A)Yes,because 124.47/48.84 is greater than 2
B)Yes,because the variation decreases when we move from machine 1 to machine 4
C)No,because 11.16/6.99 is smaller than 2
D)No,because the sample sizes are all equal
Some summary measures for the four machines are given below. Suppose we are interested in the contrast that compares the average of machines 1,3,and 4 (the most recently purchased machines)to machine 2 (a slightly older model). Do the data show evidence of a violation of the assumption that the four populations have the same standard deviation?
A)Yes,because 124.47/48.84 is greater than 2
B)Yes,because the variation decreases when we move from machine 1 to machine 4
C)No,because 11.16/6.99 is smaller than 2
D)No,because the sample sizes are all equal
سؤال
At a large automobile factory,four different machines are used to produce disc brakes.To make sure that the disc brakes are all being produced with comparable diameters,daily samples of 16 disc brakes are taken from the production lines of each of the four machines and their diameters measured.The deviation from the goal diameter of 322 micrometers is measured to the nearest micrometer.Assume that the distribution of these deviations is approximately Normal with a common standard deviation.Does it appear that disc brakes made on the four machines are made with equal mean diameters? SPSS output is included below.  At the 5% significance level,do we reject the null hypothesis of equality of the four population means?
A)Yes
B)No
C)This cannot be determined from the information given.
At the 5% significance level,do we reject the null hypothesis of equality of the four population means?A)Yes
B)No
C)This cannot be determined from the information given.
سؤال
Independent random samples of households in the four U.S.regions (Northeast,Midwest,South,and West)yielded data on last year's energy consumption.We are interested in assessing,at the 1% significance level,if the data provide sufficient evidence to conclude that last year's average energy consumption was different among the four U.S.regions.Assume that energy consumption in the four regions is Normally distributed.
SPSS was used to create the side-by-side boxplots shown below. Based on the boxplots,does it seem like the assumption is satisfied? Explain briefly.
SPSS was used to create the side-by-side boxplots shown below.
Based on the boxplots,does it seem like the assumption is satisfied? Explain briefly. سؤال
At a large automobile factory,four different machines are used to produce disc brakes.To make sure that the disc brakes are all being produced with comparable diameters,daily samples of 16 disc brakes are taken from the production lines of each of the four machines and their diameters measured.The deviation from the goal diameter of 322 micrometers is measured to the nearest micrometer.Assume that the distribution of these deviations is approximately Normal with a common standard deviation.Does it appear that disc brakes made on the four machines are made with equal mean diameters? SPSS output is included below. 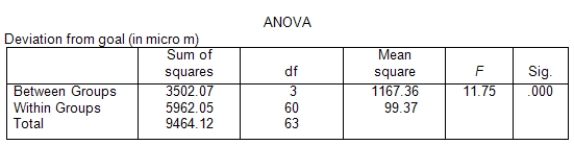 Some summary measures for the four machines are given below.
  Suppose we are interested in the contrast that compares the average of machines 1,3,and 4 (the most recently purchased machines)to machine 2 (a slightly older model).

SPSS output for multiple comparisons is given below,using the Bonferroni method with = 0.05.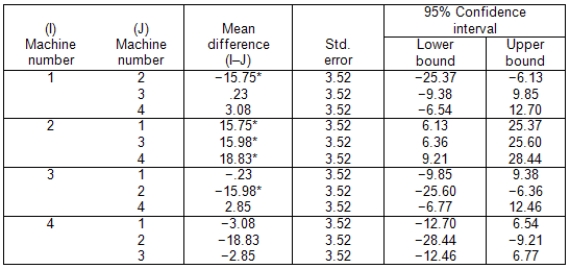 What is the correct conclusion based on these comparisons?
A)Machine 1 seems to give different results from Machine 2.Machines 3 and 4 appear indistinguishable.
B)Machine 2 seems to give different results from all other machines.Machines 1,3,and 4 appear indistinguishable.
C)Machine 2 seems to be doing much better than the other three machines.
D)None of the above
Some summary measures for the four machines are given below. Suppose we are interested in the contrast that compares the average of machines 1,3,and 4 (the most recently purchased machines)to machine 2 (a slightly older model). SPSS output for multiple comparisons is given below,using the Bonferroni method with = 0.05.
What is the correct conclusion based on these comparisons?A)Machine 1 seems to give different results from Machine 2.Machines 3 and 4 appear indistinguishable.
B)Machine 2 seems to give different results from all other machines.Machines 1,3,and 4 appear indistinguishable.
C)Machine 2 seems to be doing much better than the other three machines.
D)None of the above
سؤال
At a large automobile factory,four different machines are used to produce disc brakes.To make sure that the disc brakes are all being produced with comparable diameters,daily samples of 16 disc brakes are taken from the production lines of each of the four machines and their diameters measured.The deviation from the goal diameter of 322 micrometers is measured to the nearest micrometer.Assume that the distribution of these deviations is approximately Normal with a common standard deviation.Does it appear that disc brakes made on the four machines are made with equal mean diameters? SPSS output is included below.  Some summary measures for the four machines are given below.
  Suppose we are interested in the contrast that compares the average of machines 1,3,and 4 (the most recently purchased machines)to machine 2 (a slightly older model).

What is a 95% confidence interval for the contrast ?
A)(-33.41,-0.29)
B)(-22.61,-11.09)
C)(5.91,17.43)
D)(12.04,21.66)
Some summary measures for the four machines are given below. Suppose we are interested in the contrast that compares the average of machines 1,3,and 4 (the most recently purchased machines)to machine 2 (a slightly older model). What is a 95% confidence interval for the contrast ?
A)(-33.41,-0.29)
B)(-22.61,-11.09)
C)(5.91,17.43)
D)(12.04,21.66)

فتح الحزمة
قم بالتسجيل لفتح البطاقات في هذه المجموعة!
Unlock Deck
Unlock Deck
1/74
العب
ملء الشاشة (f)
Deck 12: One-Way Analysis of Variance
1
A study compares three population means.Three independent samples with 15 observations each are taken.The SSE = 1246 and the SST = 1600.What is the value of the F statistic?
A)1.11
B)3.32
C)4.98
D)5.97
A)1.11
B)3.32
C)4.98
D)5.97
5.97
2
A storeowner wishes to compare the average amount of money high school and college students spend on music downloads.He randomly selects 10 students from three different student populations: high school,undergraduate,and graduate.The statistical assumptions required to perform a one-way ANOVA to compare the means of these three groups are reasonable based on the data.A partially completed ANOVA table is provided below. What is the value of the F statistic?
A)3.36
B)3.73
C)5.04
D)5.99
What is the value of the F statistic?A)3.36
B)3.73
C)5.04
D)5.99
5.04
3
A storeowner wishes to compare the average amount of money high school and college students spend on music downloads.He randomly selects 10 students from three different student populations: high school,undergraduate,and graduate.The statistical assumptions required to perform a one-way ANOVA to compare the means of these three groups are reasonable based on the data.A partially completed ANOVA table is provided below. What is the value of the pooled standard deviation?
A)10.95
B)24.60
C)56.92
D)120
What is the value of the pooled standard deviation?A)10.95
B)24.60
C)56.92
D)120
10.95
4
A realtor wishes to assess whether a difference exists between home prices in three subdivisions.Independent samples of homes from each of the three subdivisions are obtained and their prices are recorded.The analysis of variance results for comparing these prices are provided below. How many homes were sampled in total?
A)15
B)17
C)18
D)19
How many homes were sampled in total?A)15
B)17
C)18
D)19
فتح الحزمة
افتح القفل للوصول البطاقات البالغ عددها 74 في هذه المجموعة.
فتح الحزمة
k this deck
5
A storeowner wishes to compare the average amount of money high school and college students spend on music downloads.He randomly selects 10 students from three different student populations: high school,undergraduate,and graduate.The statistical assumptions required to perform a one-way ANOVA to compare the means of these three groups are reasonable based on the data.A partially completed ANOVA table is provided below. At the 1% significance level,would we reject the null hypothesis?
A)Yes
B)No
C)This cannot be determined from the information given.
At the 1% significance level,would we reject the null hypothesis?A)Yes
B)No
C)This cannot be determined from the information given.
فتح الحزمة
افتح القفل للوصول البطاقات البالغ عددها 74 في هذه المجموعة.
فتح الحزمة
k this deck
6
A study compares four groups with six observations in each group.How large does the F statistic need to be for rejecting the null hypothesis at the 5% significance level?
A)2.78
B)2.87
C)3.01
D)3.10
A)2.78
B)2.87
C)3.01
D)3.10
فتح الحزمة
افتح القفل للوصول البطاقات البالغ عددها 74 في هذه المجموعة.
فتح الحزمة
k this deck
7
A realtor wishes to assess whether a difference exists between home prices in three subdivisions.Independent samples of homes from each of the three subdivisions are obtained and their prices are recorded.The analysis of variance results for comparing these prices are provided below. What can we say about the P-value for this F test?
A)P-value < 0.01
B)0.01 < P-value < 0.025
C)0.025 < P-value < 0.05
D)0.05 < P-value < 0.10
What can we say about the P-value for this F test?A)P-value < 0.01
B)0.01 < P-value < 0.025
C)0.025 < P-value < 0.05
D)0.05 < P-value < 0.10
فتح الحزمة
افتح القفل للوصول البطاقات البالغ عددها 74 في هذه المجموعة.
فتح الحزمة
k this deck
8
A study was conducted to compare five different training programs for improving endurance.Forty subjects were randomly divided into five groups of eight subjects in each group.A different training program was assigned to each group.After 2 months,the improvement in endurance was recorded for each subject.A one-way ANOVA is used to compare the five training programs,and the resulting F statistic is 3.69. What can we say about the P-value for this F test?
A)P-value < 0.01
B)0.01 < P-value < 0.025
C)0.025 < P-value < 0.05
D)0.05 < P-value < 0.10
A)P-value < 0.01
B)0.01 < P-value < 0.025
C)0.025 < P-value < 0.05
D)0.05 < P-value < 0.10
فتح الحزمة
افتح القفل للوصول البطاقات البالغ عددها 74 في هذه المجموعة.
فتح الحزمة
k this deck
9
A study was conducted to compare five different training programs for improving endurance.Forty subjects were randomly divided into five groups of eight subjects in each group.A different training program was assigned to each group.After 2 months,the improvement in endurance was recorded for each subject.A one-way ANOVA is used to compare the five training programs,and the resulting F statistic is 3.69. At a significance level of 0.05,what is the appropriate conclusion about mean improvement in endurance?
A)The average amount of improvement appears to be the same for all five training programs.
B)The average amount of improvement appears to be different for each of the five training programs.
C)It appears that at least one of the five training programs has a different average amount of improvement.
D)One training program is significantly better than the other four.
فتح الحزمة
افتح القفل للوصول البطاقات البالغ عددها 74 في هذه المجموعة.
فتح الحزمة
k this deck
10
In a study comparing four groups with six observations in each group,the MSE = 487 and the MSG = 3456.What is the value of the coefficient of determination?
A)0.484
B)0.516
C)0.587
D)0.939
A)0.484
B)0.516
C)0.587
D)0.939
فتح الحزمة
افتح القفل للوصول البطاقات البالغ عددها 74 في هذه المجموعة.
فتح الحزمة
k this deck
11
In a study on scholastic test scores of entering college freshmen,a random sample of colleges across the nation is selected and the average SAT Math score for the freshman class is recorded.The colleges are categorized according to their affiliation: public,private,or church.Does it appear that freshmen entering the three different types of schools do equally well on the SAT Math? Computer output is included below. How many colleges were included in the study?
A)3
B)63
C)65
D)66
How many colleges were included in the study?A)3
B)63
C)65
D)66
فتح الحزمة
افتح القفل للوصول البطاقات البالغ عددها 74 في هذه المجموعة.
فتح الحزمة
k this deck
12
In a study on scholastic test scores of entering college freshmen,a random sample of colleges across the nation is selected and the average SAT Math score for the freshman class is recorded.The colleges are categorized according to their affiliation: public,private,or church.Does it appear that freshmen entering the three different types of schools do equally well on the SAT Math? Computer output is included below. Under the null hypothesis of equality of population means,what is the distribution of the test statistic?
A)F(2,63)
B)F(2,65)
C)N(0,3)
D)t(63)
Under the null hypothesis of equality of population means,what is the distribution of the test statistic?A)F(2,63)
B)F(2,65)
C)N(0,3)
D)t(63)
فتح الحزمة
افتح القفل للوصول البطاقات البالغ عددها 74 في هذه المجموعة.
فتح الحزمة
k this deck
13
A study was conducted to compare five different training programs for improving endurance.Forty subjects were randomly divided into five groups of eight subjects in each group.A different training program was assigned to each group.After 2 months,the improvement in endurance was recorded for each subject.A one-way ANOVA is used to compare the five training programs,and the resulting F statistic is 3.69. Which distribution was used to find the P-value?
A)F(4,3)
B)F(5,8)
C)F(4,35)
D)t(39)
A)F(4,3)
B)F(5,8)
C)F(4,35)
D)t(39)
فتح الحزمة
افتح القفل للوصول البطاقات البالغ عددها 74 في هذه المجموعة.
فتح الحزمة
k this deck
14
A study compares six groups with five observations in each group.An F statistic of 4.012 is reported.What can we say about the P-value for this F test?
A)P-value < 0.001
B)0.001 < P-value < 0.005
C)0.005 < P-value < 0.01
D)0.01 < P-value < 0.05
A)P-value < 0.001
B)0.001 < P-value < 0.005
C)0.005 < P-value < 0.01
D)0.01 < P-value < 0.05
فتح الحزمة
افتح القفل للوصول البطاقات البالغ عددها 74 في هذه المجموعة.
فتح الحزمة
k this deck
15
A realtor wishes to assess whether a difference exists between home prices in three subdivisions.Independent samples of homes from each of the three subdivisions are obtained and their prices are recorded.The analysis of variance results for comparing these prices are provided below. Under the null hypothesis of equality of population means,what is the appropriate distribution for the test statistic?
A)F(2,15)
B)F(2,17)
C)N( , )
D)t(15)
Under the null hypothesis of equality of population means,what is the appropriate distribution for the test statistic?A)F(2,15)
B)F(2,17)
C)N( , )
D)t(15)
فتح الحزمة
افتح القفل للوصول البطاقات البالغ عددها 74 في هذه المجموعة.
فتح الحزمة
k this deck
16
In a study on scholastic test scores of entering college freshmen,a random sample of colleges across the nation is selected and the average SAT Math score for the freshman class is recorded.The colleges are categorized according to their affiliation: public,private,or church.Does it appear that freshmen entering the three different types of schools do equally well on the SAT Math? Computer output is included below. The value of the F statistic in the ANOVA table is reported as 5.696.The value of the corresponding P-value is 0.005.If we were to draw the F distribution and mark the value of 5.696 on the x axis,how would we indicate the P-value in the graph?
A)The area under the curve to the left of 5.696
B)The area under the curve to the right of 5.696
C)The area under the curve to the right of 5.696 and to the left of 0.176
D)This cannot be determined from the information given.
The value of the F statistic in the ANOVA table is reported as 5.696.The value of the corresponding P-value is 0.005.If we were to draw the F distribution and mark the value of 5.696 on the x axis,how would we indicate the P-value in the graph?A)The area under the curve to the left of 5.696
B)The area under the curve to the right of 5.696
C)The area under the curve to the right of 5.696 and to the left of 0.176
D)This cannot be determined from the information given.
فتح الحزمة
افتح القفل للوصول البطاقات البالغ عددها 74 في هذه المجموعة.
فتح الحزمة
k this deck
17
A storeowner wishes to compare the average amount of money high school and college students spend on music downloads.He randomly selects 10 students from three different student populations: high school,undergraduate,and graduate.The statistical assumptions required to perform a one-way ANOVA to compare the means of these three groups are reasonable based on the data.A partially completed ANOVA table is provided below. What are the degrees of freedom for the F statistic?
A)2 and 10
B)2 and 27
C)3 and 27
D)3 and 30
What are the degrees of freedom for the F statistic?A)2 and 10
B)2 and 27
C)3 and 27
D)3 and 30
فتح الحزمة
افتح القفل للوصول البطاقات البالغ عددها 74 في هذه المجموعة.
فتح الحزمة
k this deck
18
A realtor wishes to assess whether a difference exists between home prices in three subdivisions.Independent samples of homes from each of the three subdivisions are obtained and their prices are recorded.The analysis of variance results for comparing these prices are provided below. What is the value of the estimate of the common population standard deviation of the populations of home prices in the three subdivisions?
A)4.11
B)8.87
C)16.90
D)78.72
What is the value of the estimate of the common population standard deviation of the populations of home prices in the three subdivisions?A)4.11
B)8.87
C)16.90
D)78.72
فتح الحزمة
افتح القفل للوصول البطاقات البالغ عددها 74 في هذه المجموعة.
فتح الحزمة
k this deck
19
A realtor wishes to assess whether a difference exists between home prices in three subdivisions.Independent samples of homes from each of the three subdivisions are obtained and their prices are recorded.The analysis of variance results for comparing these prices are provided below. Under the null hypothesis of equality of population means,what is the appropriate assumption for the distribution for home prices in the three populations?
A)F(2,15)
B)F(2,17)
C)N( , )
D)t(15)
Under the null hypothesis of equality of population means,what is the appropriate assumption for the distribution for home prices in the three populations?A)F(2,15)
B)F(2,17)
C)N( , )
D)t(15)
فتح الحزمة
افتح القفل للوصول البطاقات البالغ عددها 74 في هذه المجموعة.
فتح الحزمة
k this deck
20
A study compares five groups with 10 observations in each group.An F statistic of 3.75 is reported.What are the degrees of freedom for this F statistic?
A)4 and 45
B)4 and 46
C)5 and 10
D)5 and 50
A)4 and 45
B)4 and 46
C)5 and 10
D)5 and 50
فتح الحزمة
افتح القفل للوصول البطاقات البالغ عددها 74 في هذه المجموعة.
فتح الحزمة
k this deck
21
Which of the following statements about the one-way analysis of variance model and/or procedures is/are FALSE?
A)The ANOVA procedures are not extremely sensitive to unequal standard deviations.
B)As a general rule,if the largest standard deviation is less than twice the smallest standard deviation,the use of the ANOVA procedures assuming equal standard deviations will give results that are approximately correct.
C)Under the null hypothesis,H0:
,the statistic
Has the F(I - 1,N - I)distribution.
D)The P-value of the F test is two times the probability that a random variable having the F(I - 1,N - I)distribution is greater than or equal to the calculated value of the F statistic.
E)The observations in the experiment or samples must be Normally distributed.
فتح الحزمة
افتح القفل للوصول البطاقات البالغ عددها 74 في هذه المجموعة.
فتح الحزمة
k this deck
22
Wild horse populations on federal lands have been protected since 1971.Since that time,the populations have grown large and need to be managed and kept to a supportable size.Management of the mustang population has been a controversial issue;one common method is periodic removal of the horses.Researchers were curious if a new method would work better.In 1985,12 horses were rounded up and male horses in the group of 12 were treated.The number of foals in each group of 12 horses for 3 years was recorded.Year 1 was prior to treatment,year 2 was the year the treatment was applied,and year 3 was 1 year after treatment.The average number of foals per group along with the standard deviation is given in the table below. The researchers did an ANOVA F test of the data and obtained the following results. For this example,which of the following conclusions is most reasonable?
A)There is moderate evidence that the treatment is effective in reducing herd size for about 1 year,but then the effect appears to wear off.
B)An ANOVA F test is not appropriate for these data.The assumptions needed for the F test to be valid are not all satisfied.
C)The data provide strong evidence that the mean number of foals for the populations represented by the 3 years differ.
D)The data appear to provide little or no evidence that the treatment is effective in reducing herd size.
The researchers did an ANOVA F test of the data and obtained the following results. For this example,which of the following conclusions is most reasonable?A)There is moderate evidence that the treatment is effective in reducing herd size for about 1 year,but then the effect appears to wear off.
B)An ANOVA F test is not appropriate for these data.The assumptions needed for the F test to be valid are not all satisfied.
C)The data provide strong evidence that the mean number of foals for the populations represented by the 3 years differ.
D)The data appear to provide little or no evidence that the treatment is effective in reducing herd size.
فتح الحزمة
افتح القفل للوصول البطاقات البالغ عددها 74 في هذه المجموعة.
فتح الحزمة
k this deck
23
Which of the following statements about one-way analysis of variance is/are TRUE?
A)When the null hypothesis that the means are all the same is rejected using the ANOVA,we can then conclude that all the means are different from one another.
B)Once the data obtained from an experiment have been analyzed using the ANOVA,we can then develop questions suggested from the analysis about some of the means that can be tested using contrasts.
C)Multiple-comparison procedures can be useful for determining which pairs of population means differ significantly.
D)The square of the two-sample t statistic for comparing the means of two populations is always equal to the ANOVA F statistic.
E)The only crucial assumption that must be made for the one-way analysis of variance is that the data follow the F distribution.
فتح الحزمة
افتح القفل للوصول البطاقات البالغ عددها 74 في هذه المجموعة.
فتح الحزمة
k this deck
24
Wild horse populations on federal lands have been protected since 1971.Since that time,the populations have grown large and need to be managed and kept to a supportable size.Management of the mustang population has been a controversial issue;one common method is periodic removal of the horses.Researchers were curious if a new method would work better.In 1985,12 horses were rounded up and male horses in the group of 12 were treated.The number of foals in each group of 12 horses for 3 years was recorded.Year 1 was prior to treatment,year 2 was the year the treatment was applied,and year 3 was 1 year after treatment.The average number of foals per group along with the standard deviation is given in the table below. The researchers did an ANOVA F test of the data and obtained the following results. What can we say about the P-value for this F test?
A)P-value < 0.01
B)0.01 < P-value < 0.05
C)0.05 < P-value < 0.10
D)P-value > 0.10
The researchers did an ANOVA F test of the data and obtained the following results. What can we say about the P-value for this F test?A)P-value < 0.01
B)0.01 < P-value < 0.05
C)0.05 < P-value < 0.10
D)P-value > 0.10
فتح الحزمة
افتح القفل للوصول البطاقات البالغ عددها 74 في هذه المجموعة.
فتح الحزمة
k this deck
25
Which of the following statements about the one-way ANOVA table is/are TRUE?
A)Sums of squares represent variation present in the data,and they are calculated by summing squared deviations.
B)There are three distinct sources of variation represented in the table: groups,error,and total.
C)The sum of squares for total (SST)is composed of two parts,one due to groups (SSG)and one due to error (SSE).
D)Mean squares are calculated by dividing the corresponding sum of squares by its degrees of freedom.
E)All of the above are true.
فتح الحزمة
افتح القفل للوصول البطاقات البالغ عددها 74 في هذه المجموعة.
فتح الحزمة
k this deck
26
Which of the following statements about the analysis of variance (ANOVA)is/are FALSE?
A)The ANOVA methods can be applied to data from random samples and to data from randomized experiments.
B)The purpose of the ANOVA is to assess whether the observed differences among sample means are statistically significant.
C)The ANOVA compares the variation among the means of several groups with the variation within the groups.
D)All of the above are true statements about the ANOVA.
E)Only A and B are true statements about the ANOVA.
فتح الحزمة
افتح القفل للوصول البطاقات البالغ عددها 74 في هذه المجموعة.
فتح الحزمة
k this deck
27
Battery life of tablet computers is of great concern to customers.A consumer group has tested four brands of such tablets to determine the battery life.Samples of tablets of each brand were fully charged and left to run until the battery died.The number of hours that each tablet lasted was recorded.The following graphs and tables from the analysis of the data are provided.(Note: Some entries have been omitted and replaced with **.) To test the ANOVA null hypothesis H0: ,what are the test statistic and its associated P-value?
A)F(3,50)= 3.28;0.01 < P < 0.025
B)F(3,50)= 2.91;0.02 < P < 0.05
C)F(4,49)= 3.28;0.01 < P < 0.025
D)F(3,50)= 3.28;0.025 < P < 0.05
E)F(4,50)= 2.91;0.025 < P < 0.05
To test the ANOVA null hypothesis H0: ,what are the test statistic and its associated P-value?A)F(3,50)= 3.28;0.01 < P < 0.025
B)F(3,50)= 2.91;0.02 < P < 0.05
C)F(4,49)= 3.28;0.01 < P < 0.025
D)F(3,50)= 3.28;0.025 < P < 0.05
E)F(4,50)= 2.91;0.025 < P < 0.05
فتح الحزمة
افتح القفل للوصول البطاقات البالغ عددها 74 في هذه المجموعة.
فتح الحزمة
k this deck
28
Quality ratings of a new line of take-home refrigerated entrées were obtained from three randomly formed groups of customers who were exposed to different types of advertisements about the product.One group,with 55 customers,saw ads that were designed to undermine their expected positive association of quality with advertisements;a second group of 36 customers saw ads that were designed to affirm their positive association of quality with advertisements;the third group with 36 subjects served as the control group.The following is the ANOVA table obtained from the data in the study.(Some entries have been replaced by **.) The degrees of freedom for total,groups,and error are,respectively,
A)DFT = 127;DFG = 3;and DFE = 124.
B)DFT = 127;DFG = 2;and DFE = 125.
C)DFT = 126;DFG = 3;and DFE = 123.
D)DFT = 126;DFG = 2;and DFE = 124.
E)This cannot be determined with the information given.
The degrees of freedom for total,groups,and error are,respectively,A)DFT = 127;DFG = 3;and DFE = 124.
B)DFT = 127;DFG = 2;and DFE = 125.
C)DFT = 126;DFG = 3;and DFE = 123.
D)DFT = 126;DFG = 2;and DFE = 124.
E)This cannot be determined with the information given.
فتح الحزمة
افتح القفل للوصول البطاقات البالغ عددها 74 في هذه المجموعة.
فتح الحزمة
k this deck
29
Which of the following statements about the one-way ANOVA model for i = 1,…,I and j = 1,…,
Is/are FALSE?
A)The
Are Normally distributed.
B)The
Have a mean of 0 and a standard deviation of
,i = 1,…,I.
C)The parameters of the model are the population means
,
,…,
And .
D)The
Represent the jth observation from the ith population,which has mean
.
E)The
Are the deviations of the observations from the means and represent the random variation part of the model.
for i = 1,…,I and j = 1,…, Is/are FALSE?
A)The
Are Normally distributed.
B)The
Have a mean of 0 and a standard deviation of
,i = 1,…,I.
C)The parameters of the model are the population means
,
,…,
And .
D)The
Represent the jth observation from the ith population,which has mean
.
E)The
Are the deviations of the observations from the means and represent the random variation part of the model.
فتح الحزمة
افتح القفل للوصول البطاقات البالغ عددها 74 في هذه المجموعة.
فتح الحزمة
k this deck
30
Which of the following statements about the sums of squares associated with the analysis of variance is/are FALSE?
A)The total variation in the data is always equal to the among-group variation minus the within-group variation.
B)SSG measures the variation of the group means around the overall mean,
.
C)SSE measures the variation of each observation around its group mean,
.
D)SST measures variation of the data around the overall mean,
.
E)SST = SSG + SSE
A)The total variation in the data is always equal to the among-group variation minus the within-group variation.
B)SSG measures the variation of the group means around the overall mean,
.
C)SSE measures the variation of each observation around its group mean,
.
D)SST measures variation of the data around the overall mean,
.
E)SST = SSG + SSE
فتح الحزمة
افتح القفل للوصول البطاقات البالغ عددها 74 في هذه المجموعة.
فتح الحزمة
k this deck
31
Wild horse populations on federal lands have been protected since 1971.Since that time,the populations have grown large and need to be managed and kept to a supportable size.Management of the mustang population has been a controversial issue;one common method is periodic removal of the horses.Researchers were curious if a new method would work better.In 1985,12 horses were rounded up and male horses in the group of 12 were treated.The number of foals in each group of 12 horses for 3 years was recorded.Year 1 was prior to treatment,year 2 was the year the treatment was applied,and year 3 was 1 year after treatment.The average number of foals per group along with the standard deviation is given in the table below. The researchers did an ANOVA F test of the data and obtained the following results. What are the degrees of freedom for the F statistic?
A)2 and 33
B)2 and 36
C)3 and 33
D)3 and 35
The researchers did an ANOVA F test of the data and obtained the following results. What are the degrees of freedom for the F statistic?A)2 and 33
B)2 and 36
C)3 and 33
D)3 and 35
فتح الحزمة
افتح القفل للوصول البطاقات البالغ عددها 74 في هذه المجموعة.
فتح الحزمة
k this deck
32
Which of the following concerning the ANOVA model,procedures,and table is/are FALSE?
A)The unbiased estimator of the common variance
Is given by
,where
.
B)The mean square for total is given by MST = MSE + MSE.
C)The coefficient of determination is
.
D)The degrees of freedom for error can be found from DFE = DFT - DFG.
E)The pooled estimate of is
.
A)The unbiased estimator of the common variance
Is given by
,where
.
B)The mean square for total is given by MST = MSE + MSE.
C)The coefficient of determination is
.
D)The degrees of freedom for error can be found from DFE = DFT - DFG.
E)The pooled estimate of is
.
فتح الحزمة
افتح القفل للوصول البطاقات البالغ عددها 74 في هذه المجموعة.
فتح الحزمة
k this deck
33
Battery life of tablet computers is of great concern to customers.A consumer group has tested four brands of such tablets to determine the battery life.Samples of tablets of each brand were fully charged and left to run until the battery died.The number of hours that each tablet lasted was recorded.The following graphs and tables from the analysis of the data are provided.(Note: Some entries have been omitted and replaced with **.) If one wanted to calculate the SST from the data,the value of the overall mean needs to be determined.Using the above information,what is the value of the overall mean?
A)26.13
B)26.10
C)25.23
D)24.16
E)This cannot be determined without knowing the individual data values.
If one wanted to calculate the SST from the data,the value of the overall mean needs to be determined.Using the above information,what is the value of the overall mean?A)26.13
B)26.10
C)25.23
D)24.16
E)This cannot be determined without knowing the individual data values.
فتح الحزمة
افتح القفل للوصول البطاقات البالغ عددها 74 في هذه المجموعة.
فتح الحزمة
k this deck
34
Quality ratings of a new line of take-home refrigerated entrées were obtained from three randomly formed groups of customers who were exposed to different types of advertisements about the product.One group,with 55 customers,saw ads that were designed to undermine their expected positive association of quality with advertisements;a second group of 36 customers saw ads that were designed to affirm their positive association of quality with advertisements;the third group with 36 subjects served as the control group.The following is the ANOVA table obtained from the data in the study.(Some entries have been replaced by **.) What is the estimate of the common population standard deviation ?
A)
= 3.068
B)
= 0.785
C)
= 8.740
D)
= 0.616
E)This cannot be determined with the information given.
What is the estimate of the common population standard deviation ?A)
= 3.068
B)
= 0.785
C)
= 8.740
D)
= 0.616
E)This cannot be determined with the information given.
فتح الحزمة
افتح القفل للوصول البطاقات البالغ عددها 74 في هذه المجموعة.
فتح الحزمة
k this deck
35
In a study on scholastic test scores of entering college freshmen,a random sample of colleges across the nation is selected and the average SAT Math score for the freshman class is recorded.The colleges are categorized according to their affiliation: public,private,or church.Does it appear that freshmen entering the three different types of schools do equally well on the SAT Math? Computer output is included below. At a significance level of 0.05,what is the appropriate conclusion about the average SAT Math scores?
A)The average SAT Math scores for freshmen attending colleges with the three different affiliations appear to be the same.
B)Each of the three average SAT Math scores for freshmen attending colleges with the three different affiliations appears to be different.
C)It appears that freshmen attending at least one of the three different types of college have a different average SAT Math score.
D)Freshmen at one type of affiliated college have a significantly better average SAT Math score than the other two.
At a significance level of 0.05,what is the appropriate conclusion about the average SAT Math scores?A)The average SAT Math scores for freshmen attending colleges with the three different affiliations appear to be the same.
B)Each of the three average SAT Math scores for freshmen attending colleges with the three different affiliations appears to be different.
C)It appears that freshmen attending at least one of the three different types of college have a different average SAT Math score.
D)Freshmen at one type of affiliated college have a significantly better average SAT Math score than the other two.
فتح الحزمة
افتح القفل للوصول البطاقات البالغ عددها 74 في هذه المجموعة.
فتح الحزمة
k this deck
36
Battery life of tablet computers is of great concern to customers.A consumer group has tested four brands of such tablets to determine the battery life.Samples of tablets of each brand were fully charged and left to run until the battery died.The number of hours that each tablet lasted was recorded.The following graphs and tables from the analysis of the data are provided.(Note: Some entries have been omitted and replaced with **.) What conclusion might you reach based on these analyses?
A)There is no evidence to suggest that the null hypothesis should be rejected.
B)There is evidence to support the conclusion that all the population means are different.
C)There is sufficient evidence to conclude that the sample means are not equal.
D)There is sufficient evidence to conclude that not all the population means are equal.
E)It would be dangerous to conclude anything because the sample sizes are small and some of the ANOVA assumptions are not satisfied.
What conclusion might you reach based on these analyses?A)There is no evidence to suggest that the null hypothesis should be rejected.
B)There is evidence to support the conclusion that all the population means are different.
C)There is sufficient evidence to conclude that the sample means are not equal.
D)There is sufficient evidence to conclude that not all the population means are equal.
E)It would be dangerous to conclude anything because the sample sizes are small and some of the ANOVA assumptions are not satisfied.
فتح الحزمة
افتح القفل للوصول البطاقات البالغ عددها 74 في هذه المجموعة.
فتح الحزمة
k this deck
37
Quality ratings of a new line of take-home refrigerated entrées were obtained from three randomly formed groups of customers who were exposed to different types of advertisements about the product.One group,with 55 customers,saw ads that were designed to undermine their expected positive association of quality with advertisements;a second group of 36 customers saw ads that were designed to affirm their positive association of quality with advertisements;the third group with 36 subjects served as the control group.The following is the ANOVA table obtained from the data in the study.(Some entries have been replaced by **.) What is the value of the F statistic for testing that the three group means are equal?
A)15.28
B)10.19
C)4.06
D)7.15
E)Not within ± 1 of any of the above
What is the value of the F statistic for testing that the three group means are equal?A)15.28
B)10.19
C)4.06
D)7.15
E)Not within ± 1 of any of the above
فتح الحزمة
افتح القفل للوصول البطاقات البالغ عددها 74 في هذه المجموعة.
فتح الحزمة
k this deck
38
Battery life of tablet computers is of great concern to customers.A consumer group has tested four brands of such tablets to determine the battery life.Samples of tablets of each brand were fully charged and left to run until the battery died.The number of hours that each tablet lasted was recorded.The following graphs and tables from the analysis of the data are provided.(Note: Some entries have been omitted and replaced with **.) How many degrees of freedom are there for error (DFE),and what is the value of the MSE?
A)DFE = 51;MSE = 10.65
B)DFE = 49;MSE = 11.09
C)DFE = 51;MSE = 10.87
D)DFE = 50;MSE = 12.27
E)DFE = 50;MSE = 10.87
How many degrees of freedom are there for error (DFE),and what is the value of the MSE?A)DFE = 51;MSE = 10.65
B)DFE = 49;MSE = 11.09
C)DFE = 51;MSE = 10.87
D)DFE = 50;MSE = 12.27
E)DFE = 50;MSE = 10.87
فتح الحزمة
افتح القفل للوصول البطاقات البالغ عددها 74 في هذه المجموعة.
فتح الحزمة
k this deck
39
Battery life of tablet computers is of great concern to customers.A consumer group has tested four brands of such tablets to determine the battery life.Samples of tablets of each brand were fully charged and left to run until the battery died.The number of hours that each tablet lasted was recorded.The following graphs and tables from the analysis of the data are provided.(Note: Some entries have been omitted and replaced with **.) What conclusion might one draw by looking at the side-by-side boxplots?
A)The ANOVA assumption of Normality of the data is satisfied.
B)The population means certainly are different.
C)There is insufficient data to justify reaching any conclusion here.
D)There is different variability from brand-to-brand but not enough difference to raise concern about the common variance ANOVA assumption.
E)The consumer group should look at the Normal quantile plot to verify the common variance assumption.
What conclusion might one draw by looking at the side-by-side boxplots?A)The ANOVA assumption of Normality of the data is satisfied.
B)The population means certainly are different.
C)There is insufficient data to justify reaching any conclusion here.
D)There is different variability from brand-to-brand but not enough difference to raise concern about the common variance ANOVA assumption.
E)The consumer group should look at the Normal quantile plot to verify the common variance assumption.
فتح الحزمة
افتح القفل للوصول البطاقات البالغ عددها 74 في هذه المجموعة.
فتح الحزمة
k this deck
40
Battery life of tablet computers is of great concern to customers.A consumer group has tested four brands of such tablets to determine the battery life.Samples of tablets of each brand were fully charged and left to run until the battery died.The number of hours that each tablet lasted was recorded.The following graphs and tables from the analysis of the data are provided.(Note: Some entries have been omitted and replaced with **.) What is the value of the coefficient of determination, ?
A)0.835
B)0.406
C)0.165
D)0.197
E)Not within ± 0.01 of any of the above
What is the value of the coefficient of determination, ?A)0.835
B)0.406
C)0.165
D)0.197
E)Not within ± 0.01 of any of the above
فتح الحزمة
افتح القفل للوصول البطاقات البالغ عددها 74 في هذه المجموعة.
فتح الحزمة
k this deck
41
A service center for electronic equipment is conducting a study on three of their technicians: Joe,John,and James.All three specialize in repairing computer drives.The study was performed to study the service time of fixing the computer drives.The manager of the service center wishes to assess if the average service times for the three technicians are equal: H0: 1 = 2 = 3.Each technician was given a random sample of computer drives,and the service time for each was recorded.The ANOVA table and descriptive statistics are given below. Under the null hypothesis of equality of population means,what is the point estimate of the common mean?
A)0.166
B)12.29
C)24.58
D)55.82
Under the null hypothesis of equality of population means,what is the point estimate of the common mean?A)0.166
B)12.29
C)24.58
D)55.82
فتح الحزمة
افتح القفل للوصول البطاقات البالغ عددها 74 في هذه المجموعة.
فتح الحزمة
k this deck
42
At what age do babies learn to crawl? Does it take longer to learn in the winter when babies are often bundled in clothes that restrict their movement? Data were collected from parents who brought their babies into the University of Denver Infant Study Center to participate in one of a number of experiments between 1988 and 1991.Parents reported the birth month and the age at which their child was first able to creep or crawl a distance of 4 feet within 1 minute.The resulting data were grouped by month of birth: January,May,and September: Crawling age is given in weeks.Assume the data represent three independent simple random samples,one from each of the three populations consisting of babies born in that particular month,and that the populations of crawling ages have Normal distributions. A partial ANOVA table is given below. What are the degrees of freedom for the error term?
A)2
B)3
C)94
D)96
Crawling age is given in weeks.Assume the data represent three independent simple random samples,one from each of the three populations consisting of babies born in that particular month,and that the populations of crawling ages have Normal distributions. A partial ANOVA table is given below. What are the degrees of freedom for the error term?A)2
B)3
C)94
D)96
فتح الحزمة
افتح القفل للوصول البطاقات البالغ عددها 74 في هذه المجموعة.
فتح الحزمة
k this deck
43
A study on color brightness for different types of projectors involved three different brands: A,B,and C.The projectors were rated for color brightness (a higher score means brighter colors).Random samples of 15 of the ratings from each brand were taken.The SPSS output from the analysis is (partially)given below. The SPSS output for the contrast ,which compares the color brightness of B to the average of the other two brands,is given below. What is the P-value for testing if the color brightness of B is significantly higher than the average of the other two brands?
A)P-value = 0.004,because for performing a one-sided test we have to divide the reported P-value by 2.
B)P-value = 0.008,because that is the P-value reported in the output.
C)P-value = 0.016,because for performing a one-sided test we have to multiply the reported P-value by 2.
D)This cannot be determined without studying the actual data values.
The SPSS output for the contrast ,which compares the color brightness of B to the average of the other two brands,is given below. What is the P-value for testing if the color brightness of B is significantly higher than the average of the other two brands?A)P-value = 0.004,because for performing a one-sided test we have to divide the reported P-value by 2.
B)P-value = 0.008,because that is the P-value reported in the output.
C)P-value = 0.016,because for performing a one-sided test we have to multiply the reported P-value by 2.
D)This cannot be determined without studying the actual data values.
فتح الحزمة
افتح القفل للوصول البطاقات البالغ عددها 74 في هذه المجموعة.
فتح الحزمة
k this deck
44
A service center for electronic equipment is conducting a study on three of their technicians: Joe,John,and James.All three specialize in repairing computer drives.The study was performed to study the service time of fixing the computer drives.The manager of the service center wishes to assess if the average service times for the three technicians are equal: H0: 1 = 2 = 3.Each technician was given a random sample of computer drives,and the service time for each was recorded.The ANOVA table and descriptive statistics are given below. How many computer drives were included in the study?
A)42
B)43
C)44
D)45
How many computer drives were included in the study?A)42
B)43
C)44
D)45
فتح الحزمة
افتح القفل للوصول البطاقات البالغ عددها 74 في هذه المجموعة.
فتح الحزمة
k this deck
45
A study on color brightness for different types of projectors involved three different brands: A,B,and C.The projectors were rated for color brightness (a higher score means brighter colors).Random samples of 15 of the ratings from each brand were taken.The SPSS output from the analysis is (partially)given below. What is the value of the estimate of the common population variance?
A)9.054
B)47.854
C)95.707
D)380.263
What is the value of the estimate of the common population variance?A)9.054
B)47.854
C)95.707
D)380.263
فتح الحزمة
افتح القفل للوصول البطاقات البالغ عددها 74 في هذه المجموعة.
فتح الحزمة
k this deck
46
A study on color brightness for different types of projectors involved three different brands: A,B,and C.The projectors were rated for color brightness (a higher score means brighter colors).Random samples of 15 of the ratings from each brand were taken.The SPSS output from the analysis is (partially)given below. What are the degrees of freedom for the F statistic?
A)2 and 42
B)2 and 44
C)3 and 44
D)3 and 45
What are the degrees of freedom for the F statistic?A)2 and 42
B)2 and 44
C)3 and 44
D)3 and 45
فتح الحزمة
افتح القفل للوصول البطاقات البالغ عددها 74 في هذه المجموعة.
فتح الحزمة
k this deck
47
Bleaching chemicals are used in the pulp and paper industry to increase the brightness of the paper that is produced.Four chemical agents were studied to determine their effect on the brightness of paper produced from pulp treated with the chemical.The following tables provide some details obtained from the experimental data. The null hypothesis Ho: was established for the ANOVA.
What is the appropriate alternative hypothesis?
A)Ha:
B)Ha: none of the
Is equal to any other
C)Ha: all of the pairs of the
Are different
D)Ha: one of the
Is different from all the others
E)Ha: not all of the
Are equal
The null hypothesis Ho: was established for the ANOVA.What is the appropriate alternative hypothesis?
A)Ha:
B)Ha: none of the
Is equal to any other
C)Ha: all of the pairs of the
Are different
D)Ha: one of the
Is different from all the others
E)Ha: not all of the
Are equal
فتح الحزمة
افتح القفل للوصول البطاقات البالغ عددها 74 في هذه المجموعة.
فتح الحزمة
k this deck
48
At what age do babies learn to crawl? Does it take longer to learn in the winter when babies are often bundled in clothes that restrict their movement? Data were collected from parents who brought their babies into the University of Denver Infant Study Center to participate in one of a number of experiments between 1988 and 1991.Parents reported the birth month and the age at which their child was first able to creep or crawl a distance of 4 feet within 1 minute.The resulting data were grouped by month of birth: January,May,and September: Crawling age is given in weeks.Assume the data represent three independent simple random samples,one from each of the three populations consisting of babies born in that particular month,and that the populations of crawling ages have Normal distributions. A partial ANOVA table is given below. What can we say about the P-value for this F test?
A)P-value < 0.01
B)0.01 < P-value < 0.025
C)0.025 < P-value < 0.05
D)0.05 < P-value < 0.10
Crawling age is given in weeks.Assume the data represent three independent simple random samples,one from each of the three populations consisting of babies born in that particular month,and that the populations of crawling ages have Normal distributions. A partial ANOVA table is given below. What can we say about the P-value for this F test?A)P-value < 0.01
B)0.01 < P-value < 0.025
C)0.025 < P-value < 0.05
D)0.05 < P-value < 0.10
فتح الحزمة
افتح القفل للوصول البطاقات البالغ عددها 74 في هذه المجموعة.
فتح الحزمة
k this deck
49
Bleaching chemicals are used in the pulp and paper industry to increase the brightness of the paper that is produced.Four chemical agents were studied to determine their effect on the brightness of paper produced from pulp treated with the chemical.The following tables provide some details obtained from the experimental data. The null hypothesis Ho: was established for the ANOVA.
If the null hypothesis is true,the ANOVA table shows that the P-value is 0.5383.What should we conclude from this?
A)The mean of Chemical D is certainly different from the mean of Chemical A.
B)Some of the chemicals have a different effect on the brightness of the paper.
C)The null hypothesis should be rejected in favor of the alternative hypothesis.
D)Caution should be exercised on any conclusion from the ANOVA because the assumption of equal standard deviation among chemicals may be suspect.
E)With only 19 degrees of freedom for total,nothing much can be concluded from this experiment.
The null hypothesis Ho: was established for the ANOVA.If the null hypothesis is true,the ANOVA table shows that the P-value is 0.5383.What should we conclude from this?
A)The mean of Chemical D is certainly different from the mean of Chemical A.
B)Some of the chemicals have a different effect on the brightness of the paper.
C)The null hypothesis should be rejected in favor of the alternative hypothesis.
D)Caution should be exercised on any conclusion from the ANOVA because the assumption of equal standard deviation among chemicals may be suspect.
E)With only 19 degrees of freedom for total,nothing much can be concluded from this experiment.
فتح الحزمة
افتح القفل للوصول البطاقات البالغ عددها 74 في هذه المجموعة.
فتح الحزمة
k this deck
50
At what age do babies learn to crawl? Does it take longer to learn in the winter when babies are often bundled in clothes that restrict their movement? Data were collected from parents who brought their babies into the University of Denver Infant Study Center to participate in one of a number of experiments between 1988 and 1991.Parents reported the birth month and the age at which their child was first able to creep or crawl a distance of 4 feet within 1 minute.The resulting data were grouped by month of birth: January,May,and September: Crawling age is given in weeks.Assume the data represent three independent simple random samples,one from each of the three populations consisting of babies born in that particular month,and that the populations of crawling ages have Normal distributions. A partial ANOVA table is given below. What are the degrees of freedom for the groups term?
A)2
B)3
C)94
D)96
Crawling age is given in weeks.Assume the data represent three independent simple random samples,one from each of the three populations consisting of babies born in that particular month,and that the populations of crawling ages have Normal distributions. A partial ANOVA table is given below. What are the degrees of freedom for the groups term?A)2
B)3
C)94
D)96
فتح الحزمة
افتح القفل للوصول البطاقات البالغ عددها 74 في هذه المجموعة.
فتح الحزمة
k this deck
51
It is widely believed that a person's level of fitness prior to undergoing corrective knee surgery is an important factor in the speed of rehabilitation following surgery.A study was undertaken with 24 randomly selected male subjects who were to undergo such surgery.The physical fitness status of each subject before the surgery was categorized as being below average (n = 8),average (n = 10),or above average (n = 6).Following surgery,the number of days spent in physical therapy by each patient until fully rehabilitated was determined.Examination of side-by-side boxplots indicated that it was reasonable to assume that the samples came from populations with equal standard deviations. The following ANOVA table was obtained.(Some entries have been replaced with **.) The degrees of freedom associated with the ANOVA F test are ____________.
A)F(3,21)
B)F(2,22)
C)F(2,23)
D)F(2,21)
E)F(3,20)
The degrees of freedom associated with the ANOVA F test are ____________.A)F(3,21)
B)F(2,22)
C)F(2,23)
D)F(2,21)
E)F(3,20)
فتح الحزمة
افتح القفل للوصول البطاقات البالغ عددها 74 في هذه المجموعة.
فتح الحزمة
k this deck
52
A study on color brightness for different types of projectors involved three different brands: A,B,and C.The projectors were rated for color brightness (a higher score means brighter colors).Random samples of 15 of the ratings from each brand were taken.The SPSS output from the analysis is (partially)given below. One assumption in the ANOVA is that the populations have equal standard deviations.Side-by-side boxplots of the sample data are shown below.Does this assumption seem reasonable?
A)Yes,because the interquartile ranges are similar in the graph.
B)No,because there is an outlier present in the data.
C)No,because medians for the three different brands are so different.
D)This cannot be determined without studying the actual data values.
One assumption in the ANOVA is that the populations have equal standard deviations.Side-by-side boxplots of the sample data are shown below.Does this assumption seem reasonable? A)Yes,because the interquartile ranges are similar in the graph.
B)No,because there is an outlier present in the data.
C)No,because medians for the three different brands are so different.
D)This cannot be determined without studying the actual data values.
فتح الحزمة
افتح القفل للوصول البطاقات البالغ عددها 74 في هذه المجموعة.
فتح الحزمة
k this deck
53
A contrast expresses an effect in the population as a combination of population means,of the form .The contrast can be estimated or tested using the sample data.Which of the following statements about or properties of contrasts is/are FALSE?
A)The corresponding sample contrast is
.
B)The coefficients of the contrast must sum to one,
.
C)The standard error of a sample contrast is given by
.
D)To test the hypothesis that the population contrast
= 0,the test statistic is
,which follows the t distribution with DFE associated with
From the ANOVA.
E)The confidence interval for
Takes the form
,where
Is the appropriate value of the t(DFE)distribution.
.The contrast can be estimated or tested using the sample data.Which of the following statements about or properties of contrasts is/are FALSE?A)The corresponding sample contrast is
.
B)The coefficients of the contrast must sum to one,
.
C)The standard error of a sample contrast is given by
.
D)To test the hypothesis that the population contrast
= 0,the test statistic is
,which follows the t distribution with DFE associated with
From the ANOVA.
E)The confidence interval for
Takes the form
,where
Is the appropriate value of the t(DFE)distribution.
فتح الحزمة
افتح القفل للوصول البطاقات البالغ عددها 74 في هذه المجموعة.
فتح الحزمة
k this deck
54
It is widely believed that a person's level of fitness prior to undergoing corrective knee surgery is an important factor in the speed of rehabilitation following surgery.A study was undertaken with 24 randomly selected male subjects who were to undergo such surgery.The physical fitness status of each subject before the surgery was categorized as being below average (n = 8),average (n = 10),or above average (n = 6).Following surgery,the number of days spent in physical therapy by each patient until fully rehabilitated was determined.Examination of side-by-side boxplots indicated that it was reasonable to assume that the samples came from populations with equal standard deviations. The following ANOVA table was obtained.(Some entries have been replaced with **.) What are the values of the mean square for error (MSE)and the F statistic for testing the null hypothesis H0:
?
A) MSE = 47.30; F = 7.10
B) MSE = 19.81; F = 1.62
C) MSE = 19.81; F = 16.96
D) MSE = 416.0; F = 7.10
E) MSE = 47.30; F = 16.96
What are the values of the mean square for error (MSE)and the F statistic for testing the null hypothesis H0: ?
A) MSE = 47.30; F = 7.10
B) MSE = 19.81; F = 1.62
C) MSE = 19.81; F = 16.96
D) MSE = 416.0; F = 7.10
E) MSE = 47.30; F = 16.96
فتح الحزمة
افتح القفل للوصول البطاقات البالغ عددها 74 في هذه المجموعة.
فتح الحزمة
k this deck
55
At what age do babies learn to crawl? Does it take longer to learn in the winter when babies are often bundled in clothes that restrict their movement? Data were collected from parents who brought their babies into the University of Denver Infant Study Center to participate in one of a number of experiments between 1988 and 1991.Parents reported the birth month and the age at which their child was first able to creep or crawl a distance of 4 feet within 1 minute.The resulting data were grouped by month of birth: January,May,and September: Crawling age is given in weeks.Assume the data represent three independent simple random samples,one from each of the three populations consisting of babies born in that particular month,and that the populations of crawling ages have Normal distributions. A partial ANOVA table is given below. The null hypothesis for the ANOVA F test is that the population mean crawling ages are equal for all three birth months.What is the alternative hypothesis?
A)The population mean crawling age is larger for January than the other 2 months.
B)The population mean crawling age is larger for May than the other 2 months.
C)The three population mean crawling ages are all different from each other.
D)Not all three population mean crawling ages are equal to each other.
Crawling age is given in weeks.Assume the data represent three independent simple random samples,one from each of the three populations consisting of babies born in that particular month,and that the populations of crawling ages have Normal distributions. A partial ANOVA table is given below. The null hypothesis for the ANOVA F test is that the population mean crawling ages are equal for all three birth months.What is the alternative hypothesis?A)The population mean crawling age is larger for January than the other 2 months.
B)The population mean crawling age is larger for May than the other 2 months.
C)The three population mean crawling ages are all different from each other.
D)Not all three population mean crawling ages are equal to each other.
فتح الحزمة
افتح القفل للوصول البطاقات البالغ عددها 74 في هذه المجموعة.
فتح الحزمة
k this deck
56
A service center for electronic equipment is conducting a study on three of their technicians: Joe,John,and James.All three specialize in repairing computer drives.The study was performed to study the service time of fixing the computer drives.The manager of the service center wishes to assess if the average service times for the three technicians are equal: H0: 1 = 2 = 3.Each technician was given a random sample of computer drives,and the service time for each was recorded.The ANOVA table and descriptive statistics are given below. What is the value of an estimate of the common standard deviation?
A)3.51
B)8.45
C)8.61
D)12.29
What is the value of an estimate of the common standard deviation?A)3.51
B)8.45
C)8.61
D)12.29
فتح الحزمة
افتح القفل للوصول البطاقات البالغ عددها 74 في هذه المجموعة.
فتح الحزمة
k this deck
57
It is widely believed that a person's level of fitness prior to undergoing corrective knee surgery is an important factor in the speed of rehabilitation following surgery.A study was undertaken with 24 randomly selected male subjects who were to undergo such surgery.The physical fitness status of each subject before the surgery was categorized as being below average (n = 8),average (n = 10),or above average (n = 6).Following surgery,the number of days spent in physical therapy by each patient until fully rehabilitated was determined.Examination of side-by-side boxplots indicated that it was reasonable to assume that the samples came from populations with equal standard deviations. The following ANOVA table was obtained.(Some entries have been replaced with **.) What is the value of the estimate for the common population variance,
?
A)4.45
B)336.0
C)47.3
D)20.40
E)None of the above
What is the value of the estimate for the common population variance, ?
A)4.45
B)336.0
C)47.3
D)20.40
E)None of the above
فتح الحزمة
افتح القفل للوصول البطاقات البالغ عددها 74 في هذه المجموعة.
فتح الحزمة
k this deck
58
At what age do babies learn to crawl? Does it take longer to learn in the winter when babies are often bundled in clothes that restrict their movement? Data were collected from parents who brought their babies into the University of Denver Infant Study Center to participate in one of a number of experiments between 1988 and 1991.Parents reported the birth month and the age at which their child was first able to creep or crawl a distance of 4 feet within 1 minute.The resulting data were grouped by month of birth: January,May,and September: Crawling age is given in weeks.Assume the data represent three independent simple random samples,one from each of the three populations consisting of babies born in that particular month,and that the populations of crawling ages have Normal distributions. A partial ANOVA table is given below. What is the value of the ANOVA F statistic for testing the equality of the population means?
A)3.15
B)4.73
C)6.30
D)9.45
Crawling age is given in weeks.Assume the data represent three independent simple random samples,one from each of the three populations consisting of babies born in that particular month,and that the populations of crawling ages have Normal distributions. A partial ANOVA table is given below. What is the value of the ANOVA F statistic for testing the equality of the population means?A)3.15
B)4.73
C)6.30
D)9.45
فتح الحزمة
افتح القفل للوصول البطاقات البالغ عددها 74 في هذه المجموعة.
فتح الحزمة
k this deck
59
A study on color brightness for different types of projectors involved three different brands: A,B,and C.The projectors were rated for color brightness (a higher score means brighter colors).Random samples of 15 of the ratings from each brand were taken.The SPSS output from the analysis is (partially)given below. Suppose we wish to assess if the color brightness of B is significantly higher than the average of the other two brands,by conducting a hypothesis test for the appropriate contrast .Let 1, 2,and 3 denote the population means for A,B,and C,respectively.What are the values of the coefficients for the contrast ?
A)a1 = 1/3,a2 = 1/3,and a3 = 1/3
B)a1 = 1/2,a2 = 1,and a3 = 1/2
C)a1 = -1/2,a2 = 1,and a3 = -1/2
D)a1 = 1/2,a2 = 1/4,and a3 = 1/2
Suppose we wish to assess if the color brightness of B is significantly higher than the average of the other two brands,by conducting a hypothesis test for the appropriate contrast .Let 1, 2,and 3 denote the population means for A,B,and C,respectively.What are the values of the coefficients for the contrast ?A)a1 = 1/3,a2 = 1/3,and a3 = 1/3
B)a1 = 1/2,a2 = 1,and a3 = 1/2
C)a1 = -1/2,a2 = 1,and a3 = -1/2
D)a1 = 1/2,a2 = 1/4,and a3 = 1/2
فتح الحزمة
افتح القفل للوصول البطاقات البالغ عددها 74 في هذه المجموعة.
فتح الحزمة
k this deck
60
At what age do babies learn to crawl? Does it take longer to learn in the winter when babies are often bundled in clothes that restrict their movement? Data were collected from parents who brought their babies into the University of Denver Infant Study Center to participate in one of a number of experiments between 1988 and 1991.Parents reported the birth month and the age at which their child was first able to creep or crawl a distance of 4 feet within 1 minute.The resulting data were grouped by month of birth: January,May,and September: Crawling age is given in weeks.Assume the data represent three independent simple random samples,one from each of the three populations consisting of babies born in that particular month,and that the populations of crawling ages have Normal distributions. A partial ANOVA table is given below. Multiple comparison procedures are going to be used to calculate simultaneous confidence intervals for all pairwise comparisons using the Bonferroni method.
For = 0.10,the value of t** is 2.16.What would be the 90% confidence interval for the difference between May and September using the Bonferroni method?
A)(-9.39,-1.11)
B)(-9.22,-1.28)
C)(1.28,9.22)
D)(3.29,7.21)
Crawling age is given in weeks.Assume the data represent three independent simple random samples,one from each of the three populations consisting of babies born in that particular month,and that the populations of crawling ages have Normal distributions. A partial ANOVA table is given below. Multiple comparison procedures are going to be used to calculate simultaneous confidence intervals for all pairwise comparisons using the Bonferroni method.For = 0.10,the value of t** is 2.16.What would be the 90% confidence interval for the difference between May and September using the Bonferroni method?
A)(-9.39,-1.11)
B)(-9.22,-1.28)
C)(1.28,9.22)
D)(3.29,7.21)
فتح الحزمة
افتح القفل للوصول البطاقات البالغ عددها 74 في هذه المجموعة.
فتح الحزمة
k this deck
61
At a large automobile factory,four different machines are used to produce disc brakes.To make sure that the disc brakes are all being produced with comparable diameters,daily samples of 16 disc brakes are taken from the production lines of each of the four machines and their diameters measured.The deviation from the goal diameter of 322 micrometers is measured to the nearest micrometer.Assume that the distribution of these deviations is approximately Normal with a common standard deviation.Does it appear that disc brakes made on the four machines are made with equal mean diameters? SPSS output is included below. What are the degrees of freedom for the F statistic?
A)3 and 60
B)3 and 63
C)3 and 64
D)4 and 64
What are the degrees of freedom for the F statistic?A)3 and 60
B)3 and 63
C)3 and 64
D)4 and 64
فتح الحزمة
افتح القفل للوصول البطاقات البالغ عددها 74 في هذه المجموعة.
فتح الحزمة
k this deck
62
A service center for electronic equipment is conducting a study on three of their technicians: Joe,John,and James.All three specialize in repairing computer drives.The study was performed to study the service time of fixing the computer drives.The manager of the service center wishes to assess if the average service times for the three technicians are equal: H0: 1 = 2 = 3.Each technician was given a random sample of computer drives,and the service time for each was recorded.The ANOVA table and descriptive statistics are given below. Under the null hypothesis of equality of population means,what is the appropriate model for the test statistic?
A)F(2,42)
B)F(2,44)
C)F(3,44)
D)F(3,45)
Under the null hypothesis of equality of population means,what is the appropriate model for the test statistic?A)F(2,42)
B)F(2,44)
C)F(3,44)
D)F(3,45)
فتح الحزمة
افتح القفل للوصول البطاقات البالغ عددها 74 في هذه المجموعة.
فتح الحزمة
k this deck
63
At a large automobile factory,four different machines are used to produce disc brakes.To make sure that the disc brakes are all being produced with comparable diameters,daily samples of 16 disc brakes are taken from the production lines of each of the four machines and their diameters measured.The deviation from the goal diameter of 322 micrometers is measured to the nearest micrometer.Assume that the distribution of these deviations is approximately Normal with a common standard deviation.Does it appear that disc brakes made on the four machines are made with equal mean diameters? SPSS output is included below. Some summary measures for the four machines are given below. Suppose we are interested in the contrast that compares the average of machines 1,3,and 4 (the most recently purchased machines)to machine 2 (a slightly older model).
What is the value of the standard error of the contrast ?
A)2.88
B)3.52
C)8.28
D)12.42
Some summary measures for the four machines are given below. Suppose we are interested in the contrast that compares the average of machines 1,3,and 4 (the most recently purchased machines)to machine 2 (a slightly older model). What is the value of the standard error of the contrast ?
A)2.88
B)3.52
C)8.28
D)12.42
فتح الحزمة
افتح القفل للوصول البطاقات البالغ عددها 74 في هذه المجموعة.
فتح الحزمة
k this deck
64
At a large automobile factory,four different machines are used to produce disc brakes.To make sure that the disc brakes are all being produced with comparable diameters,daily samples of 16 disc brakes are taken from the production lines of each of the four machines and their diameters measured.The deviation from the goal diameter of 322 micrometers is measured to the nearest micrometer.Assume that the distribution of these deviations is approximately Normal with a common standard deviation.Does it appear that disc brakes made on the four machines are made with equal mean diameters? SPSS output is included below. What is the value of the estimate of the common population standard deviation?
A)9.97
B)11.75
C)34.17
D)99.37
What is the value of the estimate of the common population standard deviation?A)9.97
B)11.75
C)34.17
D)99.37
فتح الحزمة
افتح القفل للوصول البطاقات البالغ عددها 74 في هذه المجموعة.
فتح الحزمة
k this deck
65
Independent random samples of households in the four U.S.regions (Northeast,Midwest,South,and West)yielded data on last year's energy consumption.We are interested in assessing,at the 1% significance level,if the data provide sufficient evidence to conclude that last year's average energy consumption was different among the four U.S.regions.Assume that energy consumption in the four regions is Normally distributed.
SPSS was used to create the side-by-side boxplots shown below. What is the null hypothesis for assessing if the mean energy consumption was the same for the four regions?
SPSS was used to create the side-by-side boxplots shown below.
What is the null hypothesis for assessing if the mean energy consumption was the same for the four regions? فتح الحزمة
افتح القفل للوصول البطاقات البالغ عددها 74 في هذه المجموعة.
فتح الحزمة
k this deck
66
Independent random samples of households in the four U.S.regions (Northeast,Midwest,South,and West)yielded data on last year's energy consumption.We are interested in assessing,at the 1% significance level,if the data provide sufficient evidence to conclude that last year's average energy consumption was different among the four U.S.regions.Assume that energy consumption in the four regions is Normally distributed.
SPSS was used to create the side-by-side boxplots shown below. What assumption needed for an ANOVA F test can be checked with this graph?
SPSS was used to create the side-by-side boxplots shown below.
What assumption needed for an ANOVA F test can be checked with this graph? فتح الحزمة
افتح القفل للوصول البطاقات البالغ عددها 74 في هذه المجموعة.
فتح الحزمة
k this deck
67
At a large automobile factory,four different machines are used to produce disc brakes.To make sure that the disc brakes are all being produced with comparable diameters,daily samples of 16 disc brakes are taken from the production lines of each of the four machines and their diameters measured.The deviation from the goal diameter of 322 micrometers is measured to the nearest micrometer.Assume that the distribution of these deviations is approximately Normal with a common standard deviation.Does it appear that disc brakes made on the four machines are made with equal mean diameters? SPSS output is included below. Some summary measures for the four machines are given below. Suppose we are interested in the contrast that compares the average of machines 1,3,and 4 (the most recently purchased machines)to machine 2 (a slightly older model).
What is the value of the estimate of the contrast ?
A)-22.03
B)-16.85
C)6.49
D)11.67
Some summary measures for the four machines are given below. Suppose we are interested in the contrast that compares the average of machines 1,3,and 4 (the most recently purchased machines)to machine 2 (a slightly older model). What is the value of the estimate of the contrast ?
A)-22.03
B)-16.85
C)6.49
D)11.67
فتح الحزمة
افتح القفل للوصول البطاقات البالغ عددها 74 في هذه المجموعة.
فتح الحزمة
k this deck
68
A service center for electronic equipment is conducting a study on three of their technicians: Joe,John,and James.All three specialize in repairing computer drives.The study was performed to study the service time of fixing the computer drives.The manager of the service center wishes to assess if the average service times for the three technicians are equal: H0: 1 = 2 = 3.Each technician was given a random sample of computer drives,and the service time for each was recorded.The ANOVA table and descriptive statistics are given below. At the 5% significance level,would we reject the null hypothesis?
A)Yes
B)No
C)This cannot be determined from the information given.
At the 5% significance level,would we reject the null hypothesis?A)Yes
B)No
C)This cannot be determined from the information given.
فتح الحزمة
افتح القفل للوصول البطاقات البالغ عددها 74 في هذه المجموعة.
فتح الحزمة
k this deck
69
A service center for electronic equipment is conducting a study on three of their technicians: Joe,John,and James.All three specialize in repairing computer drives.The study was performed to study the service time of fixing the computer drives.The manager of the service center wishes to assess if the average service times for the three technicians are equal: H0: 1 = 2 = 3.Each technician was given a random sample of computer drives,and the service time for each was recorded.The ANOVA table and descriptive statistics are given below. What is the value of the coefficient of determination R2?
A)0.0078
B)0.166
C)0.848
D)0.992
What is the value of the coefficient of determination R2?A)0.0078
B)0.166
C)0.848
D)0.992
فتح الحزمة
افتح القفل للوصول البطاقات البالغ عددها 74 في هذه المجموعة.
فتح الحزمة
k this deck
70
At a large automobile factory,four different machines are used to produce disc brakes.To make sure that the disc brakes are all being produced with comparable diameters,daily samples of 16 disc brakes are taken from the production lines of each of the four machines and their diameters measured.The deviation from the goal diameter of 322 micrometers is measured to the nearest micrometer.Assume that the distribution of these deviations is approximately Normal with a common standard deviation.Does it appear that disc brakes made on the four machines are made with equal mean diameters? SPSS output is included below. Some summary measures for the four machines are given below. Suppose we are interested in the contrast that compares the average of machines 1,3,and 4 (the most recently purchased machines)to machine 2 (a slightly older model).
Do the data show evidence of a violation of the assumption that the four populations have the same standard deviation?
A)Yes,because 124.47/48.84 is greater than 2
B)Yes,because the variation decreases when we move from machine 1 to machine 4
C)No,because 11.16/6.99 is smaller than 2
D)No,because the sample sizes are all equal
Some summary measures for the four machines are given below. Suppose we are interested in the contrast that compares the average of machines 1,3,and 4 (the most recently purchased machines)to machine 2 (a slightly older model). Do the data show evidence of a violation of the assumption that the four populations have the same standard deviation?
A)Yes,because 124.47/48.84 is greater than 2
B)Yes,because the variation decreases when we move from machine 1 to machine 4
C)No,because 11.16/6.99 is smaller than 2
D)No,because the sample sizes are all equal
فتح الحزمة
افتح القفل للوصول البطاقات البالغ عددها 74 في هذه المجموعة.
فتح الحزمة
k this deck
71
At a large automobile factory,four different machines are used to produce disc brakes.To make sure that the disc brakes are all being produced with comparable diameters,daily samples of 16 disc brakes are taken from the production lines of each of the four machines and their diameters measured.The deviation from the goal diameter of 322 micrometers is measured to the nearest micrometer.Assume that the distribution of these deviations is approximately Normal with a common standard deviation.Does it appear that disc brakes made on the four machines are made with equal mean diameters? SPSS output is included below. At the 5% significance level,do we reject the null hypothesis of equality of the four population means?
A)Yes
B)No
C)This cannot be determined from the information given.
At the 5% significance level,do we reject the null hypothesis of equality of the four population means?A)Yes
B)No
C)This cannot be determined from the information given.
فتح الحزمة
افتح القفل للوصول البطاقات البالغ عددها 74 في هذه المجموعة.
فتح الحزمة
k this deck
72
Independent random samples of households in the four U.S.regions (Northeast,Midwest,South,and West)yielded data on last year's energy consumption.We are interested in assessing,at the 1% significance level,if the data provide sufficient evidence to conclude that last year's average energy consumption was different among the four U.S.regions.Assume that energy consumption in the four regions is Normally distributed.
SPSS was used to create the side-by-side boxplots shown below. Based on the boxplots,does it seem like the assumption is satisfied? Explain briefly.
SPSS was used to create the side-by-side boxplots shown below.
Based on the boxplots,does it seem like the assumption is satisfied? Explain briefly. فتح الحزمة
افتح القفل للوصول البطاقات البالغ عددها 74 في هذه المجموعة.
فتح الحزمة
k this deck
73
At a large automobile factory,four different machines are used to produce disc brakes.To make sure that the disc brakes are all being produced with comparable diameters,daily samples of 16 disc brakes are taken from the production lines of each of the four machines and their diameters measured.The deviation from the goal diameter of 322 micrometers is measured to the nearest micrometer.Assume that the distribution of these deviations is approximately Normal with a common standard deviation.Does it appear that disc brakes made on the four machines are made with equal mean diameters? SPSS output is included below. Some summary measures for the four machines are given below. Suppose we are interested in the contrast that compares the average of machines 1,3,and 4 (the most recently purchased machines)to machine 2 (a slightly older model).
SPSS output for multiple comparisons is given below,using the Bonferroni method with = 0.05. What is the correct conclusion based on these comparisons?
A)Machine 1 seems to give different results from Machine 2.Machines 3 and 4 appear indistinguishable.
B)Machine 2 seems to give different results from all other machines.Machines 1,3,and 4 appear indistinguishable.
C)Machine 2 seems to be doing much better than the other three machines.
D)None of the above
Some summary measures for the four machines are given below. Suppose we are interested in the contrast that compares the average of machines 1,3,and 4 (the most recently purchased machines)to machine 2 (a slightly older model). SPSS output for multiple comparisons is given below,using the Bonferroni method with = 0.05.
What is the correct conclusion based on these comparisons?A)Machine 1 seems to give different results from Machine 2.Machines 3 and 4 appear indistinguishable.
B)Machine 2 seems to give different results from all other machines.Machines 1,3,and 4 appear indistinguishable.
C)Machine 2 seems to be doing much better than the other three machines.
D)None of the above
فتح الحزمة
افتح القفل للوصول البطاقات البالغ عددها 74 في هذه المجموعة.
فتح الحزمة
k this deck
74
At a large automobile factory,four different machines are used to produce disc brakes.To make sure that the disc brakes are all being produced with comparable diameters,daily samples of 16 disc brakes are taken from the production lines of each of the four machines and their diameters measured.The deviation from the goal diameter of 322 micrometers is measured to the nearest micrometer.Assume that the distribution of these deviations is approximately Normal with a common standard deviation.Does it appear that disc brakes made on the four machines are made with equal mean diameters? SPSS output is included below. Some summary measures for the four machines are given below. Suppose we are interested in the contrast that compares the average of machines 1,3,and 4 (the most recently purchased machines)to machine 2 (a slightly older model).
What is a 95% confidence interval for the contrast ?
A)(-33.41,-0.29)
B)(-22.61,-11.09)
C)(5.91,17.43)
D)(12.04,21.66)
Some summary measures for the four machines are given below. Suppose we are interested in the contrast that compares the average of machines 1,3,and 4 (the most recently purchased machines)to machine 2 (a slightly older model). What is a 95% confidence interval for the contrast ?
A)(-33.41,-0.29)
B)(-22.61,-11.09)
C)(5.91,17.43)
D)(12.04,21.66)
فتح الحزمة
افتح القفل للوصول البطاقات البالغ عددها 74 في هذه المجموعة.
فتح الحزمة
k this deck
فتح الحزمة
افتح القفل للوصول البطاقات البالغ عددها 74 في هذه المجموعة.


