Deck 12: Computer Simulation: Basic Concepts
ملء الشاشة (f)
سؤال
سؤال
سؤال
سؤال
سؤال
سؤال
سؤال
سؤال
سؤال
سؤال
سؤال
سؤال
سؤال
سؤال
سؤال
سؤال
سؤال
سؤال
سؤال
سؤال
سؤال
سؤال
سؤال
سؤال
سؤال
سؤال
سؤال
سؤال
سؤال
سؤال
سؤال
سؤال
سؤال
سؤال
سؤال
سؤال
سؤال
سؤال
سؤال
سؤال
سؤال
سؤال
سؤال
سؤال
سؤال
سؤال
سؤال
سؤال
سؤال
سؤال
سؤال
سؤال
سؤال
سؤال
سؤال
سؤال
سؤال
سؤال
سؤال
سؤال
سؤال
The Queueing Simulator returned the results shown below. Which of the following waiting times in the queue is most likely to occur? 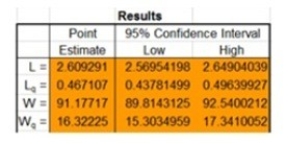
A) 10.0 seconds
B) 12.0 seconds
C) 15.0 seconds
D) 18.0 seconds
E) 20.0 seconds
A) 10.0 seconds
B) 12.0 seconds
C) 15.0 seconds
D) 18.0 seconds
E) 20.0 seconds
سؤال
سؤال
The Queueing Simulator returned the results shown below. Which of the following waiting times in the queue is most likely to occur? 
A) 60 seconds
B) 80 seconds
C) 90 seconds
D) 100 seconds
E) 120 seconds
A) 60 seconds
B) 80 seconds
C) 90 seconds
D) 100 seconds
E) 120 seconds
سؤال
The Queueing Simulator returned the results shown below for a system with 3 servers. If the firm would like their waiting room to be full no more than 2% of the time, how large must their waiting room be? 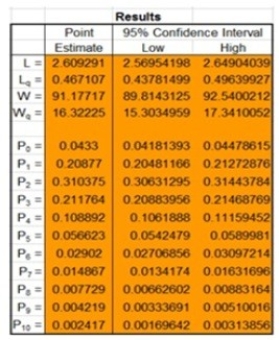
A) 4 customers
B) 5 customers
C) 6 customers
D) 7 customers
E) 8 customers
A) 4 customers
B) 5 customers
C) 6 customers
D) 7 customers
E) 8 customers
سؤال
سؤال
سؤال
سؤال
سؤال
سؤال
سؤال
سؤال
سؤال
سؤال
سؤال
The Queueing Simulator returned the results shown below for a system with 2 servers. Which of the following is most likely to occur? 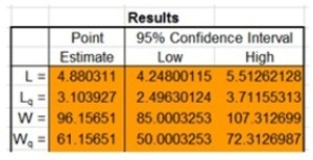
A) A queue waiting time of 40 seconds.
B) A total time in system of 80 seconds.
C) A queue length of 5 customers.
D) A total of 5 customers in the system.
E) All are equally likely.
A) A queue waiting time of 40 seconds.
B) A total time in system of 80 seconds.
C) A queue length of 5 customers.
D) A total of 5 customers in the system.
E) All are equally likely.
سؤال
سؤال
سؤال
سؤال

فتح الحزمة
قم بالتسجيل لفتح البطاقات في هذه المجموعة!
Unlock Deck
Unlock Deck
1/79
العب
ملء الشاشة (f)
Deck 12: Computer Simulation: Basic Concepts
1
Simulation is often the first choice of decision makers instead of analytic models.
False
2
Random observations can be generated in Excel by using the VLOOKUP function.
True
3
A simulation model includes a description of the components of the system that is to be simulated.
True
4
A number is a random number between 0 and 1 if it is generated in such a way that every possible number within this interval has an equal chance of occurring.
فتح الحزمة
افتح القفل للوصول البطاقات البالغ عددها 79 في هذه المجموعة.
فتح الحزمة
k this deck
5
Simulation is basically an optimizing technique.
فتح الحزمة
افتح القفل للوصول البطاقات البالغ عددها 79 في هذه المجموعة.
فتح الحزمة
k this deck
6
A stochastic system is one that evolved over time according to a continuous probability distribution.
فتح الحزمة
افتح القفل للوصول البطاقات البالغ عددها 79 في هذه المجموعة.
فتح الحزمة
k this deck
7
A simulation clock keeps track of how long the simulation has run in real time.
فتح الحزمة
افتح القفل للوصول البطاقات البالغ عددها 79 في هذه المجموعة.
فتح الحزمة
k this deck
8
A simulation model is validated if it adequately depicts real system performance.
فتح الحزمة
افتح القفل للوصول البطاقات البالغ عددها 79 في هذه المجموعة.
فتح الحزمة
k this deck
9
Simulation models are fairly easy to use and understand; therefore they can be used for a wide range of decisions.
فتح الحزمة
افتح القفل للوصول البطاقات البالغ عددها 79 في هذه المجموعة.
فتح الحزمة
k this deck
10
Simulation enables a decision maker to experiment with a system and observe its behavior.
فتح الحزمة
افتح القفل للوصول البطاقات البالغ عددها 79 في هذه المجموعة.
فتح الحزمة
k this deck
11
One purpose of running experiments on a simulation model is to answer "what-if" questions.
فتح الحزمة
افتح القفل للوصول البطاقات البالغ عددها 79 في هذه المجموعة.
فتح الحزمة
k this deck
12
When using a random number table, it is important to always start at the same point of the table so that results may be replicated.
فتح الحزمة
افتح القفل للوصول البطاقات البالغ عددها 79 في هذه المجموعة.
فتح الحزمة
k this deck
13
Simulation is especially useful for situations too complex to be analyzed using analytical models.
فتح الحزمة
افتح القفل للوصول البطاقات البالغ عددها 79 في هذه المجموعة.
فتح الحزمة
k this deck
14
Computer simulation is a useful tool because it generates accurate information using very small samples.
فتح الحزمة
افتح القفل للوصول البطاقات البالغ عددها 79 في هذه المجموعة.
فتح الحزمة
k this deck
15
Random numbers can be generated in Excel by using the VLOOKUP function.
فتح الحزمة
افتح القفل للوصول البطاقات البالغ عددها 79 في هذه المجموعة.
فتح الحزمة
k this deck
16
When dealing with relatively complex systems, computer simulation is an inexpensive option for decision makers.
فتح الحزمة
افتح القفل للوصول البطاقات البالغ عددها 79 في هذه المجموعة.
فتح الحزمة
k this deck
17
Managers can use simulation to obtain optimal answers for a wide range of problems.
فتح الحزمة
افتح القفل للوصول البطاقات البالغ عددها 79 في هذه المجموعة.
فتح الحزمة
k this deck
18
Computers can simulate years of operation in seconds.
فتح الحزمة
افتح القفل للوصول البطاقات البالغ عددها 79 في هذه المجموعة.
فتح الحزمة
k this deck
19
Computer simulation is only applicable to situations that have elements that can be described by random variables
فتح الحزمة
افتح القفل للوصول البطاقات البالغ عددها 79 في هذه المجموعة.
فتح الحزمة
k this deck
20
Analytical methods are preferable to simulation if an appropriate analytic method is available.
فتح الحزمة
افتح القفل للوصول البطاقات البالغ عددها 79 في هذه المجموعة.
فتح الحزمة
k this deck
21
Given this frequency distribution, the random number 0.2258 would be interpreted as a demand of:
A) 0.
B) 1.
C) 2.
D) 3.
E) 1 or 2.
A) 0.
B) 1.
C) 2.
D) 3.
E) 1 or 2.
فتح الحزمة
افتح القفل للوصول البطاقات البالغ عددها 79 في هذه المجموعة.
فتح الحزمة
k this deck
22
Simulation will often give measures of performance as outputs.
فتح الحزمة
افتح القفل للوصول البطاقات البالغ عددها 79 في هذه المجموعة.
فتح الحزمة
k this deck
23
It is always necessary to test the validity of a simulation model by comparing its results with those of an analytic study.
فتح الحزمة
افتح القفل للوصول البطاقات البالغ عددها 79 في هذه المجموعة.
فتح الحزمة
k this deck
24
The main reason that a large number of replications of a simulation would be made is:
A) computers are usually used, and they can easily handle a large number of replications.
B) it is part of the scientific approach.
C) it is a form of sampling, and large samples give more accurate results than small samples.
D) it is more likely to provide optimal answers.
E) None of the answer choices is correct.
فتح الحزمة
افتح القفل للوصول البطاقات البالغ عددها 79 في هذه المجموعة.
فتح الحزمة
k this deck
25
A flow diagram shows the output of a simulation run.
فتح الحزمة
افتح القفل للوصول البطاقات البالغ عددها 79 في هذه المجموعة.
فتح الحزمة
k this deck
26
Given this frequency distribution, the random number 0.9015 would be interpreted as a demand of:
A) 0.
B) 1.
C) 2.
D) 3.
E) 1 or 2.
A) 0.
B) 1.
C) 2.
D) 3.
E) 1 or 2.
فتح الحزمة
افتح القفل للوصول البطاقات البالغ عددها 79 في هذه المجموعة.
فتح الحزمة
k this deck
27
A Data Table can be used to "trick" Excel to perform many replications of a computer simulation.
فتح الحزمة
افتح القفل للوصول البطاقات البالغ عددها 79 في هذه المجموعة.
فتح الحزمة
k this deck
28
If a simulation begins with the first random number, the second simulated value would be:
Random numbers: 0.6246, 0.2594, 0.4055
A) 0.
B) 1.
C) 2.
D) 3.
E) 4.
Random numbers: 0.6246, 0.2594, 0.4055
A) 0.
B) 1.
C) 2.
D) 3.
E) 4.
فتح الحزمة
افتح القفل للوصول البطاقات البالغ عددها 79 في هذه المجموعة.
فتح الحزمة
k this deck
29
Given this frequency distribution, the random number 0.5211 would be interpreted as a demand of:
A) 0.
B) 1.
C) 2.
D) 3.
E) 1 or 2.
A) 0.
B) 1.
C) 2.
D) 3.
E) 1 or 2.
فتح الحزمة
افتح القفل للوصول البطاقات البالغ عددها 79 في هذه المجموعة.
فتح الحزمة
k this deck
30
With the speed of computers, it is not necessary to limit the amount of factors considered in a simulation.
فتح الحزمة
افتح القفل للوصول البطاقات البالغ عددها 79 في هذه المجموعة.
فتح الحزمة
k this deck
31
Which of the following would not be a probable reason for choosing simulation as a decision-making tool?
A) The situation is too complex for a mathematical model.
B) There is a limited time in which to obtain results.
C) Good results have been obtained in the past using simulation.
D) Users are able to understand the model.
E) All of these are probable reasons for choosing simulation.
A) The situation is too complex for a mathematical model.
B) There is a limited time in which to obtain results.
C) Good results have been obtained in the past using simulation.
D) Users are able to understand the model.
E) All of these are probable reasons for choosing simulation.
فتح الحزمة
افتح القفل للوصول البطاقات البالغ عددها 79 في هذه المجموعة.
فتح الحزمة
k this deck
32
The main procedure for advancing the time on the simulation clock is called next-event time advance.
فتح الحزمة
افتح القفل للوصول البطاقات البالغ عددها 79 في هذه المجموعة.
فتح الحزمة
k this deck
33
One key advantage of computer simulation is that is makes full use of the simplifying approximations that are available.
فتح الحزمة
افتح القفل للوصول البطاقات البالغ عددها 79 في هذه المجموعة.
فتح الحزمة
k this deck
34
A simulation model is often formulated in terms of a flow diagram.
فتح الحزمة
افتح القفل للوصول البطاقات البالغ عددها 79 في هذه المجموعة.
فتح الحزمة
k this deck
35
If a simulation begins with the first random number, the first simulated value would be:
Random numbers: 0.6246, 0.2594, 0.4055
A) 0.
B) 1.
C) 2.
D) 3.
E) 4.
Random numbers: 0.6246, 0.2594, 0.4055
A) 0.
B) 1.
C) 2.
D) 3.
E) 4.
فتح الحزمة
افتح القفل للوصول البطاقات البالغ عددها 79 في هذه المجموعة.
فتح الحزمة
k this deck
36
A larger confidence interval is desirable for a measure of performance since it shows that the results are valid over a larger range.
فتح الحزمة
افتح القفل للوصول البطاقات البالغ عددها 79 في هذه المجموعة.
فتح الحزمة
k this deck
37
Which of the following is not a reason for simulation's popularity?
A) It is simple to use and/or understand.
B) Extensive software packages are available.
C) Many situations are too complex for mathematical solutions.
D) If can be used for a wide range of applications.
E) It is typically an inexpensive approach.
A) It is simple to use and/or understand.
B) Extensive software packages are available.
C) Many situations are too complex for mathematical solutions.
D) If can be used for a wide range of applications.
E) It is typically an inexpensive approach.
فتح الحزمة
افتح القفل للوصول البطاقات البالغ عددها 79 في هذه المجموعة.
فتح الحزمة
k this deck
38
Animation can be used to display computer simulations in action.
فتح الحزمة
افتح القفل للوصول البطاقات البالغ عددها 79 في هذه المجموعة.
فتح الحزمة
k this deck
39
In order to generate more accurate results when using simulation:
A) use a continuous distribution instead of a discreet distribution.
B) increase the number of replications.
C) increase the number of factors considered.
D) All of the answers choices are correct.
E) None of the answer choices is correct.
A) use a continuous distribution instead of a discreet distribution.
B) increase the number of replications.
C) increase the number of factors considered.
D) All of the answers choices are correct.
E) None of the answer choices is correct.
فتح الحزمة
افتح القفل للوصول البطاقات البالغ عددها 79 في هذه المجموعة.
فتح الحزمة
k this deck
40
A parameter analysis report is used to generate many replications of a computer simulation.
فتح الحزمة
افتح القفل للوصول البطاقات البالغ عددها 79 في هذه المجموعة.
فتح الحزمة
k this deck
41
You have determined that waiting times at a restaurant are uniformly distributed over the interval 5 to 12 minutes. What formula would you use in Excel to generate random values in this range that follow the uniform distribution?
A) = (12 − 5 ) × RAND().
B) = (12 + 5 ) × RAND().
C) = 5 + (12 + 5 ) × RAND().
D) = 12 + (12 − 5 ) × RAND().
E) = 5 + (12 − 5 ) × RAND().
A) = (12 − 5 ) × RAND().
B) = (12 + 5 ) × RAND().
C) = 5 + (12 + 5 ) × RAND().
D) = 12 + (12 − 5 ) × RAND().
E) = 5 + (12 − 5 ) × RAND().
فتح الحزمة
افتح القفل للوصول البطاقات البالغ عددها 79 في هذه المجموعة.
فتح الحزمة
k this deck
42
The "next-event time advance" procedure does which of the following?
I) Determines which upcoming event will occur first.
II) Advances the time of the simulation to the next event time.
III) Generates a random variable to select the next event which will happen.
A) I only
B) II only
C) III only
D) I and II only
E) II and III only
I) Determines which upcoming event will occur first.
II) Advances the time of the simulation to the next event time.
III) Generates a random variable to select the next event which will happen.
A) I only
B) II only
C) III only
D) I and II only
E) II and III only
فتح الحزمة
افتح القفل للوصول البطاقات البالغ عددها 79 في هذه المجموعة.
فتح الحزمة
k this deck
43
If a simulation begins with the first random number, the third simulated value would be:
Random numbers: 0.6246, 0.2594, 0.4055
A) 0.
B) 1.
C) 2.
D) 3.
E) 4.
Random numbers: 0.6246, 0.2594, 0.4055
A) 0.
B) 1.
C) 2.
D) 3.
E) 4.
فتح الحزمة
افتح القفل للوصول البطاقات البالغ عددها 79 في هذه المجموعة.
فتح الحزمة
k this deck
44
After reviewing past history, you have assembled the following table showing the frequency of certain levels of sales over the past 40 months. If the largest random number used to represent sales of 300 units is 1.00, what will be the smallest number used to represent sales of 300 units?
A) 0.1000
B) 0.3000
C) 0.5000
D) 0.6500
E) 0.7500
A) 0.1000
B) 0.3000
C) 0.5000
D) 0.6500
E) 0.7500
فتح الحزمة
افتح القفل للوصول البطاقات البالغ عددها 79 في هذه المجموعة.
فتح الحزمة
k this deck
45
After some experimentation, you have determined that you have a biased coin. The probability of heads is 0.6 and the probability of tails is 0.4. What is the probability that you will observed heads on three successive flips?
A) 0.6
B) 0.36
C) 0.24
D) 0.216
E) 0.096
A) 0.6
B) 0.36
C) 0.24
D) 0.216
E) 0.096
فتح الحزمة
افتح القفل للوصول البطاقات البالغ عددها 79 في هذه المجموعة.
فتح الحزمة
k this deck
46
After some experimentation, you have determined that you have a biased coin. The probability of heads is 0.6 and the probability of tails is 0.4. If you flip this coin 25 times, how many times would you expect to observe the result "tails"?
A) 1
B) 5
C) 10
D) 15
E) 20
A) 1
B) 5
C) 10
D) 15
E) 20
فتح الحزمة
افتح القفل للوصول البطاقات البالغ عددها 79 في هذه المجموعة.
فتح الحزمة
k this deck
47
On cold mornings, the probability that David's car won't start is 0.22. When it doesn't start, he takes the bus and is late for work. When it does start, he drives to work on the freeway. Sixty-five percent of the time the freeway is clear, and he gets to work on time. The rest of the time he is late. Simulate 10 consecutive days' worth of trips to work using the random numbers given (use the smaller numbers to represent "car won't start" and "freeway clear").
Random numbers:
How many times is David late for work because his car won't start?
A) 0.
B) 1.
C) 2.
D) 3.
E) 4.
Random numbers:
How many times is David late for work because his car won't start?
A) 0.
B) 1.
C) 2.
D) 3.
E) 4.
فتح الحزمة
افتح القفل للوصول البطاقات البالغ عددها 79 في هذه المجموعة.
فتح الحزمة
k this deck
48
On cold mornings, the probability that David's car won't start is 0.22. When it doesn't start, he takes the bus and is late for work. When it does start, he drives to work on the freeway. Sixty-five percent of the time the freeway is clear, and he gets to work on time. The rest of the time he is late. Simulate 10 consecutive days' worth of trips to work using the random numbers given (use the smaller numbers to represent "car won't start" and "freeway clear").
Random numbers:
How many times is David late for work?
A) 1.
B) 2.
C) 3.
D) 4.
E) 5.
Random numbers:
How many times is David late for work?
A) 1.
B) 2.
C) 3.
D) 4.
E) 5.
فتح الحزمة
افتح القفل للوصول البطاقات البالغ عددها 79 في هذه المجموعة.
فتح الحزمة
k this deck
49
A simulation model includes:
I) a description of the components of the system.
II) a simulation clock.
III) a definition of the state of the system.
A) I only.
B) II only.
C) III only.
D) I, II, and III.
E) I and II only.
I) a description of the components of the system.
II) a simulation clock.
III) a definition of the state of the system.
A) I only.
B) II only.
C) III only.
D) I, II, and III.
E) I and II only.
فتح الحزمة
افتح القفل للوصول البطاقات البالغ عددها 79 في هذه المجموعة.
فتح الحزمة
k this deck
50
You have determined that waiting times at a toll booth are uniformly distributed over the interval 20 to 60 seconds. The first random number your simulation returns is 0.4732. What is the waiting time that this random number generates?
A) 38.928 seconds
B) 48.928 seconds
C) 68.928 seconds
D) 78.928 seconds
E) 88.928 seconds
A) 38.928 seconds
B) 48.928 seconds
C) 68.928 seconds
D) 78.928 seconds
E) 88.928 seconds
فتح الحزمة
افتح القفل للوصول البطاقات البالغ عددها 79 في هذه المجموعة.
فتح الحزمة
k this deck
51
You have determined that waiting times at a restaurant are uniformly distributed over the interval 5 to 12 minutes. The first random number your simulation returns is 0.2154. What is the waiting time that this random number generates?
A) 5 minutes
B) 6.5 minutes
C) 7.5 minutes
D) 10 minutes
E) 11 minutes
A) 5 minutes
B) 6.5 minutes
C) 7.5 minutes
D) 10 minutes
E) 11 minutes
فتح الحزمة
افتح القفل للوصول البطاقات البالغ عددها 79 في هذه المجموعة.
فتح الحزمة
k this deck
52
Which of the following can be used for computer simulation?
A) Spreadsheets
B) Programming languages
C) Simulation languages
D) Simulators
E) All of the answers choices are correct.
A) Spreadsheets
B) Programming languages
C) Simulation languages
D) Simulators
E) All of the answers choices are correct.
فتح الحزمة
افتح القفل للوصول البطاقات البالغ عددها 79 في هذه المجموعة.
فتح الحزمة
k this deck
53
Which of the following would not be considered a main advantage of simulation?
A) It permits experimentation with the system.
B) It generates an optimal solution.
C) It compresses time.
D) It can serve as a training tool.
E) All of the answers choices are advantages.
A) It permits experimentation with the system.
B) It generates an optimal solution.
C) It compresses time.
D) It can serve as a training tool.
E) All of the answers choices are advantages.
فتح الحزمة
افتح القفل للوصول البطاقات البالغ عددها 79 في هذه المجموعة.
فتح الحزمة
k this deck
54
After reviewing past history, you have assembled the following table showing the frequency of certain levels of sales over the past 40 months. If the smallest random number used to represent sales of 200 units is 0.45, what will be the largest number used to represent sales of 200 units?
A) 0.1000
B) 0.3000
C) 0.5000
D) 0.6500
E) 0.9000
A) 0.1000
B) 0.3000
C) 0.5000
D) 0.6500
E) 0.9000
فتح الحزمة
افتح القفل للوصول البطاقات البالغ عددها 79 في هذه المجموعة.
فتح الحزمة
k this deck
55
A manager is simulating the number of times a machine operator stops a machine to make adjustments. After careful study the manager found that the number of stops ranged from one to five per cycle and that each number of stops was equally likely. Using the random numbers 0.1835 and 0.3094 (in that order), the next two simulated cycles would respectively have stops for adjustment of:
A) 2 and 2.
B) 1 and 2.
C) 2 and 1.
D) 1 and 1.
E) 2 and 3.
A) 2 and 2.
B) 1 and 2.
C) 2 and 1.
D) 1 and 1.
E) 2 and 3.
فتح الحزمة
افتح القفل للوصول البطاقات البالغ عددها 79 في هذه المجموعة.
فتح الحزمة
k this deck
56
You have been asked to simulate the process of "flipping" two identical, unbiased coins. What is the probability of the outcome where one coin is heads and the other is tails? (Hint: Once the coins are flipped it is impossible to tell which is which.)
A) 0.10
B) 0.25
C) 0.45
D) 0.50
E) 0.75
A) 0.10
B) 0.25
C) 0.45
D) 0.50
E) 0.75
فتح الحزمة
افتح القفل للوصول البطاقات البالغ عددها 79 في هذه المجموعة.
فتح الحزمة
k this deck
57
After reviewing past history, you have assembled the following table showing the frequency of certain levels of sales over the past 40 months. If the smallest random number used to represent sales of 100 units is 0, what will be the largest number used to represent sales of 100 units?
A) 0.1000
B) 0.3000
C) 0.5000
D) 0.7500
E) 0.9000
A) 0.1000
B) 0.3000
C) 0.5000
D) 0.7500
E) 0.9000
فتح الحزمة
افتح القفل للوصول البطاقات البالغ عددها 79 في هذه المجموعة.
فتح الحزمة
k this deck
58
You have determined that waiting times at a toll booth are uniformly distributed over the interval 20 to 60 seconds. What formula would you use in Excel to generate random values in this range that follow the uniform distribution?
A) = (60 − 20) × RAND()
B) = (60 + 20) × RAND()
C) = 20 + (60 − 20) × RAND()
D) = 60 + (60 − 20) × RAND()
E) = 20 + (60 + 20) × RAND()
A) = (60 − 20) × RAND()
B) = (60 + 20) × RAND()
C) = 20 + (60 − 20) × RAND()
D) = 60 + (60 − 20) × RAND()
E) = 20 + (60 + 20) × RAND()
فتح الحزمة
افتح القفل للوصول البطاقات البالغ عددها 79 في هذه المجموعة.
فتح الحزمة
k this deck
59
In a model of a stochastic system, the simulation clock is mainly used to
A) determine how much computer time to use for the simulation.
B) determine how fast the computer can run the simulation.
C) determine the amount of simulated time that has elapsed at any point in the simulation.
D) estimate how long the simulation will run.
E) measure the number of events that will happen during the simulation.
فتح الحزمة
افتح القفل للوصول البطاقات البالغ عددها 79 في هذه المجموعة.
فتح الحزمة
k this deck
60
You have been asked to simulate the process of "flipping" two identical, unbiased coins. How many possible outcomes exist for this process? (Hint: Once the coins are flipped it is impossible to tell which is which.)
A) 1
B) 2
C) 3
D) 4
E) 5
A) 1
B) 2
C) 3
D) 4
E) 5
فتح الحزمة
افتح القفل للوصول البطاقات البالغ عددها 79 في هذه المجموعة.
فتح الحزمة
k this deck
61
The Queueing Simulator returned the results shown below. Which of the following waiting times in the queue is most likely to occur?
A) 10.0 seconds
B) 12.0 seconds
C) 15.0 seconds
D) 18.0 seconds
E) 20.0 seconds
A) 10.0 seconds
B) 12.0 seconds
C) 15.0 seconds
D) 18.0 seconds
E) 20.0 seconds
فتح الحزمة
افتح القفل للوصول البطاقات البالغ عددها 79 في هذه المجموعة.
فتح الحزمة
k this deck
62
Note: This question requires the use of the Queueing Simulator spreadsheet in Excel. Use the queueing simulator to simulate a queueing system with 2 servers, exponential interarrival times with a mean of 20 seconds and constant service times of 35 seconds. Use a simulation run length of 10,000 arrivals. What is the point estimate for the average number of customers in the system?
A) 2 customers
B) 4 customers
C) 8 customers
D) 9 customers
E) 10 customers
A) 2 customers
B) 4 customers
C) 8 customers
D) 9 customers
E) 10 customers
فتح الحزمة
افتح القفل للوصول البطاقات البالغ عددها 79 في هذه المجموعة.
فتح الحزمة
k this deck
63
The Queueing Simulator returned the results shown below. Which of the following waiting times in the queue is most likely to occur?
A) 60 seconds
B) 80 seconds
C) 90 seconds
D) 100 seconds
E) 120 seconds
A) 60 seconds
B) 80 seconds
C) 90 seconds
D) 100 seconds
E) 120 seconds
فتح الحزمة
افتح القفل للوصول البطاقات البالغ عددها 79 في هذه المجموعة.
فتح الحزمة
k this deck
64
The Queueing Simulator returned the results shown below for a system with 3 servers. If the firm would like their waiting room to be full no more than 2% of the time, how large must their waiting room be?
A) 4 customers
B) 5 customers
C) 6 customers
D) 7 customers
E) 8 customers
A) 4 customers
B) 5 customers
C) 6 customers
D) 7 customers
E) 8 customers
فتح الحزمة
افتح القفل للوصول البطاقات البالغ عددها 79 في هذه المجموعة.
فتح الحزمة
k this deck
65
Which of the following statements about simplifying assumptions in simulations is TRUE?
I) Simplifying assumptions should not be used in simulations.
II) Simplifying assumptions should lead to conservative estimates.
III) Simplifying assumptions should lead to optimistic estimates.
A) I only
B) II only
C) III only
D) I and II only
E) II and III only
I) Simplifying assumptions should not be used in simulations.
II) Simplifying assumptions should lead to conservative estimates.
III) Simplifying assumptions should lead to optimistic estimates.
A) I only
B) II only
C) III only
D) I and II only
E) II and III only
فتح الحزمة
افتح القفل للوصول البطاقات البالغ عددها 79 في هذه المجموعة.
فتح الحزمة
k this deck
66
Customers arrive at a carwash with on average once every 20 minutes. It seems likely that customer arrivals follow an exponential distribution. In a simulation, the random number 0.1398 is generated. How long it will be until the next simulated arrival occurs?
A) 49.35 minutes
B) 39.35 minutes
C) 29.35 minutes
D) 19.35 minutes
E) 9.35 minutes
A) 49.35 minutes
B) 39.35 minutes
C) 29.35 minutes
D) 19.35 minutes
E) 9.35 minutes
فتح الحزمة
افتح القفل للوصول البطاقات البالغ عددها 79 في هذه المجموعة.
فتح الحزمة
k this deck
67
Note: This question requires the use of the Queueing Simulator spreadsheet in Excel. Use the queueing simulator to simulate a queueing system with 2 servers, exponential interarrival times with a mean of 20 seconds and constant service times of 35 seconds. Use a simulation run length of 10,000 arrivals. If you observe the system at a random time, what is the probability that there will be 3 or more customers waiting in line?
A) 0.2
B) 0.4
C) 0.7
D) 0.9
E) 0.99
A) 0.2
B) 0.4
C) 0.7
D) 0.9
E) 0.99
فتح الحزمة
افتح القفل للوصول البطاقات البالغ عددها 79 في هذه المجموعة.
فتح الحزمة
k this deck
68
Service times at a doctor's office take an average of 40 minutes. It seems likely that service times follow an exponential distribution. In a simulation, the random number 0.7588 is generated. How long it will be until the next simulated arrival occurs?
A) 1 minute
B) 6 minutes
C) 11 minutes
D) 16 minutes
E) 21 minutes
A) 1 minute
B) 6 minutes
C) 11 minutes
D) 16 minutes
E) 21 minutes
فتح الحزمة
افتح القفل للوصول البطاقات البالغ عددها 79 في هذه المجموعة.
فتح الحزمة
k this deck
69
Over the course of an eight hour day, a business normally has about 200 customers arrive. Assuming that the customers arrive at about the same rate over the entire day, what is the interarrival time?
A) 1.2 minutes
B) 2.0 minutes
C) 2.4 minutes
D) 3.0 minutes
E) 3.6 minutes
A) 1.2 minutes
B) 2.0 minutes
C) 2.4 minutes
D) 3.0 minutes
E) 3.6 minutes
فتح الحزمة
افتح القفل للوصول البطاقات البالغ عددها 79 في هذه المجموعة.
فتح الحزمة
k this deck
70
Customers arrive at a carwash with on average once every 20 minutes. It seems likely that customer arrivals follow an exponential distribution. In a simulation, what formula would you use to estimate how long it will be until the next arrival occurs?
A) = 20 + (20 − 0) × RAND()
B) = NORM.INV(RAND(),20,3)
C) = NORM.INV(RAND(),20,0)
D) = 20 × LN(RAND())
E) = − 20 × LN(RAND())
A) = 20 + (20 − 0) × RAND()
B) = NORM.INV(RAND(),20,3)
C) = NORM.INV(RAND(),20,0)
D) = 20 × LN(RAND())
E) = − 20 × LN(RAND())
فتح الحزمة
افتح القفل للوصول البطاقات البالغ عددها 79 في هذه المجموعة.
فتح الحزمة
k this deck
71
Note: This question requires the use of the Queueing Simulator spreadsheet in Excel. Use the queueing simulator to simulate a queueing system with 3 servers, uniform interarrival times between 20 and 50 seconds and exponential service times with an average of 75 seconds. Use a simulation run length of 10,000 arrivals. What is the point estimate for the total amount of time a customer will spend in the system?
A) 75 seconds
B) 90 seconds
C) 105 seconds
D) 120 seconds
E) 135 seconds
A) 75 seconds
B) 90 seconds
C) 105 seconds
D) 120 seconds
E) 135 seconds
فتح الحزمة
افتح القفل للوصول البطاقات البالغ عددها 79 في هذه المجموعة.
فتح الحزمة
k this deck
72
Note: This question requires the use of the Queueing Simulator spreadsheet in Excel. Use the queueing simulator to simulate a queueing system with 3 servers, uniform interarrival times between 20 and 50 seconds and exponential service times with an average of 75 seconds. Use a simulation run length of 10,000 arrivals. If you observe the system at a random time, what is the probability that there will be 4 or more customers waiting in line?
A) 0.2
B) 0.4
C) 0.6
D) 0.8
E) 0.9
A) 0.2
B) 0.4
C) 0.6
D) 0.8
E) 0.9
فتح الحزمة
افتح القفل للوصول البطاقات البالغ عددها 79 في هذه المجموعة.
فتح الحزمة
k this deck
73
You are reviewing a simulation model and find that the analyst who prepared the model used the formula =NORM.INV(RAND(),50,3) to generate the cost of a product. Which of the following assumptions did the analyst make about the product cost?
I) The minimum cost is 50.
II) The average (mean) cost is 50.
III) The cost is uniformly distributed.
A) I only
B) II only
C) III only
D) I and II only
E) II and III only
I) The minimum cost is 50.
II) The average (mean) cost is 50.
III) The cost is uniformly distributed.
A) I only
B) II only
C) III only
D) I and II only
E) II and III only
فتح الحزمة
افتح القفل للوصول البطاقات البالغ عددها 79 في هذه المجموعة.
فتح الحزمة
k this deck
74
You are reviewing a simulation model and find that the analyst who prepared the model used the formula = 15 + (45 − 15) × RAND() to generate the simulated cost of a product. Which of the following assumptions did the analyst make about the cost of the product?
I) The minimum cost of the product is 15.
II) The maximum cost of the product is 60.
III) The cost of the product is uniformly distributed.
A) I only
B) II only
C) III only
D) I and II only
E) I and III only
I) The minimum cost of the product is 15.
II) The maximum cost of the product is 60.
III) The cost of the product is uniformly distributed.
A) I only
B) II only
C) III only
D) I and II only
E) I and III only
فتح الحزمة
افتح القفل للوصول البطاقات البالغ عددها 79 في هذه المجموعة.
فتح الحزمة
k this deck
75
The Queueing Simulator returned the results shown below for a system with 2 servers. Which of the following is most likely to occur?
A) A queue waiting time of 40 seconds.
B) A total time in system of 80 seconds.
C) A queue length of 5 customers.
D) A total of 5 customers in the system.
E) All are equally likely.
A) A queue waiting time of 40 seconds.
B) A total time in system of 80 seconds.
C) A queue length of 5 customers.
D) A total of 5 customers in the system.
E) All are equally likely.
فتح الحزمة
افتح القفل للوصول البطاقات البالغ عددها 79 في هذه المجموعة.
فتح الحزمة
k this deck
76
You are reviewing a simulation model and find that the analyst who prepared the model used the formula = 100 + (175 − 100) × RAND() to generate the simulated selling price of a product. Which of the following assumptions did the analyst make about the selling price of the product?
I) The minimum price of the product is 175.
II) The maximum price of the product is 175.
III) The cost of the product is normally distributed.
A) I only
B) II only
C) III only
D) I and II only
E) I and III only
I) The minimum price of the product is 175.
II) The maximum price of the product is 175.
III) The cost of the product is normally distributed.
A) I only
B) II only
C) III only
D) I and II only
E) I and III only
فتح الحزمة
افتح القفل للوصول البطاقات البالغ عددها 79 في هذه المجموعة.
فتح الحزمة
k this deck
77
You are reviewing a simulation model and find that the analyst who prepared the model used the formula =NORM.INV(RAND(),100,5) to generate the waiting time at a restaurant (in seconds). Which of the following assumptions did the analyst make about the waiting time?
I) The minimum waiting time is 100.
II) The average (mean) waiting time is 100.
III) The waiting time is normally distributed.
A) I only
B) II only
C) III only
D) I and II only
E) II and III only
I) The minimum waiting time is 100.
II) The average (mean) waiting time is 100.
III) The waiting time is normally distributed.
A) I only
B) II only
C) III only
D) I and II only
E) II and III only
فتح الحزمة
افتح القفل للوصول البطاقات البالغ عددها 79 في هذه المجموعة.
فتح الحزمة
k this deck
78
Which of the following is NOT a step in the process of conducting a simulation study?
A) Collect the data and formulate the simulation model.
B) Check the accuracy of the simulation model.
C) Plan the simulations to be performed.
D) Present recommendations to management.
E) All of the answers choices are steps in the simulation process.
A) Collect the data and formulate the simulation model.
B) Check the accuracy of the simulation model.
C) Plan the simulations to be performed.
D) Present recommendations to management.
E) All of the answers choices are steps in the simulation process.
فتح الحزمة
افتح القفل للوصول البطاقات البالغ عددها 79 في هذه المجموعة.
فتح الحزمة
k this deck
79
Service times at a doctor's office take an average of 40 minutes. It seems likely that service times follow an exponential distribution. In a simulation, what formula would you use to estimate how long the next service will take?
A) = 40 + (40 − 0) × RAND()
B) = NORM.INV(RAND(),40,4)
C) = NORM.INV(RAND(),40,0)
D) = − 40 × LN(RAND())
E) = 40 × LN(RAND())
A) = 40 + (40 − 0) × RAND()
B) = NORM.INV(RAND(),40,4)
C) = NORM.INV(RAND(),40,0)
D) = − 40 × LN(RAND())
E) = 40 × LN(RAND())
فتح الحزمة
افتح القفل للوصول البطاقات البالغ عددها 79 في هذه المجموعة.
فتح الحزمة
k this deck
فتح الحزمة
افتح القفل للوصول البطاقات البالغ عددها 79 في هذه المجموعة.


