Deck 10: A: Inference From Small Samples
ملء الشاشة (f)
سؤال
سؤال
سؤال
سؤال
A random sample is selected from a normally distributed population. The following sample statistics are obtained: n = 20,  = 30, and s = 10. Based on this information, and using a 95% confidence level, which of the following is a valid calculation from the sample statistics?
A) The critical value is 1.7921.
B) The critical value is 1.96.
C) The standard deviation of the sampling distribution ofis 0.50.
D) The margin of error is approximately4.68.
= 30, and s = 10. Based on this information, and using a 95% confidence level, which of the following is a valid calculation from the sample statistics?A) The critical value is 1.7921.
B) The critical value is 1.96.
C) The standard deviation of the sampling distribution ofis 0.50.
D) The margin of error is approximately4.68.
سؤال
سؤال
سؤال
سؤال
سؤال
سؤال
Suppose that a t test is being conducted at the 0.05 level of significance to test  vs.
vs.  . A sample of size 20 is randomly selected. What is the rejection region?
A) t > -2.093
B) t < -1.729
C) t > 1.725
D) t < 2.086
vs. . A sample of size 20 is randomly selected. What is the rejection region?A) t > -2.093
B) t < -1.729
C) t > 1.725
D) t < 2.086
سؤال
سؤال
سؤال
A major department store chain is interested in estimating the average amount its credit card customers spent. Fifteen credit card accounts were randomly sampled and analyzed with the following results:  = $50.50 and
  = 400. Assuming the distribution of the amount spent is approximately normal, what is the shape of the sampling distribution of the sample mean that will be used to create the desired confidence interval for
  ?
?
A) approximately normal with a mean of $50.50
B) a standard normal distribution
C) a t distribution with 15 degrees of freedom
D) a t distribution with 14 degrees of freedom
= $50.50 and = 400. Assuming the distribution of the amount spent is approximately normal, what is the shape of the sampling distribution of the sample mean that will be used to create the desired confidence interval for ?A) approximately normal with a mean of $50.50
B) a standard normal distribution
C) a t distribution with 15 degrees of freedom
D) a t distribution with 14 degrees of freedom
سؤال
سؤال
سؤال
A major department store chain is interested in estimating the average amount its credit card customers spent. Fifteen credit card accounts were randomly sampled and analyzed with the following results:  = $50.50 and
  = 400. Which of the following is a 95% confidence interval for the average amount the credit card customers spent?
A) $50.50$9.09
B) $50.50$10.12
C) $50.50$11.00
D) $50.50$11.08
= $50.50 and = 400. Which of the following is a 95% confidence interval for the average amount the credit card customers spent?A) $50.50$9.09
B) $50.50$10.12
C) $50.50$11.00
D) $50.50$11.08
سؤال
Researchers determined that 60 tissues is the average number of tissues used during a cold. Suppose a random sample of 100 tissue users yielded the following data on the number of tissues used during a cold:  = 52 and s = 22. Suppose the alternative we wanted to test is
  . Which of the following best describes the rejection region for
  = 0.05?
A) Rejectif t > 1.6604.
B) Rejectif t < -1.6604.
C) Rejectif t > 1.9842 or Z < -1.9842.
D) Rejectif t < -1.9842.
= 52 and s = 22. Suppose the alternative we wanted to test is . Which of the following best describes the rejection region for = 0.05?A) Rejectif t > 1.6604.
B) Rejectif t < -1.6604.
C) Rejectif t > 1.9842 or Z < -1.9842.
D) Rejectif t < -1.9842.
سؤال
سؤال
سؤال
سؤال
We are testing for the difference between the means of two independent populations with equal variances, and samples of  and
and  are taken. What does the number of degrees of freedom equal?
A) 29
B) 28
C) 14
D) 13
and are taken. What does the number of degrees of freedom equal?A) 29
B) 28
C) 14
D) 13
سؤال
In testing whether the means of two normal populations are equal, summary statistics computed for two independent samples are as follows:  ,
,  ,
,  ,
,  ,
,  , and
, and  . Assume that the population variances are equal. What is the standard error of the sampling distribution of the sample mean difference
  ?
?
A) 0.1017
B) 0.3189
C) 1.1275
D) 1.2713
, , , , , and . Assume that the population variances are equal. What is the standard error of the sampling distribution of the sample mean difference ?A) 0.1017
B) 0.3189
C) 1.1275
D) 1.2713
سؤال
سؤال
In testing the difference between two population means using two independent samples, when is the sampling distribution of the sample mean difference  normal?
A) when the sample sizes are both greater than 30
B) when the populations are normal
C) when the populations are non-normal and the sample sizes are large
D) when the populations are non-normal and the sample sizes are small
normal?A) when the sample sizes are both greater than 30
B) when the populations are normal
C) when the populations are non-normal and the sample sizes are large
D) when the populations are non-normal and the sample sizes are small
سؤال
Two independent samples are selected at random from two normal populations. The sample statistics are as follows: 


 and
and  Assuming that a two-tailed hypothesis test is conducted at α = 0.05, what is the critical value?
A) t = 2.0484
B) z = 1.96
C) t = 1.7011
D) z = 1.65
and Assuming that a two-tailed hypothesis test is conducted at α = 0.05, what is the critical value?A) t = 2.0484
B) z = 1.96
C) t = 1.7011
D) z = 1.65
سؤال
سؤال
سؤال
The quantity  is called the pooled variance estimate of the common variance of two unknown but equal population variances. It is the weighted average of the two sample variances. What do the weights represent?
A) sample variances
B) sample standard deviations
C) sample sizes
D) degrees of freedom for each sample
is called the pooled variance estimate of the common variance of two unknown but equal population variances. It is the weighted average of the two sample variances. What do the weights represent?A) sample variances
B) sample standard deviations
C) sample sizes
D) degrees of freedom for each sample
سؤال
Two independent samples of sizes 40 and 50 are randomly selected from two populations to test the difference between the population means  . Which of the following best describes the sampling distribution of the sample mean difference
  ?
?
A) It is normally distributed.
B) It is approximately normal.
C) It is Student's t distributed, with 88 degrees of freedom.
D) It is t distributed, with 88 degrees of freedom.
. Which of the following best describes the sampling distribution of the sample mean difference ?A) It is normally distributed.
B) It is approximately normal.
C) It is Student's t distributed, with 88 degrees of freedom.
D) It is t distributed, with 88 degrees of freedom.
سؤال
Two independent samples are selected at random from two normal populations. The sample statistics are as follows: 


 and
and  Assuming that a two-tailed hypothesis test is conducted at α = 0.05, what is the value of the test statistic?
A) z = 1.645
B) t = 0.891
C) z = 1.960
D) t = 0.928
and Assuming that a two-tailed hypothesis test is conducted at α = 0.05, what is the value of the test statistic?A) z = 1.645
B) t = 0.891
C) z = 1.960
D) t = 0.928
سؤال
سؤال
سؤال
In testing the difference between two population means using two independent samples, under which of the following conditions would we use the pooled variance in estimating the standard error of the sampling distribution of the sample mean difference  ?
?
A) The sample sizes are both large.
B) The populations are normal with equal variances.
C) The populations are non-normal with unequal variances.
?A) The sample sizes are both large.
B) The populations are normal with equal variances.
C) The populations are non-normal with unequal variances.
سؤال
In constructing a 95% confidence interval estimate for the difference between the means of two normally distributed populations, where the unknown population variances are assumed NOT to be equal, summary statistics computed from two independent samples are as follows:  ,
,  ,
,  ,
,  ,
,  , and
, and  . In this case, what is the upper confidence limit?
A) 28.212
B) 24.911
C) 19.123
D) 5.788
, , , , , and . In this case, what is the upper confidence limit?A) 28.212
B) 24.911
C) 19.123
D) 5.788
سؤال
Researchers determine that 60 tissues is the average number of tissues used during a cold. Suppose a random sample of 100 users yielded the following statistics on the number of tissues used during a cold:  = 52 and s = 22. Using the sample information provided, what is the value of the test statistic?
A) t = (52 - 60)/22
B) t = (52 - 60)/(22/10)
C) t = (52 - 60)/(22/100)
D) t = (52 - 60)/(22/1002)
= 52 and s = 22. Using the sample information provided, what is the value of the test statistic?A) t = (52 - 60)/22
B) t = (52 - 60)/(22/10)
C) t = (52 - 60)/(22/100)
D) t = (52 - 60)/(22/1002)
سؤال
سؤال
Based on sample data, the 90% confidence interval limits for the population mean are LCL = 170.86 and UCL = 195.42. If the 10% level of significance were used in testing the hypotheses  vs.
vs.  , what would you conclude?
A) The null hypothesis would be rejected.
B) The null hypothesis would not be rejected.
C) The null hypothesis would have to be revised.
vs. , what would you conclude?A) The null hypothesis would be rejected.
B) The null hypothesis would not be rejected.
C) The null hypothesis would have to be revised.
سؤال
Private colleges and universities rely on money contributed by individuals and corporations for their operating expenses. Much of this money is put into a fund called an endowment, and the college spends only the interest earned by the fund. A recent survey of eight private colleges in Canada revealed the following endowments (in millions of dollars): 60.2, 47.0, 235.1, 490.0, 122.6, 177.5, 95.4, and 220.0. Summary statistics yield  = 180.975 and s = 143.042. Which of the following is a 95% confidence interval for the mean endowment of all the private colleges in Canada?
A) $200.0$94.066
B) $200.0$99.123
C) $200.0$116.621
D) $200.0$119.605
= 180.975 and s = 143.042. Which of the following is a 95% confidence interval for the mean endowment of all the private colleges in Canada?A) $200.0$94.066
B) $200.0$99.123
C) $200.0$116.621
D) $200.0$119.605
سؤال
سؤال
Two independent samples of sizes 20 and 30 are randomly selected from two normally distributed populations in order to test the difference between the population means,  . Assume that the population variances are unknown but equal. From the following options, how may the sampling distribution of the sample mean difference
  best be described?
A) It is normally distributed.
B) It is t distributed with 50 degrees of freedom.
C) It is t distributed with 48 degrees of freedom.
D) It is F distributed with 19 and 29 degrees of freedom.
. Assume that the population variances are unknown but equal. From the following options, how may the sampling distribution of the sample mean difference best be described?A) It is normally distributed.
B) It is t distributed with 50 degrees of freedom.
C) It is t distributed with 48 degrees of freedom.
D) It is F distributed with 19 and 29 degrees of freedom.
سؤال
سؤال
سؤال
سؤال
سؤال
Given the information:  ,
,  ,
,  ,
,  , how many degrees of freedom should be used in the pooled variance t test?
A) 40
B) 38
C) 25
D) 15
, , , , how many degrees of freedom should be used in the pooled variance t test?A) 40
B) 38
C) 25
D) 15
سؤال
سؤال
Which of the following may be used to describe the sampling distribution of the quantity  ?
?
A) It is an F distribution.
B) It is a chi-square distribution.
C) It is a normal distribution.
D) It is a t distribution.
?A) It is an F distribution.
B) It is a chi-square distribution.
C) It is a normal distribution.
D) It is a t distribution.
سؤال
سؤال
In testing for differences between the means of two dependent populations, which of the following is the best formulation of the null hypothesis?
A)
B)
C)
D)
A)
B)
C)
D)
سؤال
In testing for differences between the means of two independent populations, what is the null hypothesis?
A)
B)
C)
D)
A)
B)
C)
D)
سؤال
In testing for differences between the means of two matched pairs populations, how may the null hypothesis best be formulated?
A)
B)
C)
D)
A)
B)
C)
D)
سؤال
سؤال
سؤال
سؤال
سؤال
سؤال
سؤال
We are testing for the difference between the means of two dependent populations (matched pairs experiment) with samples sizes of  and
and  . What would be the number of degrees of freedom?
A) 29
B) 28
C) 14
D) 13
and . What would be the number of degrees of freedom?A) 29
B) 28
C) 14
D) 13
سؤال
In a hypothesis test for the population variance, the hypotheses to be tested are  vs.
vs.  . The sample size is 20 and the test is being carried out at the 10% level of significance. Under which of the following conditions would the null hypothesis be rejected?
A)
B)
C)
D)
vs. . The sample size is 20 and the test is being carried out at the 10% level of significance. Under which of the following conditions would the null hypothesis be rejected?A)
B)
C)
D)
سؤال
سؤال
سؤال
In a hypothesis test for the population variance, the hypotheses are  vs.
vs.  . The sample size is 20 and the test is being carried out at the 5% level of significance. Under which of the following conditions would the null hypothesis be rejected?
A)
B)
C)
D)
vs. . The sample size is 20 and the test is being carried out at the 5% level of significance. Under which of the following conditions would the null hypothesis be rejected?A)
B)
C)
D)
سؤال
Which of the following characteristics must hold if the statistic  is to be chi-square distributed with n - 1 degrees of freedom?
A) The population must be normally distributed with variance equal to.
B) The sample must be normally distributed with variance equal to.
C) The sample must have a Student's t distribution with degrees of freedom equal to n - 1.
is to be chi-square distributed with n - 1 degrees of freedom?A) The population must be normally distributed with variance equal to.
B) The sample must be normally distributed with variance equal to.
C) The sample must have a Student's t distribution with degrees of freedom equal to n - 1.
سؤال
سؤال
سؤال
سؤال
In testing  vs.
vs.  the following sample data were recorded: 11.5, 6.5, and 5.4. What is the p-value of the test?
A) It is between 0.05 and 0.10.
B) It is between 0.10 and 0.20.
C) It is less than 0.05.
D) It is greater than 0.20.
vs. the following sample data were recorded: 11.5, 6.5, and 5.4. What is the p-value of the test?A) It is between 0.05 and 0.10.
B) It is between 0.10 and 0.20.
C) It is less than 0.05.
D) It is greater than 0.20.
سؤال
Two random samples of 10 and 12 observations produced sample variances equal to 7.50 and 3.20, respectively. Which of the following is the calculated value of the test statistic when testing  vs.
vs.  ?
?
A) 10.70
B) 7.50
C) 5.49
D) 3.20
vs. ?A) 10.70
B) 7.50
C) 5.49
D) 3.20
سؤال
In testing  vs.
vs.  the following sample data were recorded: 5.0, 6.1, and 11.1. In this case, what is the value of the test statistic?
A) 10.570
B) 7.400
C) 5.285
D) CHOICE BLANK
vs. the following sample data were recorded: 5.0, 6.1, and 11.1. In this case, what is the value of the test statistic?A) 10.570
B) 7.400
C) 5.285
D) CHOICE BLANK
سؤال
In a hypothesis test for the population variance, the hypotheses are  vs.
vs.  . The sample size is 15 and the test is being carried out at the 10% level of significance. What would be the rejection region?
A) < 6.571 or> 23.685
B) < 7.261 or< 24.996
C) < 7.790 or> 21.064
D) < 8.547 or> 22.307
vs. . The sample size is 15 and the test is being carried out at the 10% level of significance. What would be the rejection region?A) < 6.571 or> 23.685
B) < 7.261 or< 24.996
C) < 7.790 or> 21.064
D) < 8.547 or> 22.307
سؤال
You are testing  vs.
vs.  using a sample of 15 observations and a significance level equal to 0.05. What is the critical value of the test?
A) 1.7613
B) 4.867
C) 6.6450
D) 23.685
vs. using a sample of 15 observations and a significance level equal to 0.05. What is the critical value of the test?A) 1.7613
B) 4.867
C) 6.6450
D) 23.685
سؤال
When testing for the difference between two population variances with sample sizes of  and
and  , what are the numbers of degrees of freedom?
A) 18 and 2
B) 8 and 10
C) 7 and 9
D) 2 and 18
and , what are the numbers of degrees of freedom?A) 18 and 2
B) 8 and 10
C) 7 and 9
D) 2 and 18
سؤال
سؤال
Which of the following statements is correct regarding the percentile points of the F distribution?
A)
B)
C)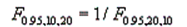
D)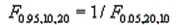
A)
B)
C)
D)
سؤال
سؤال
Which of the following distributions is used when testing  vs.
vs. 
A) chi-square distribution
B) normal distribution
C) F distribution
D) t distribution
vs. A) chi-square distribution
B) normal distribution
C) F distribution
D) t distribution
سؤال
سؤال
سؤال
سؤال

فتح الحزمة
قم بالتسجيل لفتح البطاقات في هذه المجموعة!
Unlock Deck
Unlock Deck
1/192
العب
ملء الشاشة (f)
Deck 10: A: Inference From Small Samples
1
Which of the following is the best description of a robust estimator?
A) It is one that is unbiased and symmetrical about 0.
B) It is one that is consistent and also mound-shaped.
C) It is one that is efficient and less spread out.
D) It is one that is not sensitive to a moderate departure from the assumption of normality in the population.
A) It is one that is unbiased and symmetrical about 0.
B) It is one that is consistent and also mound-shaped.
C) It is one that is efficient and less spread out.
D) It is one that is not sensitive to a moderate departure from the assumption of normality in the population.
D
2
On which of the following does the shape of the Student's t distribution primarily depend?
A) the population variance
B) the number of its degrees of freedom
C) the population mean
D) the range of the data values
A) the population variance
B) the number of its degrees of freedom
C) the population mean
D) the range of the data values
B
3
To estimate with 95% confidence the average number of kilometres that students living off-campus commute to classes every day, a random sample of 20 students was taken and produced a mean equal to 5.2 km and a standard deviation of 3.05 km. Under these circumstances, what is the appropriate critical value?
A) 1.7291
B) 1.96
C) 2.086
D) 2.093
A) 1.7291
B) 1.96
C) 2.086
D) 2.093
D
4
A random sample is selected from a normally distributed population. The following sample statistics are obtained: n = 20, = 30, and s = 10. Based on this information, and using a 95% confidence level, which of the following is a valid calculation from the sample statistics?
A) The critical value is 1.7921.
B) The critical value is 1.96.
C) The standard deviation of the sampling distribution ofis 0.50.
D) The margin of error is approximately4.68.
= 30, and s = 10. Based on this information, and using a 95% confidence level, which of the following is a valid calculation from the sample statistics?A) The critical value is 1.7921.
B) The critical value is 1.96.
C) The standard deviation of the sampling distribution ofis 0.50.
D) The margin of error is approximately4.68.
فتح الحزمة
افتح القفل للوصول البطاقات البالغ عددها 192 في هذه المجموعة.
فتح الحزمة
k this deck
5
A random sample of size 15 taken from a normally distributed population revealed a sample mean of 75 and a sample variance of 25. What would the upper limit of a 95% confidence interval for the population mean equal?
A) 77.769
B) 77.273
C) 72.727
D) 72.231
A) 77.769
B) 77.273
C) 72.727
D) 72.231
فتح الحزمة
افتح القفل للوصول البطاقات البالغ عددها 192 في هذه المجموعة.
فتح الحزمة
k this deck
6
Under which of the following circumstances is it impossible to construct a confidence interval for the population mean?
A) a non-normal population with a large sample and an unknown population variance
B) a normal population with a large sample and a known population variance
C) a non-normal population with a small sample and an unknown population variance
D) a normal population with a small sample and an unknown population variance
فتح الحزمة
افتح القفل للوصول البطاقات البالغ عددها 192 في هذه المجموعة.
فتح الحزمة
k this deck
7
Suppose that a one-tailed t-test is being applied to find out if the population mean is less than 100. The level of significance is 0.05 and 25 observations were sampled. Which of the following best describes the rejection region?
A) t > 1.708
B) t < -1.711
C) t > 1.318
D) t < -1.316
A) t > 1.708
B) t < -1.711
C) t > 1.318
D) t < -1.316
فتح الحزمة
افتح القفل للوصول البطاقات البالغ عددها 192 في هذه المجموعة.
فتح الحزمة
k this deck
8
What do the values in a t distribution table measure?
A) the area under a specified curve, defined by a given number of degrees of freedom, that lies to the left of a specified value of t
B) the area under a specified curve, defined by a given number of degrees of freedom, that lies to the right of a specified value of t
C) the heights of a specified curve, defined by a given number of degrees of freedom, at various specified values of t
D) the specified values of t for different heights of a specified curve, defined by a given number of degrees of freedom
فتح الحزمة
افتح القفل للوصول البطاقات البالغ عددها 192 في هذه المجموعة.
فتح الحزمة
k this deck
9
Which of the following best describes the Student's t distribution?
A) It is a sampling distribution for a random variable, t, derived from a normally distributed population.
B) It is single-peaked distribution above the random variable's mean, median, and mode of value 1.
C) It is always skewed, either to the right or to the left.
A) It is a sampling distribution for a random variable, t, derived from a normally distributed population.
B) It is single-peaked distribution above the random variable's mean, median, and mode of value 1.
C) It is always skewed, either to the right or to the left.
فتح الحزمة
افتح القفل للوصول البطاقات البالغ عددها 192 في هذه المجموعة.
فتح الحزمة
k this deck
10
Suppose that a t test is being conducted at the 0.05 level of significance to test vs. . A sample of size 20 is randomly selected. What is the rejection region?
A) t > -2.093
B) t < -1.729
C) t > 1.725
D) t < 2.086
vs. . A sample of size 20 is randomly selected. What is the rejection region?A) t > -2.093
B) t < -1.729
C) t > 1.725
D) t < 2.086
فتح الحزمة
افتح القفل للوصول البطاقات البالغ عددها 192 في هذه المجموعة.
فتح الحزمة
k this deck
11
Which of the following correctly describes the term "degrees of freedom"?
A) They are equal to the difference between the point estimate located at the interval centre and either the lower or the upper limit of the interval between which the parameter is free to move.
B) They determine the shape of the t distribution, and refer to the number of independent squared deviations inthat are available for estimatingand, in this sense, can be "freely chosen."
C) They equal sample size minus 2 in the case of a single sample.
فتح الحزمة
افتح القفل للوصول البطاقات البالغ عددها 192 في هذه المجموعة.
فتح الحزمة
k this deck
12
To estimate with 95% confidence the average number of kilometres that students living off-campus commute to classes every day, a random sample of 20 students was taken and produced a mean equal to 5.2 km and a standard deviation of 3.05 km. In this case, what would be the approximate value of the upper limit for a 95% confidence interval estimate for the true population mean?
A) 6.63
B) 5.20
C) 3.22
D) 2.15
A) 6.63
B) 5.20
C) 3.22
D) 2.15
فتح الحزمة
افتح القفل للوصول البطاقات البالغ عددها 192 في هذه المجموعة.
فتح الحزمة
k this deck
13
A major department store chain is interested in estimating the average amount its credit card customers spent. Fifteen credit card accounts were randomly sampled and analyzed with the following results: = $50.50 and = 400. Assuming the distribution of the amount spent is approximately normal, what is the shape of the sampling distribution of the sample mean that will be used to create the desired confidence interval for ?
A) approximately normal with a mean of $50.50
B) a standard normal distribution
C) a t distribution with 15 degrees of freedom
D) a t distribution with 14 degrees of freedom
= $50.50 and = 400. Assuming the distribution of the amount spent is approximately normal, what is the shape of the sampling distribution of the sample mean that will be used to create the desired confidence interval for ?A) approximately normal with a mean of $50.50
B) a standard normal distribution
C) a t distribution with 15 degrees of freedom
D) a t distribution with 14 degrees of freedom
فتح الحزمة
افتح القفل للوصول البطاقات البالغ عددها 192 في هذه المجموعة.
فتح الحزمة
k this deck
14
To estimate, with 95% confidence, the average number of kilometres that students living off-campus commute to classes every day, a random sample of 20 students was taken and produced a mean equal to 5.2 km and a standard deviation of 3.05 km. In this case, which of the following is the point estimate for the true population mean?
A) 6.63
B) 5.20
C) 3.22
D) 2.15
A) 6.63
B) 5.20
C) 3.22
D) 2.15
فتح الحزمة
افتح القفل للوصول البطاقات البالغ عددها 192 في هذه المجموعة.
فتح الحزمة
k this deck
15
For a sample of size 20 taken from a normally distributed population with standard deviation equal to 5, which of the following would be required to construct a 90% confidence interval for the population mean?
A) z = 1.96
B) t = 1.729
C) z = 1.645
D) t = 1.328
A) z = 1.96
B) t = 1.729
C) z = 1.645
D) t = 1.328
فتح الحزمة
افتح القفل للوصول البطاقات البالغ عددها 192 في هذه المجموعة.
فتح الحزمة
k this deck
16
A major department store chain is interested in estimating the average amount its credit card customers spent. Fifteen credit card accounts were randomly sampled and analyzed with the following results: = $50.50 and = 400. Which of the following is a 95% confidence interval for the average amount the credit card customers spent?
A) $50.50$9.09
B) $50.50$10.12
C) $50.50$11.00
D) $50.50$11.08
= $50.50 and = 400. Which of the following is a 95% confidence interval for the average amount the credit card customers spent?A) $50.50$9.09
B) $50.50$10.12
C) $50.50$11.00
D) $50.50$11.08
فتح الحزمة
افتح القفل للوصول البطاقات البالغ عددها 192 في هذه المجموعة.
فتح الحزمة
k this deck
17
Researchers determined that 60 tissues is the average number of tissues used during a cold. Suppose a random sample of 100 tissue users yielded the following data on the number of tissues used during a cold: = 52 and s = 22. Suppose the alternative we wanted to test is . Which of the following best describes the rejection region for = 0.05?
A) Rejectif t > 1.6604.
B) Rejectif t < -1.6604.
C) Rejectif t > 1.9842 or Z < -1.9842.
D) Rejectif t < -1.9842.
= 52 and s = 22. Suppose the alternative we wanted to test is . Which of the following best describes the rejection region for = 0.05?A) Rejectif t > 1.6604.
B) Rejectif t < -1.6604.
C) Rejectif t > 1.9842 or Z < -1.9842.
D) Rejectif t < -1.9842.
فتح الحزمة
افتح القفل للوصول البطاقات البالغ عددها 192 في هذه المجموعة.
فتح الحزمة
k this deck
18
A random sample of size n has been selected from a normally distributed population. In hypothesis testing for the population mean, when should the t test be used instead of the z test?
A) when n < 30 andis unknown
B) when n > 30 andis unknown
C) when n < 30 andis known
D) both a and c
A) when n < 30 andis unknown
B) when n > 30 andis unknown
C) when n < 30 andis known
D) both a and c
فتح الحزمة
افتح القفل للوصول البطاقات البالغ عددها 192 في هذه المجموعة.
فتح الحزمة
k this deck
19
When finding a confidence interval for a population mean based on a sample of size 8, which of the following assumptions is made?
A) The population standard deviation,, is known.
B) The sampling distribution of z is normal.
C) The sampled population is approximately normal.
D) There is no special assumption made.
A) The population standard deviation,, is known.
B) The sampling distribution of z is normal.
C) The sampled population is approximately normal.
D) There is no special assumption made.
فتح الحزمة
افتح القفل للوصول البطاقات البالغ عددها 192 في هذه المجموعة.
فتح الحزمة
k this deck
20
As the degrees of freedom for the t distribution increase, which of the following distributions does it more and more closely approximate?
A) the chi-square distribution
B) the standard normal distribution
C) the normal distribution
D) the F distribution
A) the chi-square distribution
B) the standard normal distribution
C) the normal distribution
D) the F distribution
فتح الحزمة
افتح القفل للوصول البطاقات البالغ عددها 192 في هذه المجموعة.
فتح الحزمة
k this deck
21
We are testing for the difference between the means of two independent populations with equal variances, and samples of and are taken. What does the number of degrees of freedom equal?
A) 29
B) 28
C) 14
D) 13
and are taken. What does the number of degrees of freedom equal?A) 29
B) 28
C) 14
D) 13
فتح الحزمة
افتح القفل للوصول البطاقات البالغ عددها 192 في هذه المجموعة.
فتح الحزمة
k this deck
22
In testing whether the means of two normal populations are equal, summary statistics computed for two independent samples are as follows: , , , , , and . Assume that the population variances are equal. What is the standard error of the sampling distribution of the sample mean difference ?
A) 0.1017
B) 0.3189
C) 1.1275
D) 1.2713
, , , , , and . Assume that the population variances are equal. What is the standard error of the sampling distribution of the sample mean difference ?A) 0.1017
B) 0.3189
C) 1.1275
D) 1.2713
فتح الحزمة
افتح القفل للوصول البطاقات البالغ عددها 192 في هذه المجموعة.
فتح الحزمة
k this deck
23
Which one of the following conditions is assumed with the t test for the difference between the means of two independent populations?
A) The respective sample sizes are equal.
B) The respective sample variances are equal.
C) The respective populations are approximately normal.
A) The respective sample sizes are equal.
B) The respective sample variances are equal.
C) The respective populations are approximately normal.
فتح الحزمة
افتح القفل للوصول البطاقات البالغ عددها 192 في هذه المجموعة.
فتح الحزمة
k this deck
24
In testing the difference between two population means using two independent samples, when is the sampling distribution of the sample mean difference normal?
A) when the sample sizes are both greater than 30
B) when the populations are normal
C) when the populations are non-normal and the sample sizes are large
D) when the populations are non-normal and the sample sizes are small
normal?A) when the sample sizes are both greater than 30
B) when the populations are normal
C) when the populations are non-normal and the sample sizes are large
D) when the populations are non-normal and the sample sizes are small
فتح الحزمة
افتح القفل للوصول البطاقات البالغ عددها 192 في هذه المجموعة.
فتح الحزمة
k this deck
25
Two independent samples are selected at random from two normal populations. The sample statistics are as follows: and Assuming that a two-tailed hypothesis test is conducted at α = 0.05, what is the critical value?
A) t = 2.0484
B) z = 1.96
C) t = 1.7011
D) z = 1.65
and Assuming that a two-tailed hypothesis test is conducted at α = 0.05, what is the critical value?A) t = 2.0484
B) z = 1.96
C) t = 1.7011
D) z = 1.65
فتح الحزمة
افتح القفل للوصول البطاقات البالغ عددها 192 في هذه المجموعة.
فتح الحزمة
k this deck
26
Two independent samples of sizes 25 and 35 are randomly selected from two normal populations with equal variances. In order to test the difference between the population means, which of the following would best describe the test statistic?
A) It is a standard normal random variable.
B) It is an approximately standard normal random variable.
C) It is Student's t distributed with 58 degrees of freedom.
D) It is Student's t distributed with 33 degrees of freedom.
A) It is a standard normal random variable.
B) It is an approximately standard normal random variable.
C) It is Student's t distributed with 58 degrees of freedom.
D) It is Student's t distributed with 33 degrees of freedom.
فتح الحزمة
افتح القفل للوصول البطاقات البالغ عددها 192 في هذه المجموعة.
فتح الحزمة
k this deck
27
If you were constructing a 99% confidence interval for the population mean based on a sample of n = 25, where the standard deviation of the sample s = 0.05, what would be the critical value of t?
A) 2.7969
B) 2.7874
C) 2.4922
D) 2.4851
A) 2.7969
B) 2.7874
C) 2.4922
D) 2.4851
فتح الحزمة
افتح القفل للوصول البطاقات البالغ عددها 192 في هذه المجموعة.
فتح الحزمة
k this deck
28
The quantity is called the pooled variance estimate of the common variance of two unknown but equal population variances. It is the weighted average of the two sample variances. What do the weights represent?
A) sample variances
B) sample standard deviations
C) sample sizes
D) degrees of freedom for each sample
is called the pooled variance estimate of the common variance of two unknown but equal population variances. It is the weighted average of the two sample variances. What do the weights represent?A) sample variances
B) sample standard deviations
C) sample sizes
D) degrees of freedom for each sample
فتح الحزمة
افتح القفل للوصول البطاقات البالغ عددها 192 في هذه المجموعة.
فتح الحزمة
k this deck
29
Two independent samples of sizes 40 and 50 are randomly selected from two populations to test the difference between the population means . Which of the following best describes the sampling distribution of the sample mean difference ?
A) It is normally distributed.
B) It is approximately normal.
C) It is Student's t distributed, with 88 degrees of freedom.
D) It is t distributed, with 88 degrees of freedom.
. Which of the following best describes the sampling distribution of the sample mean difference ?A) It is normally distributed.
B) It is approximately normal.
C) It is Student's t distributed, with 88 degrees of freedom.
D) It is t distributed, with 88 degrees of freedom.
فتح الحزمة
افتح القفل للوصول البطاقات البالغ عددها 192 في هذه المجموعة.
فتح الحزمة
k this deck
30
Two independent samples are selected at random from two normal populations. The sample statistics are as follows: and Assuming that a two-tailed hypothesis test is conducted at α = 0.05, what is the value of the test statistic?
A) z = 1.645
B) t = 0.891
C) z = 1.960
D) t = 0.928
and Assuming that a two-tailed hypothesis test is conducted at α = 0.05, what is the value of the test statistic?A) z = 1.645
B) t = 0.891
C) z = 1.960
D) t = 0.928
فتح الحزمة
افتح القفل للوصول البطاقات البالغ عددها 192 في هذه المجموعة.
فتح الحزمة
k this deck
31
In constructing a confidence interval estimate for the difference between the means of two normally distributed populations, using two independent samples, which of the following approaches should we follow?
A) Pool the sample variances when the unknown population variances are equal.
B) Pool the sample variances when the population variances are known and equal.
C) Pool the sample variances when the population means are equal.
D) Never pool the sample variances.
A) Pool the sample variances when the unknown population variances are equal.
B) Pool the sample variances when the population variances are known and equal.
C) Pool the sample variances when the population means are equal.
D) Never pool the sample variances.
فتح الحزمة
افتح القفل للوصول البطاقات البالغ عددها 192 في هذه المجموعة.
فتح الحزمة
k this deck
32
Two samples of sizes 25 and 35 are independently drawn from two normal populations, where the unknown population variances are assumed to be equal. Which one of the following values is the number of degrees of freedom of the equal-variances t test statistic?
A) 60
B) 59
C) 58
D) 35
A) 60
B) 59
C) 58
D) 35
فتح الحزمة
افتح القفل للوصول البطاقات البالغ عددها 192 في هذه المجموعة.
فتح الحزمة
k this deck
33
In testing the difference between two population means using two independent samples, under which of the following conditions would we use the pooled variance in estimating the standard error of the sampling distribution of the sample mean difference ?
A) The sample sizes are both large.
B) The populations are normal with equal variances.
C) The populations are non-normal with unequal variances.
?A) The sample sizes are both large.
B) The populations are normal with equal variances.
C) The populations are non-normal with unequal variances.
فتح الحزمة
افتح القفل للوصول البطاقات البالغ عددها 192 في هذه المجموعة.
فتح الحزمة
k this deck
34
In constructing a 95% confidence interval estimate for the difference between the means of two normally distributed populations, where the unknown population variances are assumed NOT to be equal, summary statistics computed from two independent samples are as follows: , , , , , and . In this case, what is the upper confidence limit?
A) 28.212
B) 24.911
C) 19.123
D) 5.788
, , , , , and . In this case, what is the upper confidence limit?A) 28.212
B) 24.911
C) 19.123
D) 5.788
فتح الحزمة
افتح القفل للوصول البطاقات البالغ عددها 192 في هذه المجموعة.
فتح الحزمة
k this deck
35
Researchers determine that 60 tissues is the average number of tissues used during a cold. Suppose a random sample of 100 users yielded the following statistics on the number of tissues used during a cold: = 52 and s = 22. Using the sample information provided, what is the value of the test statistic?
A) t = (52 - 60)/22
B) t = (52 - 60)/(22/10)
C) t = (52 - 60)/(22/100)
D) t = (52 - 60)/(22/1002)
= 52 and s = 22. Using the sample information provided, what is the value of the test statistic?A) t = (52 - 60)/22
B) t = (52 - 60)/(22/10)
C) t = (52 - 60)/(22/100)
D) t = (52 - 60)/(22/1002)
فتح الحزمة
افتح القفل للوصول البطاقات البالغ عددها 192 في هذه المجموعة.
فتح الحزمة
k this deck
36
In testing the difference between the means of two normally distributed populations, the number of degrees of freedom associated with the unequal-variances t test statistic usually results in a non-integer number. In this situation, what is the best recommendation in order to proceed?
A) You should round it up to the nearest integer.
B) You should round it down to the nearest integer.
C) You should change the sample sizes until the number of degrees of freedom becomes an integer.
D) You should assume that the population variances are equal, and then use df =.
A) You should round it up to the nearest integer.
B) You should round it down to the nearest integer.
C) You should change the sample sizes until the number of degrees of freedom becomes an integer.
D) You should assume that the population variances are equal, and then use df =.
فتح الحزمة
افتح القفل للوصول البطاقات البالغ عددها 192 في هذه المجموعة.
فتح الحزمة
k this deck
37
Based on sample data, the 90% confidence interval limits for the population mean are LCL = 170.86 and UCL = 195.42. If the 10% level of significance were used in testing the hypotheses vs. , what would you conclude?
A) The null hypothesis would be rejected.
B) The null hypothesis would not be rejected.
C) The null hypothesis would have to be revised.
vs. , what would you conclude?A) The null hypothesis would be rejected.
B) The null hypothesis would not be rejected.
C) The null hypothesis would have to be revised.
فتح الحزمة
افتح القفل للوصول البطاقات البالغ عددها 192 في هذه المجموعة.
فتح الحزمة
k this deck
38
Private colleges and universities rely on money contributed by individuals and corporations for their operating expenses. Much of this money is put into a fund called an endowment, and the college spends only the interest earned by the fund. A recent survey of eight private colleges in Canada revealed the following endowments (in millions of dollars): 60.2, 47.0, 235.1, 490.0, 122.6, 177.5, 95.4, and 220.0. Summary statistics yield = 180.975 and s = 143.042. Which of the following is a 95% confidence interval for the mean endowment of all the private colleges in Canada?
A) $200.0$94.066
B) $200.0$99.123
C) $200.0$116.621
D) $200.0$119.605
= 180.975 and s = 143.042. Which of the following is a 95% confidence interval for the mean endowment of all the private colleges in Canada?A) $200.0$94.066
B) $200.0$99.123
C) $200.0$116.621
D) $200.0$119.605
فتح الحزمة
افتح القفل للوصول البطاقات البالغ عددها 192 في هذه المجموعة.
فتح الحزمة
k this deck
39
Which of the following is NOT a required assumption for constructing a confidence interval estimate of the difference between two population means when the samples are small?
A) The populations are normally distributed.
B) The population variances are equal.
C) The population variances are both equal to 1.
D) The samples are selected at random from the populations.
A) The populations are normally distributed.
B) The population variances are equal.
C) The population variances are both equal to 1.
D) The samples are selected at random from the populations.
فتح الحزمة
افتح القفل للوصول البطاقات البالغ عددها 192 في هذه المجموعة.
فتح الحزمة
k this deck
40
Two independent samples of sizes 20 and 30 are randomly selected from two normally distributed populations in order to test the difference between the population means, . Assume that the population variances are unknown but equal. From the following options, how may the sampling distribution of the sample mean difference best be described?
A) It is normally distributed.
B) It is t distributed with 50 degrees of freedom.
C) It is t distributed with 48 degrees of freedom.
D) It is F distributed with 19 and 29 degrees of freedom.
. Assume that the population variances are unknown but equal. From the following options, how may the sampling distribution of the sample mean difference best be described?A) It is normally distributed.
B) It is t distributed with 50 degrees of freedom.
C) It is t distributed with 48 degrees of freedom.
D) It is F distributed with 19 and 29 degrees of freedom.
فتح الحزمة
افتح القفل للوصول البطاقات البالغ عددها 192 في هذه المجموعة.
فتح الحزمة
k this deck
41
Which of the following values is the number of degrees of freedom associated with the t test when the data are gathered from a matched pairs experiment with 21 pairs?
A) 9
B) 10
C) 18
D) 20
A) 9
B) 10
C) 18
D) 20
فتح الحزمة
افتح القفل للوصول البطاقات البالغ عددها 192 في هذه المجموعة.
فتح الحزمة
k this deck
42
A test is being conducted to test the difference between two population means using data that are gathered from a matched pairs experiment. If the paired differences are normal, then which distribution should be used for testing?
A) normal distribution
B) binomial distribution
C) Student t distribution
D) F distribution
A) normal distribution
B) binomial distribution
C) Student t distribution
D) F distribution
فتح الحزمة
افتح القفل للوصول البطاقات البالغ عددها 192 في هذه المجموعة.
فتح الحزمة
k this deck
43
What is the number of degrees of freedom associated with the t test when the data are gathered from a matched pairs experiment with 10 pairs?
A) 9
B) 10
C) 18
D) 20
A) 9
B) 10
C) 18
D) 20
فتح الحزمة
افتح القفل للوصول البطاقات البالغ عددها 192 في هذه المجموعة.
فتح الحزمة
k this deck
44
Which of the following could be one possible reason for performing a paired-difference experiment?
A) to reduce the degrees of freedom
B) to allow one to use a larger value of
C) to reduce the quantity of information in the experiment
D) to reduce the variability in the sample data
A) to reduce the degrees of freedom
B) to allow one to use a larger value of
C) to reduce the quantity of information in the experiment
D) to reduce the variability in the sample data
فتح الحزمة
افتح القفل للوصول البطاقات البالغ عددها 192 في هذه المجموعة.
فتح الحزمة
k this deck
45
Given the information: , , , , how many degrees of freedom should be used in the pooled variance t test?
A) 40
B) 38
C) 25
D) 15
, , , , how many degrees of freedom should be used in the pooled variance t test?A) 40
B) 38
C) 25
D) 15
فتح الحزمة
افتح القفل للوصول البطاقات البالغ عددها 192 في هذه المجموعة.
فتح الحزمة
k this deck
46
Which of the following is a characteristic of the chi-square distribution?
A) symmetric around 0
B) positively skewed
C) negatively skewed
D) mound-shaped
A) symmetric around 0
B) positively skewed
C) negatively skewed
D) mound-shaped
فتح الحزمة
افتح القفل للوصول البطاقات البالغ عددها 192 في هذه المجموعة.
فتح الحزمة
k this deck
47
Which of the following may be used to describe the sampling distribution of the quantity ?
A) It is an F distribution.
B) It is a chi-square distribution.
C) It is a normal distribution.
D) It is a t distribution.
?A) It is an F distribution.
B) It is a chi-square distribution.
C) It is a normal distribution.
D) It is a t distribution.
فتح الحزمة
افتح القفل للوصول البطاقات البالغ عددها 192 في هذه المجموعة.
فتح الحزمة
k this deck
48
For which kinds of data can we design a matched pairs experiment? Choose the best response.
A) observational
B) experimental
C) controlled
D) observational, experimental, and controlled
A) observational
B) experimental
C) controlled
D) observational, experimental, and controlled
فتح الحزمة
افتح القفل للوصول البطاقات البالغ عددها 192 في هذه المجموعة.
فتح الحزمة
k this deck
49
In testing for differences between the means of two dependent populations, which of the following is the best formulation of the null hypothesis?
A)
B)
C)
D)
A)
B)
C)
D)
فتح الحزمة
افتح القفل للوصول البطاقات البالغ عددها 192 في هذه المجموعة.
فتح الحزمة
k this deck
50
In testing for differences between the means of two independent populations, what is the null hypothesis?
A)
B)
C)
D)
A)
B)
C)
D)
فتح الحزمة
افتح القفل للوصول البطاقات البالغ عددها 192 في هذه المجموعة.
فتح الحزمة
k this deck
51
In testing for differences between the means of two matched pairs populations, how may the null hypothesis best be formulated?
A)
B)
C)
D)
A)
B)
C)
D)
فتح الحزمة
افتح القفل للوصول البطاقات البالغ عددها 192 في هذه المجموعة.
فتح الحزمة
k this deck
52
Which sampling distribution is used to make inferences about a single population variance?
A) a normal distribution
B) a t distribution
C) an F distribution
D) a chi-square distribution
A) a normal distribution
B) a t distribution
C) an F distribution
D) a chi-square distribution
فتح الحزمة
افتح القفل للوصول البطاقات البالغ عددها 192 في هذه المجموعة.
فتح الحزمة
k this deck
53
On which of the following does the shape of the chi-square distribution depend?
A) the population variance
B) the number of its degrees of freedom
C) the population mean
D) the range of the data values
A) the population variance
B) the number of its degrees of freedom
C) the population mean
D) the range of the data values
فتح الحزمة
افتح القفل للوصول البطاقات البالغ عددها 192 في هذه المجموعة.
فتح الحزمة
k this deck
54
You wish to test the difference between the means of two paired populations with samples of size 30 each. What is the appropriate value of the degrees of freedom for this test?
A) 29
B) 28
C) 15
D) 14
A) 29
B) 28
C) 15
D) 14
فتح الحزمة
افتح القفل للوصول البطاقات البالغ عددها 192 في هذه المجموعة.
فتح الحزمة
k this deck
55
In what type of test is the variable of interest the difference between the values of the observations rather than the observations themselves?
A) a test for the equality of variances from two independent populations
B) a test for the difference between the means of two dependent populations
C) a test for the difference between the means of two independent populations
A) a test for the equality of variances from two independent populations
B) a test for the difference between the means of two dependent populations
C) a test for the difference between the means of two independent populations
فتح الحزمة
افتح القفل للوصول البطاقات البالغ عددها 192 في هذه المجموعة.
فتح الحزمة
k this deck
56
Which of the following is an assumption behind the paired-difference t test for the mean difference between two populations?
A) The populations are approximately normally distributed.
B) The sample variances are equal.
C) The sample means are equal.
D) The two samples are independent.
A) The populations are approximately normally distributed.
B) The sample variances are equal.
C) The sample means are equal.
D) The two samples are independent.
فتح الحزمة
افتح القفل للوصول البطاقات البالغ عددها 192 في هذه المجموعة.
فتح الحزمة
k this deck
57
A random sample of 20 observations is selected from a normally distributed population. The sample variance is 12. What is the upper limit of the 95% confidence interval for the population variance?
A) 6.940
B) 7.564
C) 22.536
D) 25.599
A) 6.940
B) 7.564
C) 22.536
D) 25.599
فتح الحزمة
افتح القفل للوصول البطاقات البالغ عددها 192 في هذه المجموعة.
فتح الحزمة
k this deck
58
We are testing for the difference between the means of two dependent populations (matched pairs experiment) with samples sizes of and . What would be the number of degrees of freedom?
A) 29
B) 28
C) 14
D) 13
and . What would be the number of degrees of freedom?A) 29
B) 28
C) 14
D) 13
فتح الحزمة
افتح القفل للوصول البطاقات البالغ عددها 192 في هذه المجموعة.
فتح الحزمة
k this deck
59
In a hypothesis test for the population variance, the hypotheses to be tested are vs. . The sample size is 20 and the test is being carried out at the 10% level of significance. Under which of the following conditions would the null hypothesis be rejected?
A)
B)
C)
D)
vs. . The sample size is 20 and the test is being carried out at the 10% level of significance. Under which of the following conditions would the null hypothesis be rejected?A)
B)
C)
D)
فتح الحزمة
افتح القفل للوصول البطاقات البالغ عددها 192 في هذه المجموعة.
فتح الحزمة
k this deck
60
What is the term used to describe samples in which there exists some natural relationship between each pair of observations that provides a logical reason to compare the first observation of sample 1 with the first observation of sample 2, the second observation of sample 1 with the second observation of sample 2, and so on?
A) matched samples
B) independent samples
C) weighted samples
D) random samples
A) matched samples
B) independent samples
C) weighted samples
D) random samples
فتح الحزمة
افتح القفل للوصول البطاقات البالغ عددها 192 في هذه المجموعة.
فتح الحزمة
k this deck
61
A hypothesis test is to be conducted regarding a population variance. Which distribution would be used to obtain the critical value of the test?
A) a normal distribution
B) a t distribution with n - 1 degrees of freedom
C) a chi-square distribution with n - 1 degrees of freedom
D) a binomial distribution
A) a normal distribution
B) a t distribution with n - 1 degrees of freedom
C) a chi-square distribution with n - 1 degrees of freedom
D) a binomial distribution
فتح الحزمة
افتح القفل للوصول البطاقات البالغ عددها 192 في هذه المجموعة.
فتح الحزمة
k this deck
62
In a hypothesis test for the population variance, the hypotheses are vs. . The sample size is 20 and the test is being carried out at the 5% level of significance. Under which of the following conditions would the null hypothesis be rejected?
A)
B)
C)
D)
vs. . The sample size is 20 and the test is being carried out at the 5% level of significance. Under which of the following conditions would the null hypothesis be rejected?A)
B)
C)
D)
فتح الحزمة
افتح القفل للوصول البطاقات البالغ عددها 192 في هذه المجموعة.
فتح الحزمة
k this deck
63
Which of the following characteristics must hold if the statistic is to be chi-square distributed with n - 1 degrees of freedom?
A) The population must be normally distributed with variance equal to.
B) The sample must be normally distributed with variance equal to.
C) The sample must have a Student's t distribution with degrees of freedom equal to n - 1.
is to be chi-square distributed with n - 1 degrees of freedom?A) The population must be normally distributed with variance equal to.
B) The sample must be normally distributed with variance equal to.
C) The sample must have a Student's t distribution with degrees of freedom equal to n - 1.
فتح الحزمة
افتح القفل للوصول البطاقات البالغ عددها 192 في هذه المجموعة.
فتح الحزمة
k this deck
64
Which of these statements could be used to describe the chi-square distribution?
A) It is symmetrical about 0.
B) It is positively skewed, ranging between 0 and.
C) It is negatively skewed ranging between -and 0.
D) It is mound-shaped.
A) It is symmetrical about 0.
B) It is positively skewed, ranging between 0 and.
C) It is negatively skewed ranging between -and 0.
D) It is mound-shaped.
فتح الحزمة
افتح القفل للوصول البطاقات البالغ عددها 192 في هذه المجموعة.
فتح الحزمة
k this deck
65
On which of the following does the shape of the chi-square distribution depend?
A) the population size
B) the number of its degrees of freedom
C) the population standard deviation
D) whether the population is unimodal or bimodal
A) the population size
B) the number of its degrees of freedom
C) the population standard deviation
D) whether the population is unimodal or bimodal
فتح الحزمة
افتح القفل للوصول البطاقات البالغ عددها 192 في هذه المجموعة.
فتح الحزمة
k this deck
66
Which of the following best describes the sampling distribution of the ratio of two independent sample variances selected randomly from normal populations with equal variances?
A) It is a normal distribution.
B) It is a t distribution.
C) It is an F distribution.
D) It is a chi-square distribution.
A) It is a normal distribution.
B) It is a t distribution.
C) It is an F distribution.
D) It is a chi-square distribution.
فتح الحزمة
افتح القفل للوصول البطاقات البالغ عددها 192 في هذه المجموعة.
فتح الحزمة
k this deck
67
In testing vs. the following sample data were recorded: 11.5, 6.5, and 5.4. What is the p-value of the test?
A) It is between 0.05 and 0.10.
B) It is between 0.10 and 0.20.
C) It is less than 0.05.
D) It is greater than 0.20.
vs. the following sample data were recorded: 11.5, 6.5, and 5.4. What is the p-value of the test?A) It is between 0.05 and 0.10.
B) It is between 0.10 and 0.20.
C) It is less than 0.05.
D) It is greater than 0.20.
فتح الحزمة
افتح القفل للوصول البطاقات البالغ عددها 192 في هذه المجموعة.
فتح الحزمة
k this deck
68
Two random samples of 10 and 12 observations produced sample variances equal to 7.50 and 3.20, respectively. Which of the following is the calculated value of the test statistic when testing vs. ?
A) 10.70
B) 7.50
C) 5.49
D) 3.20
vs. ?A) 10.70
B) 7.50
C) 5.49
D) 3.20
فتح الحزمة
افتح القفل للوصول البطاقات البالغ عددها 192 في هذه المجموعة.
فتح الحزمة
k this deck
69
In testing vs. the following sample data were recorded: 5.0, 6.1, and 11.1. In this case, what is the value of the test statistic?
A) 10.570
B) 7.400
C) 5.285
D) CHOICE BLANK
vs. the following sample data were recorded: 5.0, 6.1, and 11.1. In this case, what is the value of the test statistic?A) 10.570
B) 7.400
C) 5.285
D) CHOICE BLANK
فتح الحزمة
افتح القفل للوصول البطاقات البالغ عددها 192 في هذه المجموعة.
فتح الحزمة
k this deck
70
In a hypothesis test for the population variance, the hypotheses are vs. . The sample size is 15 and the test is being carried out at the 10% level of significance. What would be the rejection region?
A) < 6.571 or> 23.685
B) < 7.261 or< 24.996
C) < 7.790 or> 21.064
D) < 8.547 or> 22.307
vs. . The sample size is 15 and the test is being carried out at the 10% level of significance. What would be the rejection region?A) < 6.571 or> 23.685
B) < 7.261 or< 24.996
C) < 7.790 or> 21.064
D) < 8.547 or> 22.307
فتح الحزمة
افتح القفل للوصول البطاقات البالغ عددها 192 في هذه المجموعة.
فتح الحزمة
k this deck
71
You are testing vs. using a sample of 15 observations and a significance level equal to 0.05. What is the critical value of the test?
A) 1.7613
B) 4.867
C) 6.6450
D) 23.685
vs. using a sample of 15 observations and a significance level equal to 0.05. What is the critical value of the test?A) 1.7613
B) 4.867
C) 6.6450
D) 23.685
فتح الحزمة
افتح القفل للوصول البطاقات البالغ عددها 192 في هذه المجموعة.
فتح الحزمة
k this deck
72
When testing for the difference between two population variances with sample sizes of and , what are the numbers of degrees of freedom?
A) 18 and 2
B) 8 and 10
C) 7 and 9
D) 2 and 18
and , what are the numbers of degrees of freedom?A) 18 and 2
B) 8 and 10
C) 7 and 9
D) 2 and 18
فتح الحزمة
افتح القفل للوصول البطاقات البالغ عددها 192 في هذه المجموعة.
فتح الحزمة
k this deck
73
A random sample of size 20 taken from a normally distributed population resulted in a sample variance of 32. What would be the lower limit of a 90% confidence interval for the population variance?
A) 20.170
B) 20.375
C) 52.185
D) 54.931
A) 20.170
B) 20.375
C) 52.185
D) 54.931
فتح الحزمة
افتح القفل للوصول البطاقات البالغ عددها 192 في هذه المجموعة.
فتح الحزمة
k this deck
74
Which of the following statements is correct regarding the percentile points of the F distribution?
A)
B)
C)
D)
A)
B)
C)
D)
فتح الحزمة
افتح القفل للوصول البطاقات البالغ عددها 192 في هذه المجموعة.
فتح الحزمة
k this deck
75
A random sample of size 25 taken from a normally distributed population resulted in a sample standard deviation of 0.93054. What are the lower and upper limits of a 99% confidence interval for the population variance?
A) 9.886 and 45.559
B) 3.144 and 6.750
C) 0.678 and 1.449
D) 0.456 and 2.102
A) 9.886 and 45.559
B) 3.144 and 6.750
C) 0.678 and 1.449
D) 0.456 and 2.102
فتح الحزمة
افتح القفل للوصول البطاقات البالغ عددها 192 في هذه المجموعة.
فتح الحزمة
k this deck
76
Which of the following distributions is used when testing vs.
A) chi-square distribution
B) normal distribution
C) F distribution
D) t distribution
vs. A) chi-square distribution
B) normal distribution
C) F distribution
D) t distribution
فتح الحزمة
افتح القفل للوصول البطاقات البالغ عددها 192 في هذه المجموعة.
فتح الحزمة
k this deck
77
A researcher wants to test for the equality of two population variances when the populations are normally distributed. He has opted for a10% level of significance . Which of the following upper-tail areas of the F table must he use to determine the rejection region?
A) 0.90
B) 0.20
C) 0.10
D) 0.05
A) 0.90
B) 0.20
C) 0.10
D) 0.05
فتح الحزمة
افتح القفل للوصول البطاقات البالغ عددها 192 في هذه المجموعة.
فتح الحزمة
k this deck
78
For which of the following ratios is its sampling distribution the F distribution ?
A) the ratio of two normal population variances
B) the ratio of two normal population means
C) the ratio of two sample variances provided that the samples are independently drawn from two normal populations with equal variances
D) the ratio of two sample variances provided that the sample sizes are large
فتح الحزمة
افتح القفل للوصول البطاقات البالغ عددها 192 في هذه المجموعة.
فتح الحزمة
k this deck
79
Which of the following is NOT a property of the F distribution?
A) F distributions are non-symmetrical.
B) F distributions have (n - 1) degrees of freedom.
C) F can assume only positive values.
D) There are many F distributions and each has a different shape.
A) F distributions are non-symmetrical.
B) F distributions have (n - 1) degrees of freedom.
C) F can assume only positive values.
D) There are many F distributions and each has a different shape.
فتح الحزمة
افتح القفل للوصول البطاقات البالغ عددها 192 في هذه المجموعة.
فتح الحزمة
k this deck
80
A random sample of 25 observations is selected from a normally distributed population. The sample variance is 10. What is the upper limit of the 95% confidence interval for the population variance?
A) 6.097
B) 17.110
C) 17.331
D) 19.353
A) 6.097
B) 17.110
C) 17.331
D) 19.353
فتح الحزمة
افتح القفل للوصول البطاقات البالغ عددها 192 في هذه المجموعة.
فتح الحزمة
k this deck
فتح الحزمة
افتح القفل للوصول البطاقات البالغ عددها 192 في هذه المجموعة.


