Deck 3: An Overview of Long-Run Economic Growth
ملء الشاشة (f)
سؤال
سؤال
The growth rate of any variable y between periods t and t +1 is the ________ and is given by the term ________.
A) percentage of that variable;
B) percentage change in that variable;
C) change in that variable;
D) percent of that variable;
E) percent change in that variable;
A) percentage of that variable;
B) percentage change in that variable;
C) change in that variable;
D) percent of that variable;
E) percent change in that variable;
سؤال
سؤال
Defining per capita GDP in 2016 as y2016 and per capita GDP in 2015 as y2015, the growth rate of per capita GDP,  , from 2015 to 2016 is given by:
A)
B) .
.
C) .
.
D) .
.
E)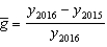 .
.
, from 2015 to 2016 is given by:A)
B)
.C)
.D)
.E)
. سؤال
سؤال
سؤال
سؤال
سؤال
سؤال
سؤال
سؤال
سؤال
سؤال
سؤال
سؤال
سؤال
سؤال
سؤال
سؤال
سؤال
سؤال
سؤال
Suppose there are L0 people in the world today. If the population growth rate equals  , then in 50 years, the world population will be:
A) .
.
B)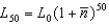 .
.
C)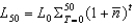 .
.
D)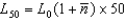 .
.
E)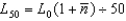 .
.
, then in 50 years, the world population will be:A)
.B)
.C)
.D)
.E)
. سؤال
سؤال
سؤال
سؤال
Suppose population growth is given by  , where L0 is the population today,
Is the population in t periods, and
Is the population constant growth rate. If we do not know what value
Takes but do know the values of L0,
, and t, we can calculate
By punching ________ into our calculators.
A)
B)
C)
D)
E)
, where L0 is the population today, Is the population in t periods, and
Is the population constant growth rate. If we do not know what value
Takes but do know the values of L0,
, and t, we can calculate
By punching ________ into our calculators.
A)
B)
C)
D)
E)
سؤال
According to the constant growth rate rule, if a variable starts at some initial value y0 at t = 0 and grows at  at a constant rate
Then the value of the variable in three periods is given by:
A) .
.
B) .
.
C) .
.
D) .
.
E) .
.
at a constant rate Then the value of the variable in three periods is given by:
A)
.B)
.C)
.D)
.E)
. سؤال
سؤال
سؤال
سؤال
سؤال
سؤال
سؤال
سؤال
سؤال
سؤال
سؤال
سؤال
سؤال
Suppose k, l, and A grow at constant rates given by  and
and 
What is the growth rate of y if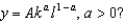
A)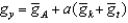
B)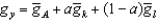
C)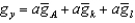
D)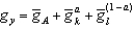
E)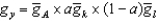
and What is the growth rate of y if
A)
B)
C)
D)
E)
سؤال
سؤال
سؤال
Suppose k, l, and m grow at constant rates given by 

And
What is the growth rate of y if
A)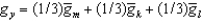
B)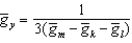
C)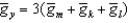
D)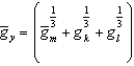
E)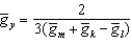
And
What is the growth rate of y if
A)
B)
C)
D)
E)
سؤال
سؤال
سؤال
سؤال
Suppose k, l, and A grow at constant rates given by 

And
What is the growth rate of y if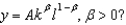
A)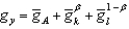
B)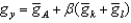
C)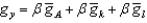
D)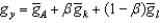
E)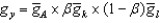
And
What is the growth rate of y if
A)
B)
C)
D)
E)
سؤال
سؤال
سؤال
سؤال
Suppose k, l, and m grow at constant rates given by 

And
What is the growth rate of
A)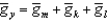
B)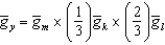
C)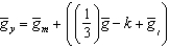
D)
E)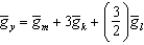
And
What is the growth rate of
A)
B)
C)
D)
E)
سؤال
سؤال
سؤال
Suppose k, l, and A grow at constant rates given by 

And
) What is the growth rate of y if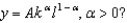
A)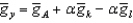
B)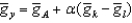
C)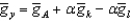
D)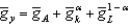
E)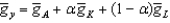
And
) What is the growth rate of y if
A)
B)
C)
D)
E)
سؤال
سؤال
سؤال
Suppose k and l grow at constant rates given by  and
and 
What is the growth rate of y if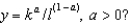
A)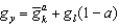
B)
C)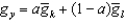
D)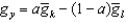
E)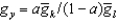
and What is the growth rate of y if
A)
B)
C)
D)
E)
سؤال
سؤال
Suppose K and L grow at constant rates given by  and
and 
What is the growth rate of y if
A)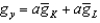
B)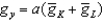
C)
D)
E)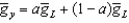
and What is the growth rate of y if
A)
B)
C)
D)
E)
سؤال
سؤال
سؤال
Suppose k grows at a rate of  percent and l grows at a rate of
Percent. If
Then y grows at ________ percent.
A) 3
B) 4
C) -3
D) 12
E) -4
percent and l grows at a rate of Percent. If
Then y grows at ________ percent.
A) 3
B) 4
C) -3
D) 12
E) -4
سؤال
Suppose k grows at a rate of  percent and l grows at a rate of
Percent. If
Then y grows at ________ percent.
A) 6
B) 5
C) 7
D) -6
E) 12
percent and l grows at a rate of Percent. If
Then y grows at ________ percent.
A) 6
B) 5
C) 7
D) -6
E) 12
سؤال
سؤال
سؤال
Suppose x grows at a rate of  percent and y grows at a rate of
Percent. If z = y * x, then z grows at ________ percent; if z = x/y, z grows at ________ percent.
A) 7; -17
B) -17; 7
C) 17; -7
D) 60; 42
E) 60; -42
percent and y grows at a rate of Percent. If z = y * x, then z grows at ________ percent; if z = x/y, z grows at ________ percent.
A) 7; -17
B) -17; 7
C) 17; -7
D) 60; 42
E) 60; -42
سؤال
Suppose x grows at a rate of  percent and y grows at a rate of
Percent. If z = x * y, then z grows at ________ percent; if z =x/y, z grows at ________ percent.
A) 0; 6
B) 6; 0
C) 6; 12
D) -6; 6
E) 1; 0
percent and y grows at a rate of Percent. If z = x * y, then z grows at ________ percent; if z =x/y, z grows at ________ percent.
A) 0; 6
B) 6; 0
C) 6; 12
D) -6; 6
E) 1; 0
سؤال
Suppose k grows at a rate of  percent and l grows at a rate of
Percent. If
Then y grows at ________ percent.
A) -6
B) 5
C) 6
D) -10
E) 12
percent and l grows at a rate of Percent. If
Then y grows at ________ percent.
A) -6
B) 5
C) 6
D) -10
E) 12
سؤال
سؤال
سؤال
سؤال
سؤال
سؤال
سؤال
Suppose k grows at a rate of  percent and l grows at a rate of
Percent. If
Then y grows at ________ percent.
A) 5
B) 15
C) 9
D) 4
E) 3
percent and l grows at a rate of Percent. If
Then y grows at ________ percent.
A) 5
B) 15
C) 9
D) 4
E) 3
سؤال
سؤال
سؤال
سؤال

فتح الحزمة
قم بالتسجيل لفتح البطاقات في هذه المجموعة!
Unlock Deck
Unlock Deck
1/110
العب
ملء الشاشة (f)
Deck 3: An Overview of Long-Run Economic Growth
1
The era of modern economic growth began about:
A) the time of the Egyptian pharaohs.
B) 500 years ago.
C) the time of Caesar.
D) the time of the Renaissance.
E) 300 years ago.
A) the time of the Egyptian pharaohs.
B) 500 years ago.
C) the time of Caesar.
D) the time of the Renaissance.
E) 300 years ago.
300 years ago.
2
The growth rate of any variable y between periods t and t +1 is the ________ and is given by the term ________.
A) percentage of that variable;
B) percentage change in that variable;
C) change in that variable;
D) percent of that variable;
E) percent change in that variable;
A) percentage of that variable;
B) percentage change in that variable;
C) change in that variable;
D) percent of that variable;
E) percent change in that variable;
percentage change in that variable;
3
According to historical data, the wages in ancient Greece and Rome were ________ in fifteenth-century Britain or seventeenth-century France.
A) somewhat lower than
B) a lot higher than
C) a lot lower than
D) about the same as
E) None of these answers is correct.
A) somewhat lower than
B) a lot higher than
C) a lot lower than
D) about the same as
E) None of these answers is correct.
about the same as
4
Defining per capita GDP in 2016 as y2016 and per capita GDP in 2015 as y2015, the growth rate of per capita GDP, , from 2015 to 2016 is given by:
A)
B) .
C) .
D) .
E) .
, from 2015 to 2016 is given by:A)
B)
.C)
.D)
.E)
. فتح الحزمة
افتح القفل للوصول البطاقات البالغ عددها 110 في هذه المجموعة.
فتح الحزمة
k this deck
5
If per capita GDP in 2014 was $900, in 2015 was $1,000, and in 2016 was $1,200, the growth rate of per capita GDP between 2014 and 2016 was:
A) 25 percent.
B) about 11 percent.
C) 20 percent.
D) about 133 percent.
E) about 33 percent.
A) 25 percent.
B) about 11 percent.
C) 20 percent.
D) about 133 percent.
E) about 33 percent.
فتح الحزمة
افتح القفل للوصول البطاقات البالغ عددها 110 في هذه المجموعة.
فتح الحزمة
k this deck
6
If the 130,000-year period since anatomically modern humans made their first appearance were compressed into a single day, economic growth would have begun in the last:
A) three hours.
B) hour.
C) three minutes.
D) half hour.
E) two hours.
A) three hours.
B) hour.
C) three minutes.
D) half hour.
E) two hours.
فتح الحزمة
افتح القفل للوصول البطاقات البالغ عددها 110 في هذه المجموعة.
فتح الحزمة
k this deck
7
Per capita GDP in Japan and the UK is about ________ United States per capita GDP, while in Argentina it is about ________ U.S. per capita GDP, and in Ghana only ________.
A) equal to; one-third; one-tenth
B) one and a quarter; one-half ; one-third
C) three-fourths; one-third; one-fifteenth
D) four-fifths; one-half; one-quarter
E) one-half; one-half; one-quarter
A) equal to; one-third; one-tenth
B) one and a quarter; one-half ; one-third
C) three-fourths; one-third; one-fifteenth
D) four-fifths; one-half; one-quarter
E) one-half; one-half; one-quarter
فتح الحزمة
افتح القفل للوصول البطاقات البالغ عددها 110 في هذه المجموعة.
فتح الحزمة
k this deck
8
English philosopher Thomas Hobbes is notable for observing that life was ________ for thousands of years.
A) nasty, brutish, and short
B) just like the legend of King Arthur
C) great, if you were a king
D) halcyon, fulsome, but short
E) comfortable and prosperous
A) nasty, brutish, and short
B) just like the legend of King Arthur
C) great, if you were a king
D) halcyon, fulsome, but short
E) comfortable and prosperous
فتح الحزمة
افتح القفل للوصول البطاقات البالغ عددها 110 في هذه المجموعة.
فتح الحزمة
k this deck
9
Until about 12,000 years ago, humans were ________; at that point ________ led to the first towns and true economic development.
A) farmers; the Bronze Age
B) hunters and gatherers; the Iron Age
C) hunters and gatherers; agriculture
D) hunters and gatherers; universities
E) farmers; industry
A) farmers; the Bronze Age
B) hunters and gatherers; the Iron Age
C) hunters and gatherers; agriculture
D) hunters and gatherers; universities
E) farmers; industry
فتح الحزمة
افتح القفل للوصول البطاقات البالغ عددها 110 في هذه المجموعة.
فتح الحزمة
k this deck
10
Assuming the current rate of economic growth continues, the average parent of a college student will have a lifetime income ________ that of his or her son or daughter.
A) 10 times
B) half
C) about the same as
D) five times
E) about twice
A) 10 times
B) half
C) about the same as
D) five times
E) about twice
فتح الحزمة
افتح القفل للوصول البطاقات البالغ عددها 110 في هذه المجموعة.
فتح الحزمة
k this deck
11
Economic growth can be useful in describing why Europeans are:
A) better off in 2015 than they were in 1915 and why Europeans are better off than Thais.
B) better off in 2015 than they were in 1915 and why Europeans are worse off than Thais.
C) worse off in 2015 than they were in 1915.
D) worse off than Thais.
E) worse off in 2015 than they were in 1915 and why Europeans are better off than Thais.
فتح الحزمة
افتح القفل للوصول البطاقات البالغ عددها 110 في هذه المجموعة.
فتح الحزمة
k this deck
12
If per capita GDP in 2015 was $1,000 and in 2016 was $1,200, the growth rate of per capita GDP was:
A) 1.2 percent.
B) about 17 percent.
C) 20 percent.
D) 120 percent.
E) Not enough information is given.
A) 1.2 percent.
B) about 17 percent.
C) 20 percent.
D) 120 percent.
E) Not enough information is given.
فتح الحزمة
افتح القفل للوصول البطاقات البالغ عددها 110 في هذه المجموعة.
فتح الحزمة
k this deck
13
Developed countries' average incomes rose from about ________ in 1700 to about ________ today.
A) $1,000; $30,000
B) $2,500; $50,000
C) $500; $70,000
D) $500; $45,000
E) $500; $100,000
A) $1,000; $30,000
B) $2,500; $50,000
C) $500; $70,000
D) $500; $45,000
E) $500; $100,000
فتح الحزمة
افتح القفل للوصول البطاقات البالغ عددها 110 في هذه المجموعة.
فتح الحزمة
k this deck
14
Assuming the current rate of economic growth continues, the average college student will have a lifetime income ________ that of his or her parents.
A) five times
B) 10 times
C) about the same as
D) about twice
E) half
A) five times
B) 10 times
C) about the same as
D) about twice
E) half
فتح الحزمة
افتح القفل للوصول البطاقات البالغ عددها 110 في هذه المجموعة.
فتح الحزمة
k this deck
15
In 2000, average per capita income was about ________, while in 1970, average per capita income was ________.
A) $75,000; one-fifth that amount
B) $25,000; twice that amount
C) $36,000; one-third that amount
D) $45,000; about half that amount
E) $32,000; more or less the same
A) $75,000; one-fifth that amount
B) $25,000; twice that amount
C) $36,000; one-third that amount
D) $45,000; about half that amount
E) $32,000; more or less the same
فتح الحزمة
افتح القفل للوصول البطاقات البالغ عددها 110 في هذه المجموعة.
فتح الحزمة
k this deck
16
The study of economic growth concentrates on understanding the determinants of the:
A) rate of price changes.
B) short-term change in per capita GDP.
C) rate of population growth.
D) change in per capita GDP over time.
E) None of these answers is correct.
A) rate of price changes.
B) short-term change in per capita GDP.
C) rate of population growth.
D) change in per capita GDP over time.
E) None of these answers is correct.
فتح الحزمة
افتح القفل للوصول البطاقات البالغ عددها 110 في هذه المجموعة.
فتح الحزمة
k this deck
17
In 2009 prices, U.S. per capita GDP was about ________ in 1870, and by 2015 it had grown to about ________.
A) $500; $37,000
B) $3,200; $50,800
C) $500; $17,000
D) $10,000; $37,000
E) $100; $100,000
A) $500; $37,000
B) $3,200; $50,800
C) $500; $17,000
D) $10,000; $37,000
E) $100; $100,000
فتح الحزمة
افتح القفل للوصول البطاقات البالغ عددها 110 في هذه المجموعة.
فتح الحزمة
k this deck
18
Economic growth is defined as:
A) the percent change in per capita income, or GDP.
B) the percent change in prices, or GDP.
C) the decline in the unemployment rate.
D) the difference between the nominal and real GDP.
E) changes in technology.
A) the percent change in per capita income, or GDP.
B) the percent change in prices, or GDP.
C) the decline in the unemployment rate.
D) the difference between the nominal and real GDP.
E) changes in technology.
فتح الحزمة
افتح القفل للوصول البطاقات البالغ عددها 110 في هذه المجموعة.
فتح الحزمة
k this deck
19
What country or countries do the following characteristics possibly describe?
• Life expectancy at birth is under 50 years.
• More than 90 percent of households do not have electricity.
• Fewer than 10 percent of young adults have graduated from high school.
A) Kenya
B) the United States in the late 1800s
C) Bangladesh
D) Russia
E) All of these answers are correct.
• Life expectancy at birth is under 50 years.
• More than 90 percent of households do not have electricity.
• Fewer than 10 percent of young adults have graduated from high school.
A) Kenya
B) the United States in the late 1800s
C) Bangladesh
D) Russia
E) All of these answers are correct.
فتح الحزمة
افتح القفل للوصول البطاقات البالغ عددها 110 في هذه المجموعة.
فتح الحزمة
k this deck
20
The birthplace of modern economic growth was in ________ during the ________ century.
A) Japan; mid-twentieth
B) the United States; mid-nineteenth
C) the United Kingdom; mid-eighteenth
D) China; late twentieth
E) Germany; early nineteenth
A) Japan; mid-twentieth
B) the United States; mid-nineteenth
C) the United Kingdom; mid-eighteenth
D) China; late twentieth
E) Germany; early nineteenth
فتح الحزمة
افتح القفل للوصول البطاقات البالغ عددها 110 في هذه المجموعة.
فتح الحزمة
k this deck
21
In the late nineteenth century, ________ was the richest country in the world, but it now lags behind the United States because of ________.
A) China; a lower rate of inflation
B) the United Kingdom; a lower economic growth rate
C) Germany; a higher economic growth rate
D) Japan; consistently being at war
E) China; a higher economic growth rate
A) China; a lower rate of inflation
B) the United Kingdom; a lower economic growth rate
C) Germany; a higher economic growth rate
D) Japan; consistently being at war
E) China; a higher economic growth rate
فتح الحزمة
افتح القفل للوصول البطاقات البالغ عددها 110 في هذه المجموعة.
فتح الحزمة
k this deck
22
According to the rule of 70, if an economy averages a 4 percent growth rate, it will take about ________ years to double in size.
A) 2.8
B) 1,750
C) 0.06
D) 5.7
E) 17.5
A) 2.8
B) 1,750
C) 0.06
D) 5.7
E) 17.5
فتح الحزمة
افتح القفل للوصول البطاقات البالغ عددها 110 في هذه المجموعة.
فتح الحزمة
k this deck
23
Suppose there are L0 people in the world today. If the population growth rate equals , then in 50 years, the world population will be:
A) .
B) .
C) .
D) .
E) .
, then in 50 years, the world population will be:A)
.B)
.C)
.D)
.E)
. فتح الحزمة
افتح القفل للوصول البطاقات البالغ عددها 110 في هذه المجموعة.
فتح الحزمة
k this deck
24
The president of the World Bank has asked you to calculate the average population growth rate of Hungary from 1970 to 2010. You know the population was about 10.4 million in 1970 and about 9.5 million in 2010. The average growth rate is about ________ percent.
A) 0.2
B) -0.2
C) 98.4
D) 2.7
E) -200
A) 0.2
B) -0.2
C) 98.4
D) 2.7
E) -200
فتح الحزمة
افتح القفل للوصول البطاقات البالغ عددها 110 في هذه المجموعة.
فتح الحزمة
k this deck
25
The president of the World Bank has asked you to calculate the average per capita GDP growth rate of Rwanda from 1980 to 2010. In 1980, per capita GDP was about $728 and in 2010 was about $1,025. You tell him the average growth rate of per capita GDP is about ________ percent.
A) 1.1
B) -1.1
C) 0.0
D) -2.3
E) 20.2
A) 1.1
B) -1.1
C) 0.0
D) -2.3
E) 20.2
فتح الحزمة
افتح القفل للوصول البطاقات البالغ عددها 110 في هذه المجموعة.
فتح الحزمة
k this deck
26
If the population of Romania was about 22 million in 2010 and the average population growth rate is 0.2 percent, then Romania's "initial" population was about ________ million in 1970.
A) 23.9
B) 18.9
C) 20.3
D) 22.0
E) 23.8
A) 23.9
B) 18.9
C) 20.3
D) 22.0
E) 23.8
فتح الحزمة
افتح القفل للوصول البطاقات البالغ عددها 110 في هذه المجموعة.
فتح الحزمة
k this deck
27
Suppose population growth is given by , where L0 is the population today,
Is the population in t periods, and
Is the population constant growth rate. If we do not know what value
Takes but do know the values of L0,
, and t, we can calculate
By punching ________ into our calculators.
A)
B)
C)
D)
E)
, where L0 is the population today, Is the population in t periods, and
Is the population constant growth rate. If we do not know what value
Takes but do know the values of L0,
, and t, we can calculate
By punching ________ into our calculators.
A)
B)
C)
D)
E)
فتح الحزمة
افتح القفل للوصول البطاقات البالغ عددها 110 في هذه المجموعة.
فتح الحزمة
k this deck
28
According to the constant growth rate rule, if a variable starts at some initial value y0 at t = 0 and grows at at a constant rate
Then the value of the variable in three periods is given by:
A) .
B) .
C) .
D) .
E) .
at a constant rate Then the value of the variable in three periods is given by:
A)
.B)
.C)
.D)
.E)
. فتح الحزمة
افتح القفل للوصول البطاقات البالغ عددها 110 في هذه المجموعة.
فتح الحزمة
k this deck
29
Over the past 50 years, Brazil's population growth rate has averaged about 2.3 percent. According to the rule of 70, Brazil's population will double in about ________ years.
A) 3
B) 30
C) 33
D) 161
E) 1.6
A) 3
B) 30
C) 33
D) 161
E) 1.6
فتح الحزمة
افتح القفل للوصول البطاقات البالغ عددها 110 في هذه المجموعة.
فتح الحزمة
k this deck
30
Between 1970 and 1976, Israel's average inflation rate was about 65 percent per year. With that rate of inflation, prices would double about every ________ years, using the rule of 70.
A) 93
B) 107.7
C) 0.95
D) 1.1
E) 9.3
A) 93
B) 107.7
C) 0.95
D) 1.1
E) 9.3
فتح الحزمة
افتح القفل للوصول البطاقات البالغ عددها 110 في هذه المجموعة.
فتح الحزمة
k this deck
31
The rule of 70 states that if yt grows at a rate of g percent per year, then the number of years it takes yt to:
A) double is approximately equal to 70/g.
B) double is exactly equal to 70/g.
C) double is approximately equal to g/70.
D) triple is approximately equal to 70/g.
E) double is approximately equal to 70/(1 +g).
A) double is approximately equal to 70/g.
B) double is exactly equal to 70/g.
C) double is approximately equal to g/70.
D) triple is approximately equal to 70/g.
E) double is approximately equal to 70/(1 +g).
فتح الحزمة
افتح القفل للوصول البطاقات البالغ عددها 110 في هذه المجموعة.
فتح الحزمة
k this deck
32
If instead of labeling the vertical axis in the usual "1, 2, 3, 4, . . ." fashion we label it as "1, 2, 4, 8, . . ." so that equal intervals represent a doubling; we call this the ________ scale.
A) quadratic
B) logarithmic
C) exponential
D) ratio
E) geometric
A) quadratic
B) logarithmic
C) exponential
D) ratio
E) geometric
فتح الحزمة
افتح القفل للوصول البطاقات البالغ عددها 110 في هذه المجموعة.
فتح الحزمة
k this deck
33
Suppose that in 1955 Japan had an initial per capita GDP of $15,000 per year and China had a per capita GDP of $2,500. But China is growing at 7 percent per year and Japan is growing at 2 percent per year. In 2015, ________ would have been the lower-income country, with a per capita GDP of approximately ________.
A) China; $2,500
B) Japan; $15,000
C) China; $50,000
D) Japan; $46,000
E) Japan; $105,000
A) China; $2,500
B) Japan; $15,000
C) China; $50,000
D) Japan; $46,000
E) Japan; $105,000
فتح الحزمة
افتح القفل للوصول البطاقات البالغ عددها 110 في هذه المجموعة.
فتح الحزمة
k this deck
34
The president of the World Bank has asked you to calculate the average population growth rate of Nigeria from 1960 to 2010. You know the population in 1960 was about 42 million and in 2010 was about 152 million. The average growth rate is about ________ percent.
A) 16.4
B) 0.9
C) 0.0
D) -4.1
E) 2.6
A) 16.4
B) 0.9
C) 0.0
D) -4.1
E) 2.6
فتح الحزمة
افتح القفل للوصول البطاقات البالغ عددها 110 في هذه المجموعة.
فتح الحزمة
k this deck
35
If the population of Romania was about 20.3 million in 1970 and the average population growth rate is 0.2 percent, then Romania's population would have been about ________ million in 2010.
A) 20.3
B) 22.0
C) 40.6
D) 17.4
E) 23.6
A) 20.3
B) 22.0
C) 40.6
D) 17.4
E) 23.6
فتح الحزمة
افتح القفل للوصول البطاقات البالغ عددها 110 في هذه المجموعة.
فتح الحزمة
k this deck
36
The president of the World Bank is on his way to a meeting with the president of Uruguay. He bumps into you in the hallway and wants to know how long it will take for Uruguayan per capita GDP to double. All he knows is that the average growth rate has been about 1 percent. You quickly tell him it will take about ________ years because you know ________.
A) 60; the rule of 60
B) 7; the rule of 70
C) 700; percent change
D) 70; the rule of 70
E) 1; exponential growth
A) 60; the rule of 60
B) 7; the rule of 70
C) 700; percent change
D) 70; the rule of 70
E) 1; exponential growth
فتح الحزمة
افتح القفل للوصول البطاقات البالغ عددها 110 في هذه المجموعة.
فتح الحزمة
k this deck
37
Suppose that in 1965 Japan had an initial per capita GDP of $12,000 per year and China had a per capita GDP of $5,000. But China is growing at 5 percent per year and Japan is growing at 3 percent per year. ________ would have been richer in 2015 with a per capita GDP of approximately ________.
A) Japan; $5,000
B) Japan; $31,500
C) China; $7,500
D) China; $60,023
E) Not enough information is given.
A) Japan; $5,000
B) Japan; $31,500
C) China; $7,500
D) China; $60,023
E) Not enough information is given.
فتح الحزمة
افتح القفل للوصول البطاقات البالغ عددها 110 في هذه المجموعة.
فتح الحزمة
k this deck
38
If we compress the vertical axis at "key doubling points," we call this the ________ scale.
A) logarithmic
B) ratio
C) exponential
D) quadratic
E) geometric
A) logarithmic
B) ratio
C) exponential
D) quadratic
E) geometric
فتح الحزمة
افتح القفل للوصول البطاقات البالغ عددها 110 في هذه المجموعة.
فتح الحزمة
k this deck
39
Since approximately 1980, ________ has been one of the fastest growing economies.
A) Germany
B) the United Kingdom
C) China
D) the United States
E) Mexico
A) Germany
B) the United Kingdom
C) China
D) the United States
E) Mexico
فتح الحزمة
افتح القفل للوصول البطاقات البالغ عددها 110 في هذه المجموعة.
فتح الحزمة
k this deck
40
The compression of the vertical axis at "key doubling points" is called the ________ scale.
A) quadratic
B) logarithmic
C) exponential
D) ratio
E) geometric
A) quadratic
B) logarithmic
C) exponential
D) ratio
E) geometric
فتح الحزمة
افتح القفل للوصول البطاقات البالغ عددها 110 في هذه المجموعة.
فتح الحزمة
k this deck
41
Suppose k, l, and A grow at constant rates given by and
What is the growth rate of y if
A)
B)
C)
D)
E)
and What is the growth rate of y if
A)
B)
C)
D)
E)
فتح الحزمة
افتح القفل للوصول البطاقات البالغ عددها 110 في هذه المجموعة.
فتح الحزمة
k this deck
42
If France's per capita GDP is $5,000 in 1950 and Portugal's is $2,500, but Portugal is growing faster, the expectation that sometime in the future Portugal's per capita GDP will equal that of France is called economic:
A) growth.
B) divergence.
C) convergence.
D) dynamics.
E) justice.
A) growth.
B) divergence.
C) convergence.
D) dynamics.
E) justice.
فتح الحزمة
افتح القفل للوصول البطاقات البالغ عددها 110 في هذه المجموعة.
فتح الحزمة
k this deck
43
Over the past two decades, China's per capita GDP grew an average of about ________ percent.
A) 8
B) 10
C) 5
D) 4
E) 2
A) 8
B) 10
C) 5
D) 4
E) 2
فتح الحزمة
افتح القفل للوصول البطاقات البالغ عددها 110 في هذه المجموعة.
فتح الحزمة
k this deck
44
Suppose k, l, and m grow at constant rates given by
And
What is the growth rate of y if
A)
B)
C)
D)
E)
And
What is the growth rate of y if
A)
B)
C)
D)
E)
فتح الحزمة
افتح القفل للوصول البطاقات البالغ عددها 110 في هذه المجموعة.
فتح الحزمة
k this deck
45
Between 1960 and 2014, which of the following countries was among the fastest growing?
A) Niger
B) Nicaragua
C) Madagascar
D) Venezuela
E) None of these answers is correct.
A) Niger
B) Nicaragua
C) Madagascar
D) Venezuela
E) None of these answers is correct.
فتح الحزمة
افتح القفل للوصول البطاقات البالغ عددها 110 في هذه المجموعة.
فتح الحزمة
k this deck
46
Between 1986 and 2014, India's per capita GDP growth rate averaged about ________ percent, which was slower than in China. As a result, by 2014 China's per capita GDP was about ________ of the U.S. level, whereas in India it was about ________.
A) 4.4; one-half; one-fifth
B) 8; three-fourths; one-half
C) 5.8; one-fourth; one-tenth
D) 10; one-half; one-fourth
E) 2; one-third; one-fourth
A) 4.4; one-half; one-fifth
B) 8; three-fourths; one-half
C) 5.8; one-fourth; one-tenth
D) 10; one-half; one-fourth
E) 2; one-third; one-fourth
فتح الحزمة
افتح القفل للوصول البطاقات البالغ عددها 110 في هذه المجموعة.
فتح الحزمة
k this deck
47
When a lower-income economy's GDP is able to "catch up" with a higher-income economy's GDP, this behavior is related to an important concept in the study of economic:
A) growth.
B) divergence.
C) convergence.
D) fluctuations.
E) asset markets.
A) growth.
B) divergence.
C) convergence.
D) fluctuations.
E) asset markets.
فتح الحزمة
افتح القفل للوصول البطاقات البالغ عددها 110 في هذه المجموعة.
فتح الحزمة
k this deck
48
Suppose k, l, and A grow at constant rates given by
And
What is the growth rate of y if
A)
B)
C)
D)
E)
And
What is the growth rate of y if
A)
B)
C)
D)
E)
فتح الحزمة
افتح القفل للوصول البطاقات البالغ عددها 110 في هذه المجموعة.
فتح الحزمة
k this deck
49
In 1960, approximately ________ of the world's population lived on less than $7 per day; by 2004, it ________ to ________ of the population.
A) 10 percent; rose; over one-third
B) 10 percent; rose; over two-thirds
C) two-thirds; fell; less than 10 percent
D) one-third; fell; less than 1 percent
E) one-third; rose; over two-thirds
A) 10 percent; rose; over one-third
B) 10 percent; rose; over two-thirds
C) two-thirds; fell; less than 10 percent
D) one-third; fell; less than 1 percent
E) one-third; rose; over two-thirds
فتح الحزمة
افتح القفل للوصول البطاقات البالغ عددها 110 في هذه المجموعة.
فتح الحزمة
k this deck
50
Between 1960 and 2014, the fraction of the world's population that lived on $7 a day or less ________. This can be attributed to, in large part, ________.
A) fell; a shrinking global population
B) stayed about the same; global warming
C) fell; economic growth in China and India
D) rose; rising oil prices
E) rose; the financial crisis
A) fell; a shrinking global population
B) stayed about the same; global warming
C) fell; economic growth in China and India
D) rose; rising oil prices
E) rose; the financial crisis
فتح الحزمة
افتح القفل للوصول البطاقات البالغ عددها 110 في هذه المجموعة.
فتح الحزمة
k this deck
51
Of the following countries in 2014, ________ had the highest per capita GDP, and in 1950, ________ had the lowest per capita GDP.
A) Japan; the United Kingdom
B) Luxembourg; China
C) Germany; Germany
D) the United States; Germany
E) the United Kingdom; the United States
A) Japan; the United Kingdom
B) Luxembourg; China
C) Germany; Germany
D) the United States; Germany
E) the United Kingdom; the United States
فتح الحزمة
افتح القفل للوصول البطاقات البالغ عددها 110 في هذه المجموعة.
فتح الحزمة
k this deck
52
Suppose k, l, and m grow at constant rates given by
And
What is the growth rate of
A)
B)
C)
D)
E)
And
What is the growth rate of
A)
B)
C)
D)
E)
فتح الحزمة
افتح القفل للوصول البطاقات البالغ عددها 110 في هذه المجموعة.
فتح الحزمة
k this deck
53
Which of the following had a negative growth rate over the past 50 years?
A) Tanzania
B) Ethiopia
C) Burundi
D) the Democratic Republic of Congo
E) All of these answers are correct.
A) Tanzania
B) Ethiopia
C) Burundi
D) the Democratic Republic of Congo
E) All of these answers are correct.
فتح الحزمة
افتح القفل للوصول البطاقات البالغ عددها 110 في هذه المجموعة.
فتح الحزمة
k this deck
54
In 1960, approximately ________ of the world's population lived on less than $7 per day, and the rate has ________ steadily since.
A) 10 percent; fallen
B) two-thirds; fallen
C) 10 percent; risen
D) one-third; fallen
E) two-thirds; risen
A) 10 percent; fallen
B) two-thirds; fallen
C) 10 percent; risen
D) one-third; fallen
E) two-thirds; risen
فتح الحزمة
افتح القفل للوصول البطاقات البالغ عددها 110 في هذه المجموعة.
فتح الحزمة
k this deck
55
Suppose k, l, and A grow at constant rates given by
And
) What is the growth rate of y if
A)
B)
C)
D)
E)
And
) What is the growth rate of y if
A)
B)
C)
D)
E)
فتح الحزمة
افتح القفل للوصول البطاقات البالغ عددها 110 في هذه المجموعة.
فتح الحزمة
k this deck
56
Between 1960 and 2014, which of the following countries was among the slowest growing?
A) South Korea
B) Ireland
C) Thailand
D) Hong Kong
E) Uganda
A) South Korea
B) Ireland
C) Thailand
D) Hong Kong
E) Uganda
فتح الحزمة
افتح القفل للوصول البطاقات البالغ عددها 110 في هذه المجموعة.
فتح الحزمة
k this deck
57
In 2014, which of the following had a per capita GDP higher than the United States?
A) the United Kingdom
B) Germany
C) Singapore
D) Japan
E) Greece
A) the United Kingdom
B) Germany
C) Singapore
D) Japan
E) Greece
فتح الحزمة
افتح القفل للوصول البطاقات البالغ عددها 110 في هذه المجموعة.
فتح الحزمة
k this deck
58
Suppose k and l grow at constant rates given by and
What is the growth rate of y if
A)
B)
C)
D)
E)
and What is the growth rate of y if
A)
B)
C)
D)
E)
فتح الحزمة
افتح القفل للوصول البطاقات البالغ عددها 110 في هذه المجموعة.
فتح الحزمة
k this deck
59
In 2014, approximately ________ of the world's population lived on $7 a day or less.
A) one-twelfth
B) two-thirds
C) 10 percent
D) one-third
E) 12 percent
A) one-twelfth
B) two-thirds
C) 10 percent
D) one-third
E) 12 percent
فتح الحزمة
افتح القفل للوصول البطاقات البالغ عددها 110 في هذه المجموعة.
فتح الحزمة
k this deck
60
Suppose K and L grow at constant rates given by and
What is the growth rate of y if
A)
B)
C)
D)
E)
and What is the growth rate of y if
A)
B)
C)
D)
E)
فتح الحزمة
افتح القفل للوصول البطاقات البالغ عددها 110 في هذه المجموعة.
فتح الحزمة
k this deck
61
The "birthplace" of modern economic growth was the mid-nineteenth-century United States.
فتح الحزمة
افتح القفل للوصول البطاقات البالغ عددها 110 في هذه المجموعة.
فتح الحزمة
k this deck
62
Assume that Mexico's average annual per capita GDP growth rate is 3 percent per year, while Argentina's is 2.5 percent. Next, assume that both countries began with an initial per capita GDP of $1,000 in 1965. By 2015, per capita GDP would have been ________ in Mexico and ________ in Argentina.
A) $228; $291
B) $3,437; $4,384
C) $4,515; $3,523
D) $4,384; $3,437
E) Not enough information is given.
A) $228; $291
B) $3,437; $4,384
C) $4,515; $3,523
D) $4,384; $3,437
E) Not enough information is given.
فتح الحزمة
افتح القفل للوصول البطاقات البالغ عددها 110 في هذه المجموعة.
فتح الحزمة
k this deck
63
Suppose k grows at a rate of percent and l grows at a rate of
Percent. If
Then y grows at ________ percent.
A) 3
B) 4
C) -3
D) 12
E) -4
percent and l grows at a rate of Percent. If
Then y grows at ________ percent.
A) 3
B) 4
C) -3
D) 12
E) -4
فتح الحزمة
افتح القفل للوصول البطاقات البالغ عددها 110 في هذه المجموعة.
فتح الحزمة
k this deck
64
Suppose k grows at a rate of percent and l grows at a rate of
Percent. If
Then y grows at ________ percent.
A) 6
B) 5
C) 7
D) -6
E) 12
percent and l grows at a rate of Percent. If
Then y grows at ________ percent.
A) 6
B) 5
C) 7
D) -6
E) 12
فتح الحزمة
افتح القفل للوصول البطاقات البالغ عددها 110 في هذه المجموعة.
فتح الحزمة
k this deck
65
Assume that both Japan's and the United States' average annual per capita GDP growth rates are 2 percent per year, and both countries began with an initial per capita GDP of $1,000. However, the United States has been growing since 1915 and Japan only since 1965. In 2015, the United States would have been ________ than Japan.
A) 0.37 times poorer
B) 99 times richer
C) 2.69 times richer
D) 4,555 times richer
E) 0.269 times poorer
A) 0.37 times poorer
B) 99 times richer
C) 2.69 times richer
D) 4,555 times richer
E) 0.269 times poorer
فتح الحزمة
افتح القفل للوصول البطاقات البالغ عددها 110 في هذه المجموعة.
فتح الحزمة
k this deck
66
Economic growth is defined as the percent change in per capita income or GDP.
فتح الحزمة
افتح القفل للوصول البطاقات البالغ عددها 110 في هذه المجموعة.
فتح الحزمة
k this deck
67
Suppose x grows at a rate of percent and y grows at a rate of
Percent. If z = y * x, then z grows at ________ percent; if z = x/y, z grows at ________ percent.
A) 7; -17
B) -17; 7
C) 17; -7
D) 60; 42
E) 60; -42
percent and y grows at a rate of Percent. If z = y * x, then z grows at ________ percent; if z = x/y, z grows at ________ percent.
A) 7; -17
B) -17; 7
C) 17; -7
D) 60; 42
E) 60; -42
فتح الحزمة
افتح القفل للوصول البطاقات البالغ عددها 110 في هذه المجموعة.
فتح الحزمة
k this deck
68
Suppose x grows at a rate of percent and y grows at a rate of
Percent. If z = x * y, then z grows at ________ percent; if z =x/y, z grows at ________ percent.
A) 0; 6
B) 6; 0
C) 6; 12
D) -6; 6
E) 1; 0
percent and y grows at a rate of Percent. If z = x * y, then z grows at ________ percent; if z =x/y, z grows at ________ percent.
A) 0; 6
B) 6; 0
C) 6; 12
D) -6; 6
E) 1; 0
فتح الحزمة
افتح القفل للوصول البطاقات البالغ عددها 110 في هذه المجموعة.
فتح الحزمة
k this deck
69
Suppose k grows at a rate of percent and l grows at a rate of
Percent. If
Then y grows at ________ percent.
A) -6
B) 5
C) 6
D) -10
E) 12
percent and l grows at a rate of Percent. If
Then y grows at ________ percent.
A) -6
B) 5
C) 6
D) -10
E) 12
فتح الحزمة
افتح القفل للوصول البطاقات البالغ عددها 110 في هذه المجموعة.
فتح الحزمة
k this deck
70
Which of the following is/are the benefit(s) of economic growth?
A) an expansion in the range of goods and services available
B) shorter expected life spans
C) more pollution
D) lower government deficits
E) lower productivity
A) an expansion in the range of goods and services available
B) shorter expected life spans
C) more pollution
D) lower government deficits
E) lower productivity
فتح الحزمة
افتح القفل للوصول البطاقات البالغ عددها 110 في هذه المجموعة.
فتح الحزمة
k this deck
71
Assume that both Mexico's and Argentina's average annual per capita GDP growth rates are 3 percent per year, and both countries began with an initial per capita GDP of $1,000. However, Argentina has been growing since 1940 and Mexico only since 1965. In 2015, Mexico's per capita GDP would have been about ________, while Argentina's would have been about ________.
A) $19.42; $12.94
B) $9,179; $4,384
C) $51,500; $77,250
D) $48,544; $72,816
E) $4,384; $9,179
A) $19.42; $12.94
B) $9,179; $4,384
C) $51,500; $77,250
D) $48,544; $72,816
E) $4,384; $9,179
فتح الحزمة
افتح القفل للوصول البطاقات البالغ عددها 110 في هذه المجموعة.
فتح الحزمة
k this deck
72
The relationship between pollution and per capita GDP is documented as:
A) U-shaped.
B) an inverse U.
C) positively related.
D) Nonexistent.
E) negatively related.
A) U-shaped.
B) an inverse U.
C) positively related.
D) Nonexistent.
E) negatively related.
فتح الحزمة
افتح القفل للوصول البطاقات البالغ عددها 110 في هذه المجموعة.
فتح الحزمة
k this deck
73
Despite the costs associated with economic growth, most believe:
A) they will only get higher.
B) there are not too many benefits.
C) they are higher than the benefits.
D) the benefits far outweigh the costs.
E) the benefits are negative.
A) they will only get higher.
B) there are not too many benefits.
C) they are higher than the benefits.
D) the benefits far outweigh the costs.
E) the benefits are negative.
فتح الحزمة
افتح القفل للوصول البطاقات البالغ عددها 110 في هذه المجموعة.
فتح الحزمة
k this deck
74
The costs of economic growth include which of the following?
A) pollution and the depletion of natural resources
B) global warming
C) increased income inequality
D) technological advances, which may lead to the loss of specific jobs and industries
E) All of these answers are correct.
A) pollution and the depletion of natural resources
B) global warming
C) increased income inequality
D) technological advances, which may lead to the loss of specific jobs and industries
E) All of these answers are correct.
فتح الحزمة
افتح القفل للوصول البطاقات البالغ عددها 110 في هذه المجموعة.
فتح الحزمة
k this deck
75
In dynamic economies, it is true that economic growth may contribute to ________, but it also leads to ________.
A) unemployment; inflation
B) job creation; job destruction
C) job destruction; job creation
D) crime; unemployment
E) pollution; price instability
A) unemployment; inflation
B) job creation; job destruction
C) job destruction; job creation
D) crime; unemployment
E) pollution; price instability
فتح الحزمة
افتح القفل للوصول البطاقات البالغ عددها 110 في هذه المجموعة.
فتح الحزمة
k this deck
76
Suppose k grows at a rate of percent and l grows at a rate of
Percent. If
Then y grows at ________ percent.
A) 5
B) 15
C) 9
D) 4
E) 3
percent and l grows at a rate of Percent. If
Then y grows at ________ percent.
A) 5
B) 15
C) 9
D) 4
E) 3
فتح الحزمة
افتح القفل للوصول البطاقات البالغ عددها 110 في هذه المجموعة.
فتح الحزمة
k this deck
77
Which of the following is/are the benefit(s) of economic growth?
A) increases in life expectancy
B) reductions in infant mortality
C) higher incomes
D) an expansion in the range of goods and services available
E) All of these answers are correct.
A) increases in life expectancy
B) reductions in infant mortality
C) higher incomes
D) an expansion in the range of goods and services available
E) All of these answers are correct.
فتح الحزمة
افتح القفل للوصول البطاقات البالغ عددها 110 في هذه المجموعة.
فتح الحزمة
k this deck
78
According to historical data, wages in ancient Greece and Rome were about the same as wages in fifteenth-century Britain.
فتح الحزمة
افتح القفل للوصول البطاقات البالغ عددها 110 في هذه المجموعة.
فتح الحزمة
k this deck
79
The costs of economic growth include which of the following?
A) pollution and the depletion of natural resources
B) global cooling
C) the gradual release of individuals from physical labor
D) increased productivity
E) longer life spans
A) pollution and the depletion of natural resources
B) global cooling
C) the gradual release of individuals from physical labor
D) increased productivity
E) longer life spans
فتح الحزمة
افتح القفل للوصول البطاقات البالغ عددها 110 في هذه المجموعة.
فتح الحزمة
k this deck
80
If the 130,000-year period since anatomically modern humans made their first appearance were compressed into a single day, economic growth would have begun in the last three minutes.
فتح الحزمة
افتح القفل للوصول البطاقات البالغ عددها 110 في هذه المجموعة.
فتح الحزمة
k this deck
فتح الحزمة
افتح القفل للوصول البطاقات البالغ عددها 110 في هذه المجموعة.


