Deck 16: Supplement Operational Decision-Making Tools: Transportation and Transshipment Models
ملء الشاشة (f)
سؤال
سؤال
Use this problem for the next four (4)questions.
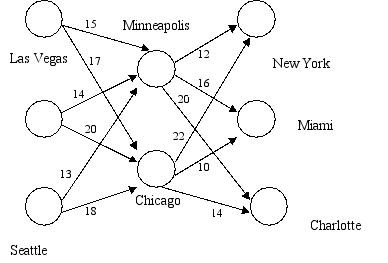
A company has manufacturing plants in Las Vegas,Portland,and Seattle.Items produced from these plants are boxed and shipped to warehouses in Minneapolis and Chicago where they are tested and repackaged for distribution to final customers in New York,Miami,and Charlotte.The network of transshipment routes shown below indicates the cost associated with shipping a box from the plants to the warehouses and then the cost of shipping the repackaged unit from the warehouses to the final customers.
 Assume that the supply and demand requirements are as shown in the table below.
 The company would like to determine the lowest cost shipping and distribution plan.
The following solution was produced using Microsoft Excel.
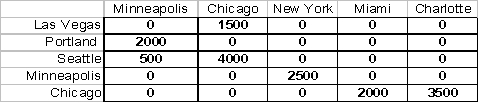
How many units are shipped through the Minneapolis transshipment point?
A)500
B)1500
C)2500
D)3500
A company has manufacturing plants in Las Vegas,Portland,and Seattle.Items produced from these plants are boxed and shipped to warehouses in Minneapolis and Chicago where they are tested and repackaged for distribution to final customers in New York,Miami,and Charlotte.The network of transshipment routes shown below indicates the cost associated with shipping a box from the plants to the warehouses and then the cost of shipping the repackaged unit from the warehouses to the final customers.
Assume that the supply and demand requirements are as shown in the table below. The company would like to determine the lowest cost shipping and distribution plan.The following solution was produced using Microsoft Excel.
How many units are shipped through the Minneapolis transshipment point?
A)500
B)1500
C)2500
D)3500
سؤال
سؤال
سؤال
سؤال
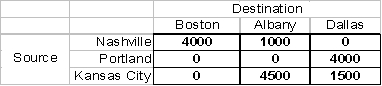
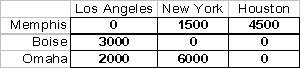
The following transportation table shows the cost of shipping one unit from each source to each destination in the upper right hand corner of each cell,as well as the supply capacities and demand requirements:  The optimal solution is:
 The total cost of the shipping plan is:
A)$15,000
B)$18,500
C)$35,500
D)$43,500
The optimal solution is: The total cost of the shipping plan is:A)$15,000
B)$18,500
C)$35,500
D)$43,500
سؤال
سؤال
سؤال
سؤال
سؤال
The following transportation table shows the cost of shipping one unit from each source to each destination in the upper right hand corner of each cell,as well as the supply capacities and demand requirements:  The optimal solution is:
 The total amount shipped from Portland to Dallas is:
A)4,500
B)1,000
C)4,000
D)1,500
The optimal solution is: The total amount shipped from Portland to Dallas is:A)4,500
B)1,000
C)4,000
D)1,500
سؤال
The following transportation table shows the cost of shipping one unit from each source to each destination in the upper right hand corner of each cell,as well as the supply capacities and demand requirements: 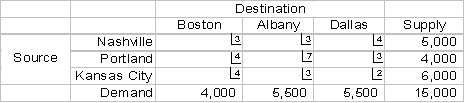 The optimal solution is:
 How many units of Albany demand are supplied from Nashville?
A)4,500
B)4,000
C)1,500
D)1,000
The optimal solution is: How many units of Albany demand are supplied from Nashville?A)4,500
B)4,000
C)1,500
D)1,000
سؤال
The following transportation table shows the cost of shipping one unit from each source to each destination in the upper right hand corner of each cell,as well as the supply capacities and demand requirements:  The optimal solution is:
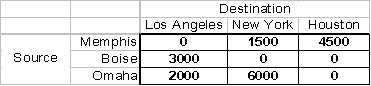 How many units of New York demand are supplied from Omaha?
A)5
B)10
C)1,500
D)6,000
The optimal solution is: How many units of New York demand are supplied from Omaha?A)5
B)10
C)1,500
D)6,000
سؤال
The following transportation table shows the cost of shipping one unit from each source to each destination in the upper right hand corner of each cell,as well as the supply capacities and demand requirements: 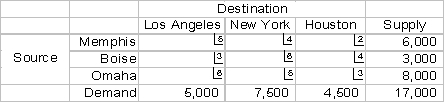 The optimal solution is:
 The total cost of the shipping plan is:
A)$17,000
B)$25,000
C)$50,000
D)$66,000
The optimal solution is: The total cost of the shipping plan is:A)$17,000
B)$25,000
C)$50,000
D)$66,000
سؤال
سؤال
The following transportation table shows the cost of shipping one unit from each source to each destination in the upper right hand corner of each cell,as well as the supply capacities and demand requirements:  The optimal solution is:
 The total amount shipped from Boise to Los Angeles is:
A)3
B)6
C)3,000
D)5,000
The optimal solution is: The total amount shipped from Boise to Los Angeles is:A)3
B)6
C)3,000
D)5,000
سؤال
سؤال
سؤال
سؤال
سؤال
سؤال
سؤال
Use this problem for the next four (4)questions.
Anderson Corporation manufactures a product at three different facilities located at Boston,Philadelphia and Atlanta and ships them to warehouses at Chicago,New York,and Dallas.The Boston and Atlanta plants can also ship these products to Philadelphia.The cost to ship one product between facilities,along with the monthly capacities and requirements are shown in the table below.The company would like a plan to minimize total transportation costs.
 Excel provides the following optimal solution:

Which facility is not producing at capacity?
A)Boston
B)Philadelphia
C)Atlanta
D)New York
Anderson Corporation manufactures a product at three different facilities located at Boston,Philadelphia and Atlanta and ships them to warehouses at Chicago,New York,and Dallas.The Boston and Atlanta plants can also ship these products to Philadelphia.The cost to ship one product between facilities,along with the monthly capacities and requirements are shown in the table below.The company would like a plan to minimize total transportation costs.
Excel provides the following optimal solution:Which facility is not producing at capacity?
A)Boston
B)Philadelphia
C)Atlanta
D)New York
سؤال
Use this problem for the next four (4)questions.
A company has manufacturing plants in Las Vegas,Portland,and Seattle.Items produced from these plants are boxed and shipped to warehouses in Minneapolis and Chicago where they are tested and repackaged for distribution to final customers in New York,Miami,and Charlotte.The network of transshipment routes shown below indicates the cost associated with shipping a box from the plants to the warehouses and then the cost of shipping the repackaged unit from the warehouses to the final customers.
Assume that the supply and demand requirements are as shown in the table below.
The company would like to determine the lowest cost shipping and distribution plan.
The following solution was produced using Microsoft Excel.
How many boxes are shipped from Seattle?
A)4500
B)4000
C)1500
D)500
A company has manufacturing plants in Las Vegas,Portland,and Seattle.Items produced from these plants are boxed and shipped to warehouses in Minneapolis and Chicago where they are tested and repackaged for distribution to final customers in New York,Miami,and Charlotte.The network of transshipment routes shown below indicates the cost associated with shipping a box from the plants to the warehouses and then the cost of shipping the repackaged unit from the warehouses to the final customers.
Assume that the supply and demand requirements are as shown in the table below. The company would like to determine the lowest cost shipping and distribution plan.The following solution was produced using Microsoft Excel.
How many boxes are shipped from Seattle?
A)4500
B)4000
C)1500
D)500
سؤال
سؤال
سؤال
سؤال
Use this problem for the next four (4)questions.
A company has manufacturing plants in Las Vegas,Portland,and Seattle.Items produced from these plants are boxed and shipped to warehouses in Minneapolis and Chicago where they are tested and repackaged for distribution to final customers in New York,Miami,and Charlotte.The network of transshipment routes shown below indicates the cost associated with shipping a box from the plants to the warehouses and then the cost of shipping the repackaged unit from the warehouses to the final customers.
Assume that the supply and demand requirements are as shown in the table below.
The company would like to determine the lowest cost shipping and distribution plan.
The following solution was produced using Microsoft Excel.
How many boxes are sent from Seattle to the Chicago transshipment point?
A)500
B)1500
C)2500
D)4000
A company has manufacturing plants in Las Vegas,Portland,and Seattle.Items produced from these plants are boxed and shipped to warehouses in Minneapolis and Chicago where they are tested and repackaged for distribution to final customers in New York,Miami,and Charlotte.The network of transshipment routes shown below indicates the cost associated with shipping a box from the plants to the warehouses and then the cost of shipping the repackaged unit from the warehouses to the final customers.
Assume that the supply and demand requirements are as shown in the table below. The company would like to determine the lowest cost shipping and distribution plan.The following solution was produced using Microsoft Excel.
How many boxes are sent from Seattle to the Chicago transshipment point?
A)500
B)1500
C)2500
D)4000

فتح الحزمة
قم بالتسجيل لفتح البطاقات في هذه المجموعة!
Unlock Deck
Unlock Deck
1/28
العب
ملء الشاشة (f)
Deck 16: Supplement Operational Decision-Making Tools: Transportation and Transshipment Models
1
If a route is prohibited,units can be transported from a particular source to a particular destination.
False
2
Use this problem for the next four (4)questions.
A company has manufacturing plants in Las Vegas,Portland,and Seattle.Items produced from these plants are boxed and shipped to warehouses in Minneapolis and Chicago where they are tested and repackaged for distribution to final customers in New York,Miami,and Charlotte.The network of transshipment routes shown below indicates the cost associated with shipping a box from the plants to the warehouses and then the cost of shipping the repackaged unit from the warehouses to the final customers.
Assume that the supply and demand requirements are as shown in the table below.
The company would like to determine the lowest cost shipping and distribution plan.
The following solution was produced using Microsoft Excel.
How many units are shipped through the Minneapolis transshipment point?
A)500
B)1500
C)2500
D)3500
A company has manufacturing plants in Las Vegas,Portland,and Seattle.Items produced from these plants are boxed and shipped to warehouses in Minneapolis and Chicago where they are tested and repackaged for distribution to final customers in New York,Miami,and Charlotte.The network of transshipment routes shown below indicates the cost associated with shipping a box from the plants to the warehouses and then the cost of shipping the repackaged unit from the warehouses to the final customers.
Assume that the supply and demand requirements are as shown in the table below. The company would like to determine the lowest cost shipping and distribution plan.The following solution was produced using Microsoft Excel.
How many units are shipped through the Minneapolis transshipment point?
A)500
B)1500
C)2500
D)3500
C
3
In a transportation model the total supply and total demand must be equal.
False
4
Each cell in a transportation table represents the amount transported from one source to all destinations.
فتح الحزمة
افتح القفل للوصول البطاقات البالغ عددها 28 في هذه المجموعة.
فتح الحزمة
k this deck
5
The stepping-stone method is a quantitative technique that can be used to solve transportation models quantitatively.
فتح الحزمة
افتح القفل للوصول البطاقات البالغ عددها 28 في هذه المجموعة.
فتح الحزمة
k this deck
6
The following transportation table shows the cost of shipping one unit from each source to each destination in the upper right hand corner of each cell,as well as the supply capacities and demand requirements: The optimal solution is:
The total cost of the shipping plan is:
A)$15,000
B)$18,500
C)$35,500
D)$43,500
The optimal solution is: The total cost of the shipping plan is:A)$15,000
B)$18,500
C)$35,500
D)$43,500
فتح الحزمة
افتح القفل للوصول البطاقات البالغ عددها 28 في هذه المجموعة.
فتح الحزمة
k this deck
7
In a transportation model each source is able to supply a fixed number of units of the product and each destination has a fixed demand for the product.
فتح الحزمة
افتح القفل للوصول البطاقات البالغ عددها 28 في هذه المجموعة.
فتح الحزمة
k this deck
8
Having more than one shipping distribution but with the same total cost is known as:
A)a prohibited solution
B)an unequal solution
C)an alternative optimal solution
D)a transshipment solution
A)a prohibited solution
B)an unequal solution
C)an alternative optimal solution
D)a transshipment solution
فتح الحزمة
افتح القفل للوصول البطاقات البالغ عددها 28 في هذه المجموعة.
فتح الحزمة
k this deck
9
Two quantitative techniques that are used for determining the least cost means of transporting goods and services are the transportation method and the queuing method.
فتح الحزمة
افتح القفل للوصول البطاقات البالغ عددها 28 في هذه المجموعة.
فتح الحزمة
k this deck
10
Transportation models can be solved within the context of a transportation table.
فتح الحزمة
افتح القفل للوصول البطاقات البالغ عددها 28 في هذه المجموعة.
فتح الحزمة
k this deck
11
The following transportation table shows the cost of shipping one unit from each source to each destination in the upper right hand corner of each cell,as well as the supply capacities and demand requirements: The optimal solution is:
The total amount shipped from Portland to Dallas is:
A)4,500
B)1,000
C)4,000
D)1,500
The optimal solution is: The total amount shipped from Portland to Dallas is:A)4,500
B)1,000
C)4,000
D)1,500
فتح الحزمة
افتح القفل للوصول البطاقات البالغ عددها 28 في هذه المجموعة.
فتح الحزمة
k this deck
12
The following transportation table shows the cost of shipping one unit from each source to each destination in the upper right hand corner of each cell,as well as the supply capacities and demand requirements: The optimal solution is:
How many units of Albany demand are supplied from Nashville?
A)4,500
B)4,000
C)1,500
D)1,000
The optimal solution is: How many units of Albany demand are supplied from Nashville?A)4,500
B)4,000
C)1,500
D)1,000
فتح الحزمة
افتح القفل للوصول البطاقات البالغ عددها 28 في هذه المجموعة.
فتح الحزمة
k this deck
13
The following transportation table shows the cost of shipping one unit from each source to each destination in the upper right hand corner of each cell,as well as the supply capacities and demand requirements: The optimal solution is:
How many units of New York demand are supplied from Omaha?
A)5
B)10
C)1,500
D)6,000
The optimal solution is: How many units of New York demand are supplied from Omaha?A)5
B)10
C)1,500
D)6,000
فتح الحزمة
افتح القفل للوصول البطاقات البالغ عددها 28 في هذه المجموعة.
فتح الحزمة
k this deck
14
The following transportation table shows the cost of shipping one unit from each source to each destination in the upper right hand corner of each cell,as well as the supply capacities and demand requirements: The optimal solution is:
The total cost of the shipping plan is:
A)$17,000
B)$25,000
C)$50,000
D)$66,000
The optimal solution is: The total cost of the shipping plan is:A)$17,000
B)$25,000
C)$50,000
D)$66,000
فتح الحزمة
افتح القفل للوصول البطاقات البالغ عددها 28 في هذه المجموعة.
فتح الحزمة
k this deck
15
In an unbalanced transportation problem supply and demand are not equal.
فتح الحزمة
افتح القفل للوصول البطاقات البالغ عددها 28 في هذه المجموعة.
فتح الحزمة
k this deck
16
The following transportation table shows the cost of shipping one unit from each source to each destination in the upper right hand corner of each cell,as well as the supply capacities and demand requirements: The optimal solution is:
The total amount shipped from Boise to Los Angeles is:
A)3
B)6
C)3,000
D)5,000
The optimal solution is: The total amount shipped from Boise to Los Angeles is:A)3
B)6
C)3,000
D)5,000
فتح الحزمة
افتح القفل للوصول البطاقات البالغ عددها 28 في هذه المجموعة.
فتح الحزمة
k this deck
17
The transshipment model is an extension of the transportation model in which intermediate transshipment points are added between the sources and destinations.
فتح الحزمة
افتح القفل للوصول البطاقات البالغ عددها 28 في هذه المجموعة.
فتح الحزمة
k this deck
18
One way to incorporate a prohibited route in a transportation problem is to
A)assign a low cost,relative to the other route shipping costs,to the prohibited route
B)assign a high cost,relative to the other route shipping costs,to the prohibited route
C)assign a zero cost to the prohibited route
D)transportation problems with prohibited routes cannot be modeled
A)assign a low cost,relative to the other route shipping costs,to the prohibited route
B)assign a high cost,relative to the other route shipping costs,to the prohibited route
C)assign a zero cost to the prohibited route
D)transportation problems with prohibited routes cannot be modeled
فتح الحزمة
افتح القفل للوصول البطاقات البالغ عددها 28 في هذه المجموعة.
فتح الحزمة
k this deck
19
An important factor in supply chain management is determining the lowest-cost transportation provider from among several alternatives.
فتح الحزمة
افتح القفل للوصول البطاقات البالغ عددها 28 في هذه المجموعة.
فتح الحزمة
k this deck
20
It is not possible to solve transportation models using spreadsheets like Microsoft Excel.
فتح الحزمة
افتح القفل للوصول البطاقات البالغ عددها 28 في هذه المجموعة.
فتح الحزمة
k this deck
21
What is the overall cost of the transshipment plan shown above?
A)$215,000
B)$231,000
C)$286,000
D)$343,000
A)$215,000
B)$231,000
C)$286,000
D)$343,000
فتح الحزمة
افتح القفل للوصول البطاقات البالغ عددها 28 في هذه المجموعة.
فتح الحزمة
k this deck
22
What is the total cost of the optimal solution?
A)$43500
B)$48500
C)$54200
D)$56900
A)$43500
B)$48500
C)$54200
D)$56900
فتح الحزمة
افتح القفل للوصول البطاقات البالغ عددها 28 في هذه المجموعة.
فتح الحزمة
k this deck
23
Use this problem for the next four (4)questions.
Anderson Corporation manufactures a product at three different facilities located at Boston,Philadelphia and Atlanta and ships them to warehouses at Chicago,New York,and Dallas.The Boston and Atlanta plants can also ship these products to Philadelphia.The cost to ship one product between facilities,along with the monthly capacities and requirements are shown in the table below.The company would like a plan to minimize total transportation costs.
Excel provides the following optimal solution:
Which facility is not producing at capacity?
A)Boston
B)Philadelphia
C)Atlanta
D)New York
Anderson Corporation manufactures a product at three different facilities located at Boston,Philadelphia and Atlanta and ships them to warehouses at Chicago,New York,and Dallas.The Boston and Atlanta plants can also ship these products to Philadelphia.The cost to ship one product between facilities,along with the monthly capacities and requirements are shown in the table below.The company would like a plan to minimize total transportation costs.
Excel provides the following optimal solution:Which facility is not producing at capacity?
A)Boston
B)Philadelphia
C)Atlanta
D)New York
فتح الحزمة
افتح القفل للوصول البطاقات البالغ عددها 28 في هذه المجموعة.
فتح الحزمة
k this deck
24
Use this problem for the next four (4)questions.
A company has manufacturing plants in Las Vegas,Portland,and Seattle.Items produced from these plants are boxed and shipped to warehouses in Minneapolis and Chicago where they are tested and repackaged for distribution to final customers in New York,Miami,and Charlotte.The network of transshipment routes shown below indicates the cost associated with shipping a box from the plants to the warehouses and then the cost of shipping the repackaged unit from the warehouses to the final customers.
Assume that the supply and demand requirements are as shown in the table below.
The company would like to determine the lowest cost shipping and distribution plan.
The following solution was produced using Microsoft Excel.
How many boxes are shipped from Seattle?
A)4500
B)4000
C)1500
D)500
A company has manufacturing plants in Las Vegas,Portland,and Seattle.Items produced from these plants are boxed and shipped to warehouses in Minneapolis and Chicago where they are tested and repackaged for distribution to final customers in New York,Miami,and Charlotte.The network of transshipment routes shown below indicates the cost associated with shipping a box from the plants to the warehouses and then the cost of shipping the repackaged unit from the warehouses to the final customers.
Assume that the supply and demand requirements are as shown in the table below. The company would like to determine the lowest cost shipping and distribution plan.The following solution was produced using Microsoft Excel.
How many boxes are shipped from Seattle?
A)4500
B)4000
C)1500
D)500
فتح الحزمة
افتح القفل للوصول البطاقات البالغ عددها 28 في هذه المجموعة.
فتح الحزمة
k this deck
25
How many units are being shipped from Philadelphia?
A)0
B)200
C)400
D)500
A)0
B)200
C)400
D)500
فتح الحزمة
افتح القفل للوصول البطاقات البالغ عددها 28 في هذه المجموعة.
فتح الحزمة
k this deck
26
The spreadsheet cell that contains the total cost of the transportation plan is known as the __________ in Excel's Solver dialog box.
A)Changing Cell
B)Target Cell
C)Constraint Cell
D)Total Cost Cell
A)Changing Cell
B)Target Cell
C)Constraint Cell
D)Total Cost Cell
فتح الحزمة
افتح القفل للوصول البطاقات البالغ عددها 28 في هذه المجموعة.
فتح الحزمة
k this deck
27
How many units are being shipped to New York?
A)0
B)400
C)500
D)600
A)0
B)400
C)500
D)600
فتح الحزمة
افتح القفل للوصول البطاقات البالغ عددها 28 في هذه المجموعة.
فتح الحزمة
k this deck
28
Use this problem for the next four (4)questions.
A company has manufacturing plants in Las Vegas,Portland,and Seattle.Items produced from these plants are boxed and shipped to warehouses in Minneapolis and Chicago where they are tested and repackaged for distribution to final customers in New York,Miami,and Charlotte.The network of transshipment routes shown below indicates the cost associated with shipping a box from the plants to the warehouses and then the cost of shipping the repackaged unit from the warehouses to the final customers.
Assume that the supply and demand requirements are as shown in the table below.
The company would like to determine the lowest cost shipping and distribution plan.
The following solution was produced using Microsoft Excel.
How many boxes are sent from Seattle to the Chicago transshipment point?
A)500
B)1500
C)2500
D)4000
A company has manufacturing plants in Las Vegas,Portland,and Seattle.Items produced from these plants are boxed and shipped to warehouses in Minneapolis and Chicago where they are tested and repackaged for distribution to final customers in New York,Miami,and Charlotte.The network of transshipment routes shown below indicates the cost associated with shipping a box from the plants to the warehouses and then the cost of shipping the repackaged unit from the warehouses to the final customers.
Assume that the supply and demand requirements are as shown in the table below. The company would like to determine the lowest cost shipping and distribution plan.The following solution was produced using Microsoft Excel.
How many boxes are sent from Seattle to the Chicago transshipment point?
A)500
B)1500
C)2500
D)4000
فتح الحزمة
افتح القفل للوصول البطاقات البالغ عددها 28 في هذه المجموعة.
فتح الحزمة
k this deck
فتح الحزمة
افتح القفل للوصول البطاقات البالغ عددها 28 في هذه المجموعة.


