Deck 7: Demand Estimation and Forecasting
ملء الشاشة (f)
سؤال
a.complements since the coefficient on M is positive.
b.substitutes since the coefficient on M is positive.
c.complements since the coefficient on is positive.
d.substitutes since the coefficient on is positive.
The estimated demand for a good is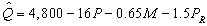 where Q is the quantity demanded of the good,P is the price of the good,M is income,and
  is the price of related good R.This good and good R are
A)complements since the coefficient on M is negative.
B)substitutes since the coefficient on M is negative.
C)complements since the coefficient on is negative.
D)substitutes since the coefficient on is negative.
E)none of the above
b.substitutes since the coefficient on M is positive.
c.complements since the coefficient on
is positive.d.substitutes since the coefficient on
is positive.The estimated demand for a good is
where Q is the quantity demanded of the good,P is the price of the good,M is income,and is the price of related good R.This good and good R areA)complements since the coefficient on M is negative.
B)substitutes since the coefficient on M is negative.
C)complements since the coefficient on
is negative.D)substitutes since the coefficient on
is negative.E)none of the above
سؤال
سؤال
If demand is estimated using the empirical specification 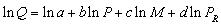 ,then an equivalent expression for demand is
A)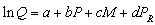 .
.
B)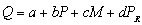 .
.
C)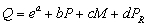 .
.
D) .
.
E)none of the above
,then an equivalent expression for demand isA)
.B)
.C)
.D)
.E)none of the above
سؤال
estimated demand for a good is  where Q is the quantity demanded of the good,P is the price of the good,M is income,and
  is the price of related good R.The coefficient on P
A)does not have the expected sign.
B)is negative as expected.
C)should have the same sign as the coefficient on .
.
D)should not be greater than one in absolute value).
E)both b and d
where Q is the quantity demanded of the good,P is the price of the good,M is income,and is the price of related good R.The coefficient on PA)does not have the expected sign.
B)is negative as expected.
C)should have the same sign as the coefficient on
.D)should not be greater than one in absolute value).
E)both b and d
سؤال
a.complements since the coefficient on M is positive.
b.substitutes since the coefficient on M is positive.
c.complements since the coefficient on is positive.
d.substitutes since the coefficient on is positive.
estimated demand for a good is where Q is the quantity demanded of the good,P is the price of the good,M is income,and
  is the price of related good R.The coefficient on P
A)violates the law of demand.
B)is negative as dictated by the law of demand.
C)should not be greater than one in absolute value).
D)should have the same sign as the coefficient on .
.
E)both c and d
b.substitutes since the coefficient on M is positive.
c.complements since the coefficient on
is positive.d.substitutes since the coefficient on
is positive.estimated demand for a good is
where Q is the quantity demanded of the good,P is the price of the good,M is income,and is the price of related good R.The coefficient on PA)violates the law of demand.
B)is negative as dictated by the law of demand.
C)should not be greater than one in absolute value).
D)should have the same sign as the coefficient on
.E)both c and d
سؤال
a.complements since the coefficient on M is positive.
b.substitutes since the coefficient on M is positive.
c.complements since the coefficient on is positive.
d.substitutes since the coefficient on is positive.
The estimated demand for a good is where Q is the quantity demanded of the good,P is the price of the good,M is income,and
  is the price of related good R.If the price of the good rises by $10,all else constant,the quantity demanded will ________ by ________ units.
A)increase; 16 units
B)decrease; 160 units
C)decrease; 1.5 units
D)increase; 150 units
b.substitutes since the coefficient on M is positive.
c.complements since the coefficient on
is positive.d.substitutes since the coefficient on
is positive.The estimated demand for a good is
where Q is the quantity demanded of the good,P is the price of the good,M is income,and is the price of related good R.If the price of the good rises by $10,all else constant,the quantity demanded will ________ by ________ units.A)increase; 16 units
B)decrease; 160 units
C)decrease; 1.5 units
D)increase; 150 units
سؤال
Build-Right Concrete Products produces specialty cement used in construction of highways.Build-Right is a price-setting firm and estimates the demand for its cement by the State Highway Department using a demand function in the nonlinear form:  where Q = yards of cement demanded monthly,P = the price of Build-Right's cement per yard,M = state tax revenues per capita,and
  = the price of asphalt per yard.The manager at Build-Right transforms the nonlinear relation into a linear relation for estimation.The estimation results are presented below:
  Given the above,the estimated demand for cement is
A)elastic because = -4.0.
B)elastic because = -2.0.
C)elastic because = -1.5.
D)inelastic because = -0.32.
E)inelastic because = -0.8.
where Q = yards of cement demanded monthly,P = the price of Build-Right's cement per yard,M = state tax revenues per capita,and = the price of asphalt per yard.The manager at Build-Right transforms the nonlinear relation into a linear relation for estimation.The estimation results are presented below: Given the above,the estimated demand for cement isA)elastic because
= -4.0.B)elastic because
= -2.0.C)elastic because
= -1.5.D)inelastic because
= -0.32.E)inelastic because
= -0.8. سؤال
a.complements since the coefficient on M is positive.
b.substitutes since the coefficient on M is positive.
c.complements since the coefficient on is positive.
d.substitutes since the coefficient on is positive.
estimated demand for a good is where Q is the quantity demanded of the good,P is the price of the good,M is income,and
  is the price of related good R.If income decreases by $1,000,all else constant,quantity demanded will ________ by _________ units.
A)decrease; 320 units
B)increase; 3.2 units
C)decrease; 1200 units
D)increase; 500 units
E)decrease; 500 units
b.substitutes since the coefficient on M is positive.
c.complements since the coefficient on
is positive.d.substitutes since the coefficient on
is positive.estimated demand for a good is
where Q is the quantity demanded of the good,P is the price of the good,M is income,and is the price of related good R.If income decreases by $1,000,all else constant,quantity demanded will ________ by _________ units.A)decrease; 320 units
B)increase; 3.2 units
C)decrease; 1200 units
D)increase; 500 units
E)decrease; 500 units
سؤال
Build-Right Concrete Products produces specialty cement used in construction of highways.Build-Right is a price-setting firm and estimates the demand for its cement by the State Highway Department using a demand function in the nonlinear form:  where Q = yards of cement demanded monthly,P = the price of Build-Right's cement per yard,M = state tax revenues per capita,and
  = the price of asphalt per yard.The manager at Build-Right transforms the nonlinear relation into a linear relation for estimation.The estimation results are presented below:
  Given the above,the estimated cross-price elasticity of demand for cement relative to the price of asphalt is
A)0.3
B)0.6
C)1.2
D)3.0
E)none of the above
where Q = yards of cement demanded monthly,P = the price of Build-Right's cement per yard,M = state tax revenues per capita,and = the price of asphalt per yard.The manager at Build-Right transforms the nonlinear relation into a linear relation for estimation.The estimation results are presented below: Given the above,the estimated cross-price elasticity of demand for cement relative to the price of asphalt isA)0.3
B)0.6
C)1.2
D)3.0
E)none of the above
سؤال
a.complements since the coefficient on M is positive.
b.substitutes since the coefficient on M is positive.
c.complements since the coefficient on is positive.
d.substitutes since the coefficient on is positive.
The estimated demand for a good is where Q is the quantity demanded of the good,P is the price of the good,M is income,and
  is the price of related good R.The good is
A)an inferior good since the coefficient on is negative.
B)a normal good since the coefficient on is negative.
C)a normal good since the coefficient on M is greater than one in absolute value).
D)an inferior good since the coefficient on M is negative.
E)none of the above
b.substitutes since the coefficient on M is positive.
c.complements since the coefficient on
is positive.d.substitutes since the coefficient on
is positive.The estimated demand for a good is
where Q is the quantity demanded of the good,P is the price of the good,M is income,and is the price of related good R.The good isA)an inferior good since the coefficient on
is negative.B)a normal good since the coefficient on
is negative.C)a normal good since the coefficient on M is greater than one in absolute value).
D)an inferior good since the coefficient on M is negative.
E)none of the above
سؤال
سؤال
estimated demand for a good is 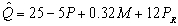 where Q is the quantity demanded of the good,P is the price of the good,M is income,and
  is the price of related good R.The good is
A)an inferior good since the coefficient on is positive.
B)a normal good since the coefficient on is positive.
C)an inferior good since the coefficient on M is greater than one.
D)a normal good since the coefficient on M is positive.
E)none of the above
where Q is the quantity demanded of the good,P is the price of the good,M is income,and is the price of related good R.The good isA)an inferior good since the coefficient on
is positive.B)a normal good since the coefficient on
is positive.C)an inferior good since the coefficient on M is greater than one.
D)a normal good since the coefficient on M is positive.
E)none of the above
سؤال
estimated demand for a good is  where Q is the quantity demanded of the good,P is the price of the good,M is income,and
  is the price of related good R.This good and the related good R are
where Q is the quantity demanded of the good,P is the price of the good,M is income,and is the price of related good R.This good and the related good R are سؤال
سؤال
Build-Right Concrete Products produces specialty cement used in construction of highways.Build-Right is a price-setting firm and estimates the demand for its cement by the State Highway Department using a demand function in the nonlinear form:  where Q = yards of cement demanded monthly,P = the price of Build-Right's cement per yard,M = state tax revenues per capita,and
  = the price of asphalt per yard.The manager at Build-Right transforms the nonlinear relation into a linear relation for estimation.The estimation results are presented below:
  Given the above,if the price of asphalt
  )decreases 20%,the estimated quantity of cement demanded will:
A)increase 12%
B)increase 6%
C)increase 1.2%
D)decrease 12%.
E)decrease 1.2%.
where Q = yards of cement demanded monthly,P = the price of Build-Right's cement per yard,M = state tax revenues per capita,and = the price of asphalt per yard.The manager at Build-Right transforms the nonlinear relation into a linear relation for estimation.The estimation results are presented below: Given the above,if the price of asphalt )decreases 20%,the estimated quantity of cement demanded will:A)increase 12%
B)increase 6%
C)increase 1.2%
D)decrease 12%.
E)decrease 1.2%.
سؤال
سؤال
a.complements since the coefficient on M is positive.
b.substitutes since the coefficient on M is positive.
c.complements since the coefficient on is positive.
d.substitutes since the coefficient on is positive.
estimated demand for a good is where Q is the quantity demanded of the good,P is the price of the good,M is income,and
  is the price of related good R.If the price of the good falls by $4,the quantity demanded will ________ by ________ units.
A)increase; 5 units
B)increase; 20 units
C)increase; 50 units
D)increase; 48 units
E)decrease; 12 units
b.substitutes since the coefficient on M is positive.
c.complements since the coefficient on
is positive.d.substitutes since the coefficient on
is positive.estimated demand for a good is
where Q is the quantity demanded of the good,P is the price of the good,M is income,and is the price of related good R.If the price of the good falls by $4,the quantity demanded will ________ by ________ units.A)increase; 5 units
B)increase; 20 units
C)increase; 50 units
D)increase; 48 units
E)decrease; 12 units
سؤال
a.complements since the coefficient on M is positive.
b.substitutes since the coefficient on M is positive.
c.complements since the coefficient on is positive.
d.substitutes since the coefficient on is positive.
The estimated demand for a good is where Q is the quantity demanded of the good,P is the price of the good,M is income,and
  is the price of related good R.If income decreases by $2,000,all else constant,quantity demanded will ________ by _________ units.
A)increase; 1.30 units
B)decrease; 6.5 units
C)increase; 1,300 units
D)decrease; 65 units
b.substitutes since the coefficient on M is positive.
c.complements since the coefficient on
is positive.d.substitutes since the coefficient on
is positive.The estimated demand for a good is
where Q is the quantity demanded of the good,P is the price of the good,M is income,and is the price of related good R.If income decreases by $2,000,all else constant,quantity demanded will ________ by _________ units.A)increase; 1.30 units
B)decrease; 6.5 units
C)increase; 1,300 units
D)decrease; 65 units
سؤال
Build-Right Concrete Products produces specialty cement used in construction of highways.Build-Right is a price-setting firm and estimates the demand for its cement by the State Highway Department using a demand function in the nonlinear form:  where Q = yards of cement demanded monthly,P = the price of Build-Right's cement per yard,M = state tax revenues per capita,and
  = the price of asphalt per yard.The manager at Build-Right transforms the nonlinear relation into a linear relation for estimation.The estimation results are presented below:
  Given the above,if tax revenue per capita M)increases 5%,the estimated quantity of cement demanded will
A)increase by less than 1%.
B)increase more than 1% but less than 5%.
C)increase more than 5% but less than 10%.
D)increase more than 10%.
where Q = yards of cement demanded monthly,P = the price of Build-Right's cement per yard,M = state tax revenues per capita,and = the price of asphalt per yard.The manager at Build-Right transforms the nonlinear relation into a linear relation for estimation.The estimation results are presented below: Given the above,if tax revenue per capita M)increases 5%,the estimated quantity of cement demanded willA)increase by less than 1%.
B)increase more than 1% but less than 5%.
C)increase more than 5% but less than 10%.
D)increase more than 10%.
سؤال
Build-Right Concrete Products produces specialty cement used in construction of highways.Build-Right is a price-setting firm and estimates the demand for its cement by the State Highway Department using a demand function in the nonlinear form:  where Q = yards of cement demanded monthly,P = the price of Build-Right's cement per yard,M = state tax revenues per capita,and
  = the price of asphalt per yard.The manager at Build-Right transforms the nonlinear relation into a linear relation for estimation.The estimation results are presented below:
  Given the above,at the 1 percent level of significance,the number of degrees of freedom for a t-test is _____,and the critical value of the t-statistic is ________.0Only parameter estimates)________ is are)NOT statistically significant at the 1 percent level of significance.
A)30; 2.457;
B)30; 2.750;
C)34; 2.042;
D)34; 2.042, and
and

where Q = yards of cement demanded monthly,P = the price of Build-Right's cement per yard,M = state tax revenues per capita,and = the price of asphalt per yard.The manager at Build-Right transforms the nonlinear relation into a linear relation for estimation.The estimation results are presented below: Given the above,at the 1 percent level of significance,the number of degrees of freedom for a t-test is _____,and the critical value of the t-statistic is ________.0Only parameter estimates)________ is are)NOT statistically significant at the 1 percent level of significance.A)30; 2.457;
B)30; 2.750;
C)34; 2.042;
D)34; 2.042,
and سؤال
The following linear demand specification is estimated for Conlan Enterprises,a price-setting firm:  where Q is the quantity demanded of the product Conlan Enterprises sells,P is the price of that product,M is income,and
  is the price of a related product.The results of the estimation are presented below:
  For the next 2 questions suppose income remains at $10,000 but the price of the related good increases to $60 and Conlan decides to raise the price of its product to $50.What is the new own price elasticity of demand?
A)-0.24
B)-0.43
C)-0.87
D)-1.00
E)-1.26
where Q is the quantity demanded of the product Conlan Enterprises sells,P is the price of that product,M is income,and is the price of a related product.The results of the estimation are presented below: For the next 2 questions suppose income remains at $10,000 but the price of the related good increases to $60 and Conlan decides to raise the price of its product to $50.What is the new own price elasticity of demand?A)-0.24
B)-0.43
C)-0.87
D)-1.00
E)-1.26
سؤال
سؤال
سؤال
The estimated demand for a good X is 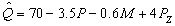 ,where
  = units of the good,P = price of the good,M = income,and
  = price of related good Z.All parameter estimates are statistically significant.Which of the following statements is correct?
A)X is a normal good.
B)X is an inferior good.
C)X and Z are substitutes.
D)X and Z are complements.
E)both b and c
,where = units of the good,P = price of the good,M = income,and = price of related good Z.All parameter estimates are statistically significant.Which of the following statements is correct?A)X is a normal good.
B)X is an inferior good.
C)X and Z are substitutes.
D)X and Z are complements.
E)both b and c
سؤال
سؤال
The following linear demand specification is estimated for Conlan Enterprises,a price-setting firm:  where Q is the quantity demanded of the product Conlan Enterprises sells,P is the price of that product,M is income,and
  is the price of a related product.The results of the estimation are presented below:
  Assume that the income is $10,000,the price of the related good is $40,and Conlan chooses to set the price of this product at $30.At the prices and income given above,what is the price elasticity of demand?
A)-0.43
B)-0.86
C)-1.00
D)-1.43
E)-2.40
where Q is the quantity demanded of the product Conlan Enterprises sells,P is the price of that product,M is income,and is the price of a related product.The results of the estimation are presented below: Assume that the income is $10,000,the price of the related good is $40,and Conlan chooses to set the price of this product at $30.At the prices and income given above,what is the price elasticity of demand?A)-0.43
B)-0.86
C)-1.00
D)-1.43
E)-2.40
سؤال
Build-Right Concrete Products produces specialty cement used in construction of highways.Build-Right is a price-setting firm and estimates the demand for its cement by the State Highway Department using a demand function in the nonlinear form:  where Q = yards of cement demanded monthly,P = the price of Build-Right's cement per yard,M = state tax revenues per capita,and
  = the price of asphalt per yard.The manager at Build-Right transforms the nonlinear relation into a linear relation for estimation.The estimation results are presented below:
  Given the above,if Build-Right decides to charge the State Highway Department $55 per yard for its cement when tax revenues per capita are $3,200 and the price of asphalt is $35 per yard,the expected quantity demanded is
A)1,000 yards of cement.
B)2,000 yards of cement.
C)4,000 yards of cement.
D)6,000 yards of cement.
E)8,000 yards of cement.
where Q = yards of cement demanded monthly,P = the price of Build-Right's cement per yard,M = state tax revenues per capita,and = the price of asphalt per yard.The manager at Build-Right transforms the nonlinear relation into a linear relation for estimation.The estimation results are presented below: Given the above,if Build-Right decides to charge the State Highway Department $55 per yard for its cement when tax revenues per capita are $3,200 and the price of asphalt is $35 per yard,the expected quantity demanded isA)1,000 yards of cement.
B)2,000 yards of cement.
C)4,000 yards of cement.
D)6,000 yards of cement.
E)8,000 yards of cement.
سؤال
سؤال
The following linear demand specification is estimated for Conlan Enterprises,a price-setting firm:  where Q is the quantity demanded of the product Conlan Enterprises sells,P is the price of that product,M is income,and
  is the price of a related product.The results of the estimation are presented below:
  Given the above,based upon the parameter estimates in the above table
A)this good is a normal good.
B)the related good is a substitute.
C)the related good is a complement.
D)a and b
E)a and c
where Q is the quantity demanded of the product Conlan Enterprises sells,P is the price of that product,M is income,and is the price of a related product.The results of the estimation are presented below: Given the above,based upon the parameter estimates in the above tableA)this good is a normal good.
B)the related good is a substitute.
C)the related good is a complement.
D)a and b
E)a and c
سؤال
A consulting firm estimates the following quarterly sales forecasting model:  The equation is estimated using quarterly data from 2005I-2015III t = 1,...,43).The variable D is a dummy variable for the second quarter where: D = 1 in the second quarter,and 0 otherwise.
The results of the estimation are:
 Given the above,these estimates indicate that the second quarter change in sales is
A)22.5 units higher in the second quarter than in the other three quarters.
B)1.86 units higher in the second quarter than in the other three quarters.
C)2.00 units higher in the second quarter than in the other three quarters.
D)24.5 units higher in the second quarter than in the other three quarters.
The equation is estimated using quarterly data from 2005I-2015III t = 1,...,43).The variable D is a dummy variable for the second quarter where: D = 1 in the second quarter,and 0 otherwise.The results of the estimation are:
Given the above,these estimates indicate that the second quarter change in sales isA)22.5 units higher in the second quarter than in the other three quarters.
B)1.86 units higher in the second quarter than in the other three quarters.
C)2.00 units higher in the second quarter than in the other three quarters.
D)24.5 units higher in the second quarter than in the other three quarters.
سؤال
The following linear demand specification is estimated for Conlan Enterprises,a price-setting firm:  where Q is the quantity demanded of the product Conlan Enterprises sells,P is the price of that product,M is income,and
  is the price of a related product.The results of the estimation are presented below:
  Given the above,at the 1% level of significance,the critical value of the t-statistic used by Conlan to test for statistical significance has _____ degrees of freedom and is equal to ________.
A)32; 0.7984
B)32; 36.14
C)32; 4.57
D)30; 2.750
E)28; 2.763
where Q is the quantity demanded of the product Conlan Enterprises sells,P is the price of that product,M is income,and is the price of a related product.The results of the estimation are presented below: Given the above,at the 1% level of significance,the critical value of the t-statistic used by Conlan to test for statistical significance has _____ degrees of freedom and is equal to ________.A)32; 0.7984
B)32; 36.14
C)32; 4.57
D)30; 2.750
E)28; 2.763
سؤال
سؤال
سؤال
The following linear demand specification is estimated for Conlan Enterprises,a price-setting firm:  where Q is the quantity demanded of the product Conlan Enterprises sells,P is the price of that product,M is income,and
  is the price of a related product.The results of the estimation are presented below:
  For the next 2 questions suppose income remains at $10,000 but the price of the related good increases to $60 and Conlan decides to raise the price of its product to $50.At the prices and income given above,Conlan can expect to sell _________units.
A)342
B)600
C)724
D)864
E)872
where Q is the quantity demanded of the product Conlan Enterprises sells,P is the price of that product,M is income,and is the price of a related product.The results of the estimation are presented below: For the next 2 questions suppose income remains at $10,000 but the price of the related good increases to $60 and Conlan decides to raise the price of its product to $50.At the prices and income given above,Conlan can expect to sell _________units.A)342
B)600
C)724
D)864
E)872
سؤال
The following linear demand specification is estimated for Conlan Enterprises,a price-setting firm:  where Q is the quantity demanded of the product Conlan Enterprises sells,P is the price of that product,M is income,and
  is the price of a related product.The results of the estimation are presented below:
  Given the above,at the 1% level of significance,which estimates are statistically significant?
A)All are statistically significant
B)All but are statistically significant
C)Only are statistically significant
D)Only is statistically significant
E)All but are statistically significant
where Q is the quantity demanded of the product Conlan Enterprises sells,P is the price of that product,M is income,and is the price of a related product.The results of the estimation are presented below: Given the above,at the 1% level of significance,which estimates are statistically significant?A)All are statistically significant
B)All but
are statistically significantC)Only
are statistically significantD)Only
is statistically significantE)All but
are statistically significant سؤال
سؤال
A consulting firm estimates the following quarterly sales forecasting model:  The equation is estimated using quarterly data from 2005I-2015III t = 1,...,43).The variable D is a dummy variable for the second quarter where: D = 1 in the second quarter,and 0 otherwise.
The results of the estimation are:
 Given the above,at the 1 percent level of significance,is there a statistically significant trend in sales?
A)Yes,because 0.0016 < 0.01.
B)No,because 0.0016 < 0.01.
C)Yes,because 0.55 > 0.01.
D)Yes,because 1.86 > 0.01.
E)both c and d
The equation is estimated using quarterly data from 2005I-2015III t = 1,...,43).The variable D is a dummy variable for the second quarter where: D = 1 in the second quarter,and 0 otherwise.The results of the estimation are:
Given the above,at the 1 percent level of significance,is there a statistically significant trend in sales?A)Yes,because 0.0016 < 0.01.
B)No,because 0.0016 < 0.01.
C)Yes,because 0.55 > 0.01.
D)Yes,because 1.86 > 0.01.
E)both c and d
سؤال
The following linear demand specification is estimated for Conlan Enterprises,a price-setting firm:  where Q is the quantity demanded of the product Conlan Enterprises sells,P is the price of that product,M is income,and
  is the price of a related product.The results of the estimation are presented below:
  Assume that the income is $10,000,the price of the related good is $40,and Conlan chooses to set the price of this product at $30.At the prices and income given above,what is the income elasticity?
A)-1.62
B)-0.87
C)0.21
D)0.31
E)1.50
where Q is the quantity demanded of the product Conlan Enterprises sells,P is the price of that product,M is income,and is the price of a related product.The results of the estimation are presented below: Assume that the income is $10,000,the price of the related good is $40,and Conlan chooses to set the price of this product at $30.At the prices and income given above,what is the income elasticity?A)-1.62
B)-0.87
C)0.21
D)0.31
E)1.50
سؤال
A consulting firm estimates the following quarterly sales forecasting model:  The equation is estimated using quarterly data from 2005I-2015III t = 1,...,43).The variable D is a dummy variable for the second quarter where: D = 1 in the second quarter,and 0 otherwise.
The results of the estimation are:
 Give the above,at the 1 percent level of significance,is there a statistically significant trend in sales?
A)No,since 1.86 < 2.704
B)No,since 0.55 < 1.86
C)No,since 1.02 < 2.704
D)Yes,since 1.86 > 0.55
E)Yes,since 3.38 > 2.704
The equation is estimated using quarterly data from 2005I-2015III t = 1,...,43).The variable D is a dummy variable for the second quarter where: D = 1 in the second quarter,and 0 otherwise.The results of the estimation are:
Give the above,at the 1 percent level of significance,is there a statistically significant trend in sales?A)No,since 1.86 < 2.704
B)No,since 0.55 < 1.86
C)No,since 1.02 < 2.704
D)Yes,since 1.86 > 0.55
E)Yes,since 3.38 > 2.704
سؤال
The following linear demand specification is estimated for Conlan Enterprises,a price-setting firm:  where Q is the quantity demanded of the product Conlan Enterprises sells,P is the price of that product,M is income,and
  is the price of a related product.The results of the estimation are presented below:
  Assume that the income is $10,000,the price of the related good is $40,and Conlan chooses to set the price of this product at $30.At the prices and income given above,Conlan can expect to sell _________units.
A)342
B)600
C)724
D)864
E)872
where Q is the quantity demanded of the product Conlan Enterprises sells,P is the price of that product,M is income,and is the price of a related product.The results of the estimation are presented below: Assume that the income is $10,000,the price of the related good is $40,and Conlan chooses to set the price of this product at $30.At the prices and income given above,Conlan can expect to sell _________units.A)342
B)600
C)724
D)864
E)872
سؤال
سؤال
A consulting firm estimates the following quarterly sales forecasting model: 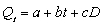 The equation is estimated using quarterly data from 2005I-2015III t = 1,...,43).The variable D is a dummy variable for the second quarter where: D = 1 in the second quarter,and 0 otherwise.
The results of the estimation are:
 Using the estimated trend line above,what is the predicted level of sales in 2016I ?
A)110.06
B)106.20
C)104.34
D)102.2
E)none of the above
The equation is estimated using quarterly data from 2005I-2015III t = 1,...,43).The variable D is a dummy variable for the second quarter where: D = 1 in the second quarter,and 0 otherwise.The results of the estimation are:
Using the estimated trend line above,what is the predicted level of sales in 2016I ?A)110.06
B)106.20
C)104.34
D)102.2
E)none of the above
سؤال
A consulting firm estimates the following quarterly sales forecasting model:  The equation is estimated using quarterly data from 2005I-2015III t = 1,...,43).The variable D is a dummy variable for the second quarter where: D = 1 in the second quarter,and 0 otherwise.
The results of the estimation are:
 Given the above,what is the estimated intercept of the trend line in the second quarter?
A)22.50
B)24.50
C)24.36
D)2.00
E)none of the above
The equation is estimated using quarterly data from 2005I-2015III t = 1,...,43).The variable D is a dummy variable for the second quarter where: D = 1 in the second quarter,and 0 otherwise.The results of the estimation are:
Given the above,what is the estimated intercept of the trend line in the second quarter?A)22.50
B)24.50
C)24.36
D)2.00
E)none of the above
سؤال
A consulting firm estimates the following quarterly sales forecasting model:  The equation is estimated using quarterly data from 2005I-2015III t = 1,...,43).The variable D is a dummy variable for the second quarter where: D = 1 in the second quarter,and 0 otherwise.
The results of the estimation are:
 Using the estimated trend line above,what is the predicted level of sales in 2015IV ?
A)110.06
B)106.20
C)104.34
D)102.2
E)none of the above
The equation is estimated using quarterly data from 2005I-2015III t = 1,...,43).The variable D is a dummy variable for the second quarter where: D = 1 in the second quarter,and 0 otherwise.The results of the estimation are:
Using the estimated trend line above,what is the predicted level of sales in 2015IV ?A)110.06
B)106.20
C)104.34
D)102.2
E)none of the above
سؤال
A forecaster used the regression equation  and quarterly sales data for 1996I-2013IV t = 1,...,64)for an appliance manufacturer to obtain the results shown below.Q is quarterly sales,and
  and
and  are dummy variables for quarters I,II,and III.
  Using the estimation results given above,the predicted level of sales in 2014IV is _______ units.
A)125
B)127.50
C)132
D)133.5
E)none of the above
and quarterly sales data for 1996I-2013IV t = 1,...,64)for an appliance manufacturer to obtain the results shown below.Q is quarterly sales,and and are dummy variables for quarters I,II,and III. Using the estimation results given above,the predicted level of sales in 2014IV is _______ units.A)125
B)127.50
C)132
D)133.5
E)none of the above
سؤال
A forecaster used the regression equation  and quarterly sales data for 1996I-2013IV t = 1,...,64)for an appliance manufacturer to obtain the results shown below.Q is quarterly sales,and
  and
and  are dummy variables for quarters I,II,and III.
  At the 5 percent level of significance,is there a statistically significant trend in sales?
A)Yes,because 0.0362 < 0.05.
B)No,because 0.0362 > 0.01.
C)Yes,because 0.700 > 0.05.
D)Yes,because 2.14 >0.05.
E)both c and d
and quarterly sales data for 1996I-2013IV t = 1,...,64)for an appliance manufacturer to obtain the results shown below.Q is quarterly sales,and and are dummy variables for quarters I,II,and III. At the 5 percent level of significance,is there a statistically significant trend in sales?A)Yes,because 0.0362 < 0.05.
B)No,because 0.0362 > 0.01.
C)Yes,because 0.700 > 0.05.
D)Yes,because 2.14 >0.05.
E)both c and d
سؤال
The manufacturer of Beanie Baby dolls used quarterly price data for 2005I - 2013IV t = 1,...,36)and the regression equation  to forecast doll prices in the year 2014.
  is the quarterly price of dolls,and
  and
and  are dummy variables for quarters I,II,and III,respectively.
  At the 2 percent level of statistical significance,is there a statistically significant trend in the price of dolls?
A)Yes,because 0.0022 < 0.02.
B)No,because 0.0022 > 0.02.
C)Yes,because 0.800 > 0.02.
D)Yes,because 0.240 > 0.02.
E)Yes,because 3.33 > 0.02.
to forecast doll prices in the year 2014. is the quarterly price of dolls,and and are dummy variables for quarters I,II,and III,respectively. At the 2 percent level of statistical significance,is there a statistically significant trend in the price of dolls?A)Yes,because 0.0022 < 0.02.
B)No,because 0.0022 > 0.02.
C)Yes,because 0.800 > 0.02.
D)Yes,because 0.240 > 0.02.
E)Yes,because 3.33 > 0.02.
سؤال
A forecaster used the regression equation  and quarterly sales data for 1996I-2013IV t = 1,...,64)for an appliance manufacturer to obtain the results shown below.Q is quarterly sales,and
  and
and  are dummy variables for quarters I,II,and III.
  Using a 5 percent significance level,these estimation results indicate that sales in
A)the first quarter are greater than sales in any other quarter.
B)the second quarter are greater than sales in any other quarter.
C)the third quarter are greater than sales in any other quarter.
D)the fourth quarter are greater than sales in any other quarter.
and quarterly sales data for 1996I-2013IV t = 1,...,64)for an appliance manufacturer to obtain the results shown below.Q is quarterly sales,and and are dummy variables for quarters I,II,and III. Using a 5 percent significance level,these estimation results indicate that sales inA)the first quarter are greater than sales in any other quarter.
B)the second quarter are greater than sales in any other quarter.
C)the third quarter are greater than sales in any other quarter.
D)the fourth quarter are greater than sales in any other quarter.
سؤال
A consulting firm estimates the following quarterly sales forecasting model:  The equation is estimated using quarterly data from 2005I-2015III t = 1,...,43).The variable D is a dummy variable for the second quarter where: D = 1 in the second quarter,and 0 otherwise.
The results of the estimation are:
 Given the above,what is the estimated intercept of the trend line in the third quarter?
A)22.50
B)24.50
C)24.36
D)2.00
E)none of the above
The equation is estimated using quarterly data from 2005I-2015III t = 1,...,43).The variable D is a dummy variable for the second quarter where: D = 1 in the second quarter,and 0 otherwise.The results of the estimation are:
Given the above,what is the estimated intercept of the trend line in the third quarter?A)22.50
B)24.50
C)24.36
D)2.00
E)none of the above
سؤال
A forecaster used the regression equation  and quarterly sales data for 1996I-2013IV t = 1,...,64)for an appliance manufacturer to obtain the results shown below.Q is quarterly sales,and
  and
and  are dummy variables for quarters I,II,and III.
  What is the estimated intercept of the trend line in the second quarter?
A)25
B)26.6
C)55
D)65
E)none of the above
and quarterly sales data for 1996I-2013IV t = 1,...,64)for an appliance manufacturer to obtain the results shown below.Q is quarterly sales,and and are dummy variables for quarters I,II,and III. What is the estimated intercept of the trend line in the second quarter?A)25
B)26.6
C)55
D)65
E)none of the above
سؤال
The manufacturer of Beanie Baby dolls used quarterly price data for 2005I - 2013IV t = 1,...,36)and the regression equation  to forecast doll prices in the year 2014.
  is the quarterly price of dolls,and
  and
and  are dummy variables for quarters I,II,and III,respectively.
  What is the estimated intercept of the trend line in the 1st quarter?
A)24
B)-8
C)32
D)16
E)none of the above
to forecast doll prices in the year 2014. is the quarterly price of dolls,and and are dummy variables for quarters I,II,and III,respectively. What is the estimated intercept of the trend line in the 1st quarter?A)24
B)-8
C)32
D)16
E)none of the above
سؤال
A forecaster used the regression equation  and quarterly sales data for 1996I-2013IV t = 1,...,64)for an appliance manufacturer to obtain the results shown below.Q is quarterly sales,and
  and
and  are dummy variables for quarters I,II,and III.
  Using the estimation results given above,the predicted level of sales in 2014III is _______ units.
A)141.5
B)156
C)172
D)173.5
E)none of the above
and quarterly sales data for 1996I-2013IV t = 1,...,64)for an appliance manufacturer to obtain the results shown below.Q is quarterly sales,and and are dummy variables for quarters I,II,and III. Using the estimation results given above,the predicted level of sales in 2014III is _______ units.A)141.5
B)156
C)172
D)173.5
E)none of the above
سؤال
A forecaster used the regression equation  and quarterly sales data for 1996I-2013IV t = 1,...,64)for an appliance manufacturer to obtain the results shown below.Q is quarterly sales,and
  and
and  are dummy variables for quarters I,II,and III.
  Using the estimation results given above,the predicted level of sales in 2014I is _______ units.
A)137.5
B)139
C)133.5
D)132
E)none of the above
and quarterly sales data for 1996I-2013IV t = 1,...,64)for an appliance manufacturer to obtain the results shown below.Q is quarterly sales,and and are dummy variables for quarters I,II,and III. Using the estimation results given above,the predicted level of sales in 2014I is _______ units.A)137.5
B)139
C)133.5
D)132
E)none of the above
سؤال
A forecaster used the regression equation  and quarterly sales data for 1996I-2013IV t = 1,...,64)for an appliance manufacturer to obtain the results shown below.Q is quarterly sales,and
  and
and  are dummy variables for quarters I,II,and III.
  In any given year,quarterly sales tend to vary as follows:
A)QI > QII > QIII > QIV
B)QI > QII > QIV > QIII
C)QII > QIII > QIV > QI
D)QIII > QII > QI > QIV
E)QIII > QIV > QII > QI
and quarterly sales data for 1996I-2013IV t = 1,...,64)for an appliance manufacturer to obtain the results shown below.Q is quarterly sales,and and are dummy variables for quarters I,II,and III. In any given year,quarterly sales tend to vary as follows:A)QI > QII > QIII > QIV
B)QI > QII > QIV > QIII
C)QII > QIII > QIV > QI
D)QIII > QII > QI > QIV
E)QIII > QIV > QII > QI
سؤال
A forecaster used the regression equation  and quarterly sales data for 1996I-2013IV t = 1,...,64)for an appliance manufacturer to obtain the results shown below.Q is quarterly sales,and
  and
and  are dummy variables for quarters I,II,and III.
  At the 5 percent level of significance,is there a statistically significant trend in sales?
A)No,because 1.5 < 2.66.
B)No,because 1.5 < 2.00.
C)No,because 2.14 < 2.66.
D)Yes,because 2.14 > 2.00.
E)none of the above
and quarterly sales data for 1996I-2013IV t = 1,...,64)for an appliance manufacturer to obtain the results shown below.Q is quarterly sales,and and are dummy variables for quarters I,II,and III. At the 5 percent level of significance,is there a statistically significant trend in sales?A)No,because 1.5 < 2.66.
B)No,because 1.5 < 2.00.
C)No,because 2.14 < 2.66.
D)Yes,because 2.14 > 2.00.
E)none of the above
سؤال
A forecaster used the regression equation  and quarterly sales data for 1996I-2013IV t = 1,...,64)for an appliance manufacturer to obtain the results shown below.Q is quarterly sales,and
  and
and  are dummy variables for quarters I,II,and III.
  Using the estimation results given above,the predicted level of sales in 2014II is _______ units.
A)127.5
B)137.5
C)154
D)155.5
E)none of the above
and quarterly sales data for 1996I-2013IV t = 1,...,64)for an appliance manufacturer to obtain the results shown below.Q is quarterly sales,and and are dummy variables for quarters I,II,and III. Using the estimation results given above,the predicted level of sales in 2014II is _______ units.A)127.5
B)137.5
C)154
D)155.5
E)none of the above
سؤال
A forecaster used the regression equation  and quarterly sales data for 1996I-2013IV t = 1,...,64)for an appliance manufacturer to obtain the results shown below.Q is quarterly sales,and
  and
and  are dummy variables for quarters I,II,and III.
  The estimated QUARTERLY increase in sales is ______ units,and the estimated ANNUAL increase in sales is ______ units.
A)1.5; 6
B)1.4; 4
C)30; 4
D)1.5; 40
E)none of the above
and quarterly sales data for 1996I-2013IV t = 1,...,64)for an appliance manufacturer to obtain the results shown below.Q is quarterly sales,and and are dummy variables for quarters I,II,and III. The estimated QUARTERLY increase in sales is ______ units,and the estimated ANNUAL increase in sales is ______ units.A)1.5; 6
B)1.4; 4
C)30; 4
D)1.5; 40
E)none of the above
سؤال
The manufacturer of Beanie Baby dolls used quarterly price data for 2005I - 2013IV t = 1,...,36)and the regression equation  to forecast doll prices in the year 2014.
  is the quarterly price of dolls,and
  and
and  are dummy variables for quarters I,II,and III,respectively.
  The estimated QUARTERLY increase in price is ______,and the estimated ANNUAL increase in price is ______ .
A)$1.50; $6.00
B)$1.40; $4.00
C)$0.60; $2.40
D)$0.80; $3.20
E)none of the above
to forecast doll prices in the year 2014. is the quarterly price of dolls,and and are dummy variables for quarters I,II,and III,respectively. The estimated QUARTERLY increase in price is ______,and the estimated ANNUAL increase in price is ______ .A)$1.50; $6.00
B)$1.40; $4.00
C)$0.60; $2.40
D)$0.80; $3.20
E)none of the above
سؤال
The manufacturer of Beanie Baby dolls used quarterly price data for 2005I - 2013IV t = 1,...,36)and the regression equation  to forecast doll prices in the year 2014.
  is the quarterly price of dolls,and
  and
and  are dummy variables for quarters I,II,and III,respectively.
  What is the estimated intercept of the trend line in the 4th quarter?
A)22.8
B)16
C)18
D)20
E)none of the above
to forecast doll prices in the year 2014. is the quarterly price of dolls,and and are dummy variables for quarters I,II,and III,respectively. What is the estimated intercept of the trend line in the 4th quarter?A)22.8
B)16
C)18
D)20
E)none of the above
سؤال
A forecaster used the regression equation  and quarterly sales data for 1996I-2013IV t = 1,...,64)for an appliance manufacturer to obtain the results shown below.Q is quarterly sales,and
  and
and  are dummy variables for quarters I,II,and III.
  What is the estimated intercept of the trend line in the fourth quarter?
A)0
B)40
C)55
D)70
E)none of the above
and quarterly sales data for 1996I-2013IV t = 1,...,64)for an appliance manufacturer to obtain the results shown below.Q is quarterly sales,and and are dummy variables for quarters I,II,and III. What is the estimated intercept of the trend line in the fourth quarter?A)0
B)40
C)55
D)70
E)none of the above
سؤال
The manufacturer of Beanie Baby dolls used quarterly price data for 2005I - 2013IV t = 1,...,36)and the regression equation  to forecast doll prices in the year 2014.
  is the quarterly price of dolls,and
  and
and  are dummy variables for quarters I,II,and III,respectively.
  At the 2 percent level of statistical significance,the results indicate that price in the ________ quarter is significantly lower than in any other quarter.
A)1st
B)2nd
C)3rd
D)4th
to forecast doll prices in the year 2014. is the quarterly price of dolls,and and are dummy variables for quarters I,II,and III,respectively. At the 2 percent level of statistical significance,the results indicate that price in the ________ quarter is significantly lower than in any other quarter.A)1st
B)2nd
C)3rd
D)4th
سؤال
The manufacturer of Beanie Baby dolls used quarterly price data for 2005I - 2013IV t = 1,...,36)and the regression equation  to forecast doll prices in the year 2014.
  is the quarterly price of dolls,and
  and
and  are dummy variables for quarters I,II,and III,respectively.
  In any given year price tends to vary from quarter to quarter as follows:
A)PI > PII > PIII > PIV
B)PI > PIV > PIII > PII
C)PII > PIII > PIV > PI
D)PIII > PI > PII > PIV
E)PIV > PIII > PII > PI
to forecast doll prices in the year 2014. is the quarterly price of dolls,and and are dummy variables for quarters I,II,and III,respectively. In any given year price tends to vary from quarter to quarter as follows:A)PI > PII > PIII > PIV
B)PI > PIV > PIII > PII
C)PII > PIII > PIV > PI
D)PIII > PI > PII > PIV
E)PIV > PIII > PII > PI
سؤال
The manufacturer of Beanie Baby dolls used quarterly price data for 2005I - 2013IV t = 1,...,36)and the regression equation  to forecast doll prices in the year 2014.
  is the quarterly price of dolls,and
  and
and  are dummy variables for quarters I,II,and III,respectively.
  Using the estimated time-series regression,predicted price in the 2nd quarter of 2014 is
A)$48.40
B)$54.40
C)$40.40
D)$51.40
E)none of the above
to forecast doll prices in the year 2014. is the quarterly price of dolls,and and are dummy variables for quarters I,II,and III,respectively. Using the estimated time-series regression,predicted price in the 2nd quarter of 2014 isA)$48.40
B)$54.40
C)$40.40
D)$51.40
E)none of the above
سؤال
The manufacturer of Beanie Baby dolls used quarterly price data for 2005I - 2013IV t = 1,...,36)and the regression equation  to forecast doll prices in the year 2014.
  is the quarterly price of dolls,and
  and
and  are dummy variables for quarters I,II,and III,respectively.
  Using the estimated time-series regression,predicted price in the 1st quarter of 2014 is
A)$53.60.
B)$45.60.
C)$56.00.
D)$37.60.
E)none of the above
to forecast doll prices in the year 2014. is the quarterly price of dolls,and and are dummy variables for quarters I,II,and III,respectively. Using the estimated time-series regression,predicted price in the 1st quarter of 2014 isA)$53.60.
B)$45.60.
C)$56.00.
D)$37.60.
E)none of the above
سؤال
The manufacturer of Beanie Baby dolls used quarterly price data for 2005I - 2013IV t = 1,...,36)and the regression equation  to forecast doll prices in the year 2014.
  is the quarterly price of dolls,and
  and
and  are dummy variables for quarters I,II,and III,respectively.
  At the 2 percent level of statistical significance,the estimation results indicate that price in the ________ quarter is significantly higher than in any other quarter.
A)1st
B)2nd
C)3rd
D)4th
to forecast doll prices in the year 2014. is the quarterly price of dolls,and and are dummy variables for quarters I,II,and III,respectively. At the 2 percent level of statistical significance,the estimation results indicate that price in the ________ quarter is significantly higher than in any other quarter.A)1st
B)2nd
C)3rd
D)4th

فتح الحزمة
قم بالتسجيل لفتح البطاقات في هذه المجموعة!
Unlock Deck
Unlock Deck
1/65
العب
ملء الشاشة (f)
Deck 7: Demand Estimation and Forecasting
1
a.complements since the coefficient on M is positive.
b.substitutes since the coefficient on M is positive.
c.complements since the coefficient on is positive.
d.substitutes since the coefficient on is positive.
The estimated demand for a good is where Q is the quantity demanded of the good,P is the price of the good,M is income,and is the price of related good R.This good and good R are
A)complements since the coefficient on M is negative.
B)substitutes since the coefficient on M is negative.
C)complements since the coefficient on is negative.
D)substitutes since the coefficient on is negative.
E)none of the above
b.substitutes since the coefficient on M is positive.
c.complements since the coefficient on
is positive.d.substitutes since the coefficient on
is positive.The estimated demand for a good is
where Q is the quantity demanded of the good,P is the price of the good,M is income,and is the price of related good R.This good and good R areA)complements since the coefficient on M is negative.
B)substitutes since the coefficient on M is negative.
C)complements since the coefficient on
is negative.D)substitutes since the coefficient on
is negative.E)none of the above
C
2
problem with consumer interviews is that
A)the sample may not be a representative sample.
B)response bias.
C)interviews allow for rapid turnaround.
D)both a and b
E)all of the above
A)the sample may not be a representative sample.
B)response bias.
C)interviews allow for rapid turnaround.
D)both a and b
E)all of the above
D
3
If demand is estimated using the empirical specification ,then an equivalent expression for demand is
A) .
B) .
C) .
D) .
E)none of the above
,then an equivalent expression for demand isA)
.B)
.C)
.D)
.E)none of the above
E
4
estimated demand for a good is where Q is the quantity demanded of the good,P is the price of the good,M is income,and is the price of related good R.The coefficient on P
A)does not have the expected sign.
B)is negative as expected.
C)should have the same sign as the coefficient on .
D)should not be greater than one in absolute value).
E)both b and d
where Q is the quantity demanded of the good,P is the price of the good,M is income,and is the price of related good R.The coefficient on PA)does not have the expected sign.
B)is negative as expected.
C)should have the same sign as the coefficient on
.D)should not be greater than one in absolute value).
E)both b and d
فتح الحزمة
افتح القفل للوصول البطاقات البالغ عددها 65 في هذه المجموعة.
فتح الحزمة
k this deck
5
a.complements since the coefficient on M is positive.
b.substitutes since the coefficient on M is positive.
c.complements since the coefficient on is positive.
d.substitutes since the coefficient on is positive.
estimated demand for a good is where Q is the quantity demanded of the good,P is the price of the good,M is income,and is the price of related good R.The coefficient on P
A)violates the law of demand.
B)is negative as dictated by the law of demand.
C)should not be greater than one in absolute value).
D)should have the same sign as the coefficient on .
E)both c and d
b.substitutes since the coefficient on M is positive.
c.complements since the coefficient on
is positive.d.substitutes since the coefficient on
is positive.estimated demand for a good is
where Q is the quantity demanded of the good,P is the price of the good,M is income,and is the price of related good R.The coefficient on PA)violates the law of demand.
B)is negative as dictated by the law of demand.
C)should not be greater than one in absolute value).
D)should have the same sign as the coefficient on
.E)both c and d
فتح الحزمة
افتح القفل للوصول البطاقات البالغ عددها 65 في هذه المجموعة.
فتح الحزمة
k this deck
6
a.complements since the coefficient on M is positive.
b.substitutes since the coefficient on M is positive.
c.complements since the coefficient on is positive.
d.substitutes since the coefficient on is positive.
The estimated demand for a good is where Q is the quantity demanded of the good,P is the price of the good,M is income,and is the price of related good R.If the price of the good rises by $10,all else constant,the quantity demanded will ________ by ________ units.
A)increase; 16 units
B)decrease; 160 units
C)decrease; 1.5 units
D)increase; 150 units
b.substitutes since the coefficient on M is positive.
c.complements since the coefficient on
is positive.d.substitutes since the coefficient on
is positive.The estimated demand for a good is
where Q is the quantity demanded of the good,P is the price of the good,M is income,and is the price of related good R.If the price of the good rises by $10,all else constant,the quantity demanded will ________ by ________ units.A)increase; 16 units
B)decrease; 160 units
C)decrease; 1.5 units
D)increase; 150 units
فتح الحزمة
افتح القفل للوصول البطاقات البالغ عددها 65 في هذه المجموعة.
فتح الحزمة
k this deck
7
Build-Right Concrete Products produces specialty cement used in construction of highways.Build-Right is a price-setting firm and estimates the demand for its cement by the State Highway Department using a demand function in the nonlinear form: where Q = yards of cement demanded monthly,P = the price of Build-Right's cement per yard,M = state tax revenues per capita,and = the price of asphalt per yard.The manager at Build-Right transforms the nonlinear relation into a linear relation for estimation.The estimation results are presented below: Given the above,the estimated demand for cement is
A)elastic because = -4.0.
B)elastic because = -2.0.
C)elastic because = -1.5.
D)inelastic because = -0.32.
E)inelastic because = -0.8.
where Q = yards of cement demanded monthly,P = the price of Build-Right's cement per yard,M = state tax revenues per capita,and = the price of asphalt per yard.The manager at Build-Right transforms the nonlinear relation into a linear relation for estimation.The estimation results are presented below: Given the above,the estimated demand for cement isA)elastic because
= -4.0.B)elastic because
= -2.0.C)elastic because
= -1.5.D)inelastic because
= -0.32.E)inelastic because
= -0.8. فتح الحزمة
افتح القفل للوصول البطاقات البالغ عددها 65 في هذه المجموعة.
فتح الحزمة
k this deck
8
a.complements since the coefficient on M is positive.
b.substitutes since the coefficient on M is positive.
c.complements since the coefficient on is positive.
d.substitutes since the coefficient on is positive.
estimated demand for a good is where Q is the quantity demanded of the good,P is the price of the good,M is income,and is the price of related good R.If income decreases by $1,000,all else constant,quantity demanded will ________ by _________ units.
A)decrease; 320 units
B)increase; 3.2 units
C)decrease; 1200 units
D)increase; 500 units
E)decrease; 500 units
b.substitutes since the coefficient on M is positive.
c.complements since the coefficient on
is positive.d.substitutes since the coefficient on
is positive.estimated demand for a good is
where Q is the quantity demanded of the good,P is the price of the good,M is income,and is the price of related good R.If income decreases by $1,000,all else constant,quantity demanded will ________ by _________ units.A)decrease; 320 units
B)increase; 3.2 units
C)decrease; 1200 units
D)increase; 500 units
E)decrease; 500 units
فتح الحزمة
افتح القفل للوصول البطاقات البالغ عددها 65 في هذه المجموعة.
فتح الحزمة
k this deck
9
Build-Right Concrete Products produces specialty cement used in construction of highways.Build-Right is a price-setting firm and estimates the demand for its cement by the State Highway Department using a demand function in the nonlinear form: where Q = yards of cement demanded monthly,P = the price of Build-Right's cement per yard,M = state tax revenues per capita,and = the price of asphalt per yard.The manager at Build-Right transforms the nonlinear relation into a linear relation for estimation.The estimation results are presented below: Given the above,the estimated cross-price elasticity of demand for cement relative to the price of asphalt is
A)0.3
B)0.6
C)1.2
D)3.0
E)none of the above
where Q = yards of cement demanded monthly,P = the price of Build-Right's cement per yard,M = state tax revenues per capita,and = the price of asphalt per yard.The manager at Build-Right transforms the nonlinear relation into a linear relation for estimation.The estimation results are presented below: Given the above,the estimated cross-price elasticity of demand for cement relative to the price of asphalt isA)0.3
B)0.6
C)1.2
D)3.0
E)none of the above
فتح الحزمة
افتح القفل للوصول البطاقات البالغ عددها 65 في هذه المجموعة.
فتح الحزمة
k this deck
10
a.complements since the coefficient on M is positive.
b.substitutes since the coefficient on M is positive.
c.complements since the coefficient on is positive.
d.substitutes since the coefficient on is positive.
The estimated demand for a good is where Q is the quantity demanded of the good,P is the price of the good,M is income,and is the price of related good R.The good is
A)an inferior good since the coefficient on is negative.
B)a normal good since the coefficient on is negative.
C)a normal good since the coefficient on M is greater than one in absolute value).
D)an inferior good since the coefficient on M is negative.
E)none of the above
b.substitutes since the coefficient on M is positive.
c.complements since the coefficient on
is positive.d.substitutes since the coefficient on
is positive.The estimated demand for a good is
where Q is the quantity demanded of the good,P is the price of the good,M is income,and is the price of related good R.The good isA)an inferior good since the coefficient on
is negative.B)a normal good since the coefficient on
is negative.C)a normal good since the coefficient on M is greater than one in absolute value).
D)an inferior good since the coefficient on M is negative.
E)none of the above
فتح الحزمة
افتح القفل للوصول البطاقات البالغ عددها 65 في هذه المجموعة.
فتح الحزمة
k this deck
11
Possible problems with consumer interviews include:
A)a non-random sample
B)the identification problem
C)response bias
D)both a and b
E)both a and c
A)a non-random sample
B)the identification problem
C)response bias
D)both a and b
E)both a and c
فتح الحزمة
افتح القفل للوصول البطاقات البالغ عددها 65 في هذه المجموعة.
فتح الحزمة
k this deck
12
estimated demand for a good is where Q is the quantity demanded of the good,P is the price of the good,M is income,and is the price of related good R.The good is
A)an inferior good since the coefficient on is positive.
B)a normal good since the coefficient on is positive.
C)an inferior good since the coefficient on M is greater than one.
D)a normal good since the coefficient on M is positive.
E)none of the above
where Q is the quantity demanded of the good,P is the price of the good,M is income,and is the price of related good R.The good isA)an inferior good since the coefficient on
is positive.B)a normal good since the coefficient on
is positive.C)an inferior good since the coefficient on M is greater than one.
D)a normal good since the coefficient on M is positive.
E)none of the above
فتح الحزمة
افتح القفل للوصول البطاقات البالغ عددها 65 في هذه المجموعة.
فتح الحزمة
k this deck
13
estimated demand for a good is where Q is the quantity demanded of the good,P is the price of the good,M is income,and is the price of related good R.This good and the related good R are
where Q is the quantity demanded of the good,P is the price of the good,M is income,and is the price of related good R.This good and the related good R are فتح الحزمة
افتح القفل للوصول البطاقات البالغ عددها 65 في هذه المجموعة.
فتح الحزمة
k this deck
14
Demand equations derived from actual market data are
A)empirical demand functions.
B)never estimated using consumer interviews.
C)generally estimated using regression analysis.
D)both a and c
E)all of the above
A)empirical demand functions.
B)never estimated using consumer interviews.
C)generally estimated using regression analysis.
D)both a and c
E)all of the above
فتح الحزمة
افتح القفل للوصول البطاقات البالغ عددها 65 في هذه المجموعة.
فتح الحزمة
k this deck
15
Build-Right Concrete Products produces specialty cement used in construction of highways.Build-Right is a price-setting firm and estimates the demand for its cement by the State Highway Department using a demand function in the nonlinear form: where Q = yards of cement demanded monthly,P = the price of Build-Right's cement per yard,M = state tax revenues per capita,and = the price of asphalt per yard.The manager at Build-Right transforms the nonlinear relation into a linear relation for estimation.The estimation results are presented below: Given the above,if the price of asphalt )decreases 20%,the estimated quantity of cement demanded will:
A)increase 12%
B)increase 6%
C)increase 1.2%
D)decrease 12%.
E)decrease 1.2%.
where Q = yards of cement demanded monthly,P = the price of Build-Right's cement per yard,M = state tax revenues per capita,and = the price of asphalt per yard.The manager at Build-Right transforms the nonlinear relation into a linear relation for estimation.The estimation results are presented below: Given the above,if the price of asphalt )decreases 20%,the estimated quantity of cement demanded will:A)increase 12%
B)increase 6%
C)increase 1.2%
D)decrease 12%.
E)decrease 1.2%.
فتح الحزمة
افتح القفل للوصول البطاقات البالغ عددها 65 في هذه المجموعة.
فتح الحزمة
k this deck
16
representative sample
A)eliminates the problem of response bias.
B)reflects the characteristics of the population.
C)is frequently a random sample.
D)both b and c
E)all of the above
A)eliminates the problem of response bias.
B)reflects the characteristics of the population.
C)is frequently a random sample.
D)both b and c
E)all of the above
فتح الحزمة
افتح القفل للوصول البطاقات البالغ عددها 65 في هذه المجموعة.
فتح الحزمة
k this deck
17
a.complements since the coefficient on M is positive.
b.substitutes since the coefficient on M is positive.
c.complements since the coefficient on is positive.
d.substitutes since the coefficient on is positive.
estimated demand for a good is where Q is the quantity demanded of the good,P is the price of the good,M is income,and is the price of related good R.If the price of the good falls by $4,the quantity demanded will ________ by ________ units.
A)increase; 5 units
B)increase; 20 units
C)increase; 50 units
D)increase; 48 units
E)decrease; 12 units
b.substitutes since the coefficient on M is positive.
c.complements since the coefficient on
is positive.d.substitutes since the coefficient on
is positive.estimated demand for a good is
where Q is the quantity demanded of the good,P is the price of the good,M is income,and is the price of related good R.If the price of the good falls by $4,the quantity demanded will ________ by ________ units.A)increase; 5 units
B)increase; 20 units
C)increase; 50 units
D)increase; 48 units
E)decrease; 12 units
فتح الحزمة
افتح القفل للوصول البطاقات البالغ عددها 65 في هذه المجموعة.
فتح الحزمة
k this deck
18
a.complements since the coefficient on M is positive.
b.substitutes since the coefficient on M is positive.
c.complements since the coefficient on is positive.
d.substitutes since the coefficient on is positive.
The estimated demand for a good is where Q is the quantity demanded of the good,P is the price of the good,M is income,and is the price of related good R.If income decreases by $2,000,all else constant,quantity demanded will ________ by _________ units.
A)increase; 1.30 units
B)decrease; 6.5 units
C)increase; 1,300 units
D)decrease; 65 units
b.substitutes since the coefficient on M is positive.
c.complements since the coefficient on
is positive.d.substitutes since the coefficient on
is positive.The estimated demand for a good is
where Q is the quantity demanded of the good,P is the price of the good,M is income,and is the price of related good R.If income decreases by $2,000,all else constant,quantity demanded will ________ by _________ units.A)increase; 1.30 units
B)decrease; 6.5 units
C)increase; 1,300 units
D)decrease; 65 units
فتح الحزمة
افتح القفل للوصول البطاقات البالغ عددها 65 في هذه المجموعة.
فتح الحزمة
k this deck
19
Build-Right Concrete Products produces specialty cement used in construction of highways.Build-Right is a price-setting firm and estimates the demand for its cement by the State Highway Department using a demand function in the nonlinear form: where Q = yards of cement demanded monthly,P = the price of Build-Right's cement per yard,M = state tax revenues per capita,and = the price of asphalt per yard.The manager at Build-Right transforms the nonlinear relation into a linear relation for estimation.The estimation results are presented below: Given the above,if tax revenue per capita M)increases 5%,the estimated quantity of cement demanded will
A)increase by less than 1%.
B)increase more than 1% but less than 5%.
C)increase more than 5% but less than 10%.
D)increase more than 10%.
where Q = yards of cement demanded monthly,P = the price of Build-Right's cement per yard,M = state tax revenues per capita,and = the price of asphalt per yard.The manager at Build-Right transforms the nonlinear relation into a linear relation for estimation.The estimation results are presented below: Given the above,if tax revenue per capita M)increases 5%,the estimated quantity of cement demanded willA)increase by less than 1%.
B)increase more than 1% but less than 5%.
C)increase more than 5% but less than 10%.
D)increase more than 10%.
فتح الحزمة
افتح القفل للوصول البطاقات البالغ عددها 65 في هذه المجموعة.
فتح الحزمة
k this deck
20
Build-Right Concrete Products produces specialty cement used in construction of highways.Build-Right is a price-setting firm and estimates the demand for its cement by the State Highway Department using a demand function in the nonlinear form: where Q = yards of cement demanded monthly,P = the price of Build-Right's cement per yard,M = state tax revenues per capita,and = the price of asphalt per yard.The manager at Build-Right transforms the nonlinear relation into a linear relation for estimation.The estimation results are presented below: Given the above,at the 1 percent level of significance,the number of degrees of freedom for a t-test is _____,and the critical value of the t-statistic is ________.0Only parameter estimates)________ is are)NOT statistically significant at the 1 percent level of significance.
A)30; 2.457;
B)30; 2.750;
C)34; 2.042;
D)34; 2.042, and
where Q = yards of cement demanded monthly,P = the price of Build-Right's cement per yard,M = state tax revenues per capita,and = the price of asphalt per yard.The manager at Build-Right transforms the nonlinear relation into a linear relation for estimation.The estimation results are presented below: Given the above,at the 1 percent level of significance,the number of degrees of freedom for a t-test is _____,and the critical value of the t-statistic is ________.0Only parameter estimates)________ is are)NOT statistically significant at the 1 percent level of significance.A)30; 2.457;
B)30; 2.750;
C)34; 2.042;
D)34; 2.042,
and فتح الحزمة
افتح القفل للوصول البطاقات البالغ عددها 65 في هذه المجموعة.
فتح الحزمة
k this deck
21
The following linear demand specification is estimated for Conlan Enterprises,a price-setting firm: where Q is the quantity demanded of the product Conlan Enterprises sells,P is the price of that product,M is income,and is the price of a related product.The results of the estimation are presented below: For the next 2 questions suppose income remains at $10,000 but the price of the related good increases to $60 and Conlan decides to raise the price of its product to $50.What is the new own price elasticity of demand?
A)-0.24
B)-0.43
C)-0.87
D)-1.00
E)-1.26
where Q is the quantity demanded of the product Conlan Enterprises sells,P is the price of that product,M is income,and is the price of a related product.The results of the estimation are presented below: For the next 2 questions suppose income remains at $10,000 but the price of the related good increases to $60 and Conlan decides to raise the price of its product to $50.What is the new own price elasticity of demand?A)-0.24
B)-0.43
C)-0.87
D)-1.00
E)-1.26
فتح الحزمة
افتح القفل للوصول البطاقات البالغ عددها 65 في هذه المجموعة.
فتح الحزمة
k this deck
22
A market-determined price
A)is determined by the manager of a firm.
B)is determined by the intersection of demand and supply curves.
C)is an endogenous variable
D)both a and b
E)both b and c
A)is determined by the manager of a firm.
B)is determined by the intersection of demand and supply curves.
C)is an endogenous variable
D)both a and b
E)both b and c
فتح الحزمة
افتح القفل للوصول البطاقات البالغ عددها 65 في هذه المجموعة.
فتح الحزمة
k this deck
23
Seasonal or cyclical variation in a time series model
A)is regular in nature and can be accounted for by dummy variables.
B)can decrease the accuracy of a forecast if not accounted for by dummy variables.
C)exhibits irregular variation that can be accounted for by dummy variables.
D)both a and b
E)both b and c
A)is regular in nature and can be accounted for by dummy variables.
B)can decrease the accuracy of a forecast if not accounted for by dummy variables.
C)exhibits irregular variation that can be accounted for by dummy variables.
D)both a and b
E)both b and c
فتح الحزمة
افتح القفل للوصول البطاقات البالغ عددها 65 في هذه المجموعة.
فتح الحزمة
k this deck
24
The estimated demand for a good X is ,where = units of the good,P = price of the good,M = income,and = price of related good Z.All parameter estimates are statistically significant.Which of the following statements is correct?
A)X is a normal good.
B)X is an inferior good.
C)X and Z are substitutes.
D)X and Z are complements.
E)both b and c
,where = units of the good,P = price of the good,M = income,and = price of related good Z.All parameter estimates are statistically significant.Which of the following statements is correct?A)X is a normal good.
B)X is an inferior good.
C)X and Z are substitutes.
D)X and Z are complements.
E)both b and c
فتح الحزمة
افتح القفل للوصول البطاقات البالغ عددها 65 في هذه المجموعة.
فتح الحزمة
k this deck
25
Time-series models
A)cannot be replicated by another researcher.
B)use dummy variables to control for cyclical variation.
C)use dummy variables to control for time trend.
D)both a and b
E)both b and c
A)cannot be replicated by another researcher.
B)use dummy variables to control for cyclical variation.
C)use dummy variables to control for time trend.
D)both a and b
E)both b and c
فتح الحزمة
افتح القفل للوصول البطاقات البالغ عددها 65 في هذه المجموعة.
فتح الحزمة
k this deck
26
The following linear demand specification is estimated for Conlan Enterprises,a price-setting firm: where Q is the quantity demanded of the product Conlan Enterprises sells,P is the price of that product,M is income,and is the price of a related product.The results of the estimation are presented below: Assume that the income is $10,000,the price of the related good is $40,and Conlan chooses to set the price of this product at $30.At the prices and income given above,what is the price elasticity of demand?
A)-0.43
B)-0.86
C)-1.00
D)-1.43
E)-2.40
where Q is the quantity demanded of the product Conlan Enterprises sells,P is the price of that product,M is income,and is the price of a related product.The results of the estimation are presented below: Assume that the income is $10,000,the price of the related good is $40,and Conlan chooses to set the price of this product at $30.At the prices and income given above,what is the price elasticity of demand?A)-0.43
B)-0.86
C)-1.00
D)-1.43
E)-2.40
فتح الحزمة
افتح القفل للوصول البطاقات البالغ عددها 65 في هذه المجموعة.
فتح الحزمة
k this deck
27
Build-Right Concrete Products produces specialty cement used in construction of highways.Build-Right is a price-setting firm and estimates the demand for its cement by the State Highway Department using a demand function in the nonlinear form: where Q = yards of cement demanded monthly,P = the price of Build-Right's cement per yard,M = state tax revenues per capita,and = the price of asphalt per yard.The manager at Build-Right transforms the nonlinear relation into a linear relation for estimation.The estimation results are presented below: Given the above,if Build-Right decides to charge the State Highway Department $55 per yard for its cement when tax revenues per capita are $3,200 and the price of asphalt is $35 per yard,the expected quantity demanded is
A)1,000 yards of cement.
B)2,000 yards of cement.
C)4,000 yards of cement.
D)6,000 yards of cement.
E)8,000 yards of cement.
where Q = yards of cement demanded monthly,P = the price of Build-Right's cement per yard,M = state tax revenues per capita,and = the price of asphalt per yard.The manager at Build-Right transforms the nonlinear relation into a linear relation for estimation.The estimation results are presented below: Given the above,if Build-Right decides to charge the State Highway Department $55 per yard for its cement when tax revenues per capita are $3,200 and the price of asphalt is $35 per yard,the expected quantity demanded isA)1,000 yards of cement.
B)2,000 yards of cement.
C)4,000 yards of cement.
D)6,000 yards of cement.
E)8,000 yards of cement.
فتح الحزمة
افتح القفل للوصول البطاقات البالغ عددها 65 في هذه المجموعة.
فتح الحزمة
k this deck
28
Time-series data
A)show the behavior of a particular variable over time.
B)may exhibit trend or cyclical variation,but not both at the same time.
C)may exhibit trend and cyclical variation at the same time.
D)both a and b
E)both a and c
A)show the behavior of a particular variable over time.
B)may exhibit trend or cyclical variation,but not both at the same time.
C)may exhibit trend and cyclical variation at the same time.
D)both a and b
E)both a and c
فتح الحزمة
افتح القفل للوصول البطاقات البالغ عددها 65 في هذه المجموعة.
فتح الحزمة
k this deck
29
The following linear demand specification is estimated for Conlan Enterprises,a price-setting firm: where Q is the quantity demanded of the product Conlan Enterprises sells,P is the price of that product,M is income,and is the price of a related product.The results of the estimation are presented below: Given the above,based upon the parameter estimates in the above table
A)this good is a normal good.
B)the related good is a substitute.
C)the related good is a complement.
D)a and b
E)a and c
where Q is the quantity demanded of the product Conlan Enterprises sells,P is the price of that product,M is income,and is the price of a related product.The results of the estimation are presented below: Given the above,based upon the parameter estimates in the above tableA)this good is a normal good.
B)the related good is a substitute.
C)the related good is a complement.
D)a and b
E)a and c
فتح الحزمة
افتح القفل للوصول البطاقات البالغ عددها 65 في هذه المجموعة.
فتح الحزمة
k this deck
30
A consulting firm estimates the following quarterly sales forecasting model: The equation is estimated using quarterly data from 2005I-2015III t = 1,...,43).The variable D is a dummy variable for the second quarter where: D = 1 in the second quarter,and 0 otherwise.
The results of the estimation are:
Given the above,these estimates indicate that the second quarter change in sales is
A)22.5 units higher in the second quarter than in the other three quarters.
B)1.86 units higher in the second quarter than in the other three quarters.
C)2.00 units higher in the second quarter than in the other three quarters.
D)24.5 units higher in the second quarter than in the other three quarters.
The equation is estimated using quarterly data from 2005I-2015III t = 1,...,43).The variable D is a dummy variable for the second quarter where: D = 1 in the second quarter,and 0 otherwise.The results of the estimation are:
Given the above,these estimates indicate that the second quarter change in sales isA)22.5 units higher in the second quarter than in the other three quarters.
B)1.86 units higher in the second quarter than in the other three quarters.
C)2.00 units higher in the second quarter than in the other three quarters.
D)24.5 units higher in the second quarter than in the other three quarters.
فتح الحزمة
افتح القفل للوصول البطاقات البالغ عددها 65 في هذه المجموعة.
فتح الحزمة
k this deck
31
The following linear demand specification is estimated for Conlan Enterprises,a price-setting firm: where Q is the quantity demanded of the product Conlan Enterprises sells,P is the price of that product,M is income,and is the price of a related product.The results of the estimation are presented below: Given the above,at the 1% level of significance,the critical value of the t-statistic used by Conlan to test for statistical significance has _____ degrees of freedom and is equal to ________.
A)32; 0.7984
B)32; 36.14
C)32; 4.57
D)30; 2.750
E)28; 2.763
where Q is the quantity demanded of the product Conlan Enterprises sells,P is the price of that product,M is income,and is the price of a related product.The results of the estimation are presented below: Given the above,at the 1% level of significance,the critical value of the t-statistic used by Conlan to test for statistical significance has _____ degrees of freedom and is equal to ________.A)32; 0.7984
B)32; 36.14
C)32; 4.57
D)30; 2.750
E)28; 2.763
فتح الحزمة
افتح القفل للوصول البطاقات البالغ عددها 65 في هذه المجموعة.
فتح الحزمة
k this deck
32
Qualitative forecasting methods
A)use higher quality data than statistical methods.
B)are often the result of expert opinion.
C)cannot be replicated by another researcher.
D)both b and c
E)all of the above
A)use higher quality data than statistical methods.
B)are often the result of expert opinion.
C)cannot be replicated by another researcher.
D)both b and c
E)all of the above
فتح الحزمة
افتح القفل للوصول البطاقات البالغ عددها 65 في هذه المجموعة.
فتح الحزمة
k this deck
33
Dummy variables are used in time-series forecasting models
A)to change the intercept of a regression in selected periods.
B)to account for random variation in the data.
C)to account for seasonal variation in the data.
D)both a and b
E)both a and c
A)to change the intercept of a regression in selected periods.
B)to account for random variation in the data.
C)to account for seasonal variation in the data.
D)both a and b
E)both a and c
فتح الحزمة
افتح القفل للوصول البطاقات البالغ عددها 65 في هذه المجموعة.
فتح الحزمة
k this deck
34
The following linear demand specification is estimated for Conlan Enterprises,a price-setting firm: where Q is the quantity demanded of the product Conlan Enterprises sells,P is the price of that product,M is income,and is the price of a related product.The results of the estimation are presented below: For the next 2 questions suppose income remains at $10,000 but the price of the related good increases to $60 and Conlan decides to raise the price of its product to $50.At the prices and income given above,Conlan can expect to sell _________units.
A)342
B)600
C)724
D)864
E)872
where Q is the quantity demanded of the product Conlan Enterprises sells,P is the price of that product,M is income,and is the price of a related product.The results of the estimation are presented below: For the next 2 questions suppose income remains at $10,000 but the price of the related good increases to $60 and Conlan decides to raise the price of its product to $50.At the prices and income given above,Conlan can expect to sell _________units.A)342
B)600
C)724
D)864
E)872
فتح الحزمة
افتح القفل للوصول البطاقات البالغ عددها 65 في هذه المجموعة.
فتح الحزمة
k this deck
35
The following linear demand specification is estimated for Conlan Enterprises,a price-setting firm: where Q is the quantity demanded of the product Conlan Enterprises sells,P is the price of that product,M is income,and is the price of a related product.The results of the estimation are presented below: Given the above,at the 1% level of significance,which estimates are statistically significant?
A)All are statistically significant
B)All but are statistically significant
C)Only are statistically significant
D)Only is statistically significant
E)All but are statistically significant
where Q is the quantity demanded of the product Conlan Enterprises sells,P is the price of that product,M is income,and is the price of a related product.The results of the estimation are presented below: Given the above,at the 1% level of significance,which estimates are statistically significant?A)All are statistically significant
B)All but
are statistically significantC)Only
are statistically significantD)Only
is statistically significantE)All but
are statistically significant فتح الحزمة
افتح القفل للوصول البطاقات البالغ عددها 65 في هذه المجموعة.
فتح الحزمة
k this deck
36
Manager-determined prices are
A)not determined by the forces of demand and supply.
B)exogenous variables in a demand equations.
C)associated with price-taking firms.
D)both a and b
E)both b and c
A)not determined by the forces of demand and supply.
B)exogenous variables in a demand equations.
C)associated with price-taking firms.
D)both a and b
E)both b and c
فتح الحزمة
افتح القفل للوصول البطاقات البالغ عددها 65 في هذه المجموعة.
فتح الحزمة
k this deck
37
A consulting firm estimates the following quarterly sales forecasting model: The equation is estimated using quarterly data from 2005I-2015III t = 1,...,43).The variable D is a dummy variable for the second quarter where: D = 1 in the second quarter,and 0 otherwise.
The results of the estimation are:
Given the above,at the 1 percent level of significance,is there a statistically significant trend in sales?
A)Yes,because 0.0016 < 0.01.
B)No,because 0.0016 < 0.01.
C)Yes,because 0.55 > 0.01.
D)Yes,because 1.86 > 0.01.
E)both c and d
The equation is estimated using quarterly data from 2005I-2015III t = 1,...,43).The variable D is a dummy variable for the second quarter where: D = 1 in the second quarter,and 0 otherwise.The results of the estimation are:
Given the above,at the 1 percent level of significance,is there a statistically significant trend in sales?A)Yes,because 0.0016 < 0.01.
B)No,because 0.0016 < 0.01.
C)Yes,because 0.55 > 0.01.
D)Yes,because 1.86 > 0.01.
E)both c and d
فتح الحزمة
افتح القفل للوصول البطاقات البالغ عددها 65 في هذه المجموعة.
فتح الحزمة
k this deck
38
The following linear demand specification is estimated for Conlan Enterprises,a price-setting firm: where Q is the quantity demanded of the product Conlan Enterprises sells,P is the price of that product,M is income,and is the price of a related product.The results of the estimation are presented below: Assume that the income is $10,000,the price of the related good is $40,and Conlan chooses to set the price of this product at $30.At the prices and income given above,what is the income elasticity?
A)-1.62
B)-0.87
C)0.21
D)0.31
E)1.50
where Q is the quantity demanded of the product Conlan Enterprises sells,P is the price of that product,M is income,and is the price of a related product.The results of the estimation are presented below: Assume that the income is $10,000,the price of the related good is $40,and Conlan chooses to set the price of this product at $30.At the prices and income given above,what is the income elasticity?A)-1.62
B)-0.87
C)0.21
D)0.31
E)1.50
فتح الحزمة
افتح القفل للوصول البطاقات البالغ عددها 65 في هذه المجموعة.
فتح الحزمة
k this deck
39
A consulting firm estimates the following quarterly sales forecasting model: The equation is estimated using quarterly data from 2005I-2015III t = 1,...,43).The variable D is a dummy variable for the second quarter where: D = 1 in the second quarter,and 0 otherwise.
The results of the estimation are:
Give the above,at the 1 percent level of significance,is there a statistically significant trend in sales?
A)No,since 1.86 < 2.704
B)No,since 0.55 < 1.86
C)No,since 1.02 < 2.704
D)Yes,since 1.86 > 0.55
E)Yes,since 3.38 > 2.704
The equation is estimated using quarterly data from 2005I-2015III t = 1,...,43).The variable D is a dummy variable for the second quarter where: D = 1 in the second quarter,and 0 otherwise.The results of the estimation are:
Give the above,at the 1 percent level of significance,is there a statistically significant trend in sales?A)No,since 1.86 < 2.704
B)No,since 0.55 < 1.86
C)No,since 1.02 < 2.704
D)Yes,since 1.86 > 0.55
E)Yes,since 3.38 > 2.704
فتح الحزمة
افتح القفل للوصول البطاقات البالغ عددها 65 في هذه المجموعة.
فتح الحزمة
k this deck
40
The following linear demand specification is estimated for Conlan Enterprises,a price-setting firm: where Q is the quantity demanded of the product Conlan Enterprises sells,P is the price of that product,M is income,and is the price of a related product.The results of the estimation are presented below: Assume that the income is $10,000,the price of the related good is $40,and Conlan chooses to set the price of this product at $30.At the prices and income given above,Conlan can expect to sell _________units.
A)342
B)600
C)724
D)864
E)872
where Q is the quantity demanded of the product Conlan Enterprises sells,P is the price of that product,M is income,and is the price of a related product.The results of the estimation are presented below: Assume that the income is $10,000,the price of the related good is $40,and Conlan chooses to set the price of this product at $30.At the prices and income given above,Conlan can expect to sell _________units.A)342
B)600
C)724
D)864
E)872
فتح الحزمة
افتح القفل للوصول البطاقات البالغ عددها 65 في هذه المجموعة.
فتح الحزمة
k this deck
41
Problems in forecasting include:
A)estimates becoming more reliable the further you forecast into the future
B)specification error
C)cyclical variation
D)both b and c
E)all of the above
A)estimates becoming more reliable the further you forecast into the future
B)specification error
C)cyclical variation
D)both b and c
E)all of the above
فتح الحزمة
افتح القفل للوصول البطاقات البالغ عددها 65 في هذه المجموعة.
فتح الحزمة
k this deck
42
A consulting firm estimates the following quarterly sales forecasting model: The equation is estimated using quarterly data from 2005I-2015III t = 1,...,43).The variable D is a dummy variable for the second quarter where: D = 1 in the second quarter,and 0 otherwise.
The results of the estimation are:
Using the estimated trend line above,what is the predicted level of sales in 2016I ?
A)110.06
B)106.20
C)104.34
D)102.2
E)none of the above
The equation is estimated using quarterly data from 2005I-2015III t = 1,...,43).The variable D is a dummy variable for the second quarter where: D = 1 in the second quarter,and 0 otherwise.The results of the estimation are:
Using the estimated trend line above,what is the predicted level of sales in 2016I ?A)110.06
B)106.20
C)104.34
D)102.2
E)none of the above
فتح الحزمة
افتح القفل للوصول البطاقات البالغ عددها 65 في هذه المجموعة.
فتح الحزمة
k this deck
43
A consulting firm estimates the following quarterly sales forecasting model: The equation is estimated using quarterly data from 2005I-2015III t = 1,...,43).The variable D is a dummy variable for the second quarter where: D = 1 in the second quarter,and 0 otherwise.
The results of the estimation are:
Given the above,what is the estimated intercept of the trend line in the second quarter?
A)22.50
B)24.50
C)24.36
D)2.00
E)none of the above
The equation is estimated using quarterly data from 2005I-2015III t = 1,...,43).The variable D is a dummy variable for the second quarter where: D = 1 in the second quarter,and 0 otherwise.The results of the estimation are:
Given the above,what is the estimated intercept of the trend line in the second quarter?A)22.50
B)24.50
C)24.36
D)2.00
E)none of the above
فتح الحزمة
افتح القفل للوصول البطاقات البالغ عددها 65 في هذه المجموعة.
فتح الحزمة
k this deck
44
A consulting firm estimates the following quarterly sales forecasting model: The equation is estimated using quarterly data from 2005I-2015III t = 1,...,43).The variable D is a dummy variable for the second quarter where: D = 1 in the second quarter,and 0 otherwise.
The results of the estimation are:
Using the estimated trend line above,what is the predicted level of sales in 2015IV ?
A)110.06
B)106.20
C)104.34
D)102.2
E)none of the above
The equation is estimated using quarterly data from 2005I-2015III t = 1,...,43).The variable D is a dummy variable for the second quarter where: D = 1 in the second quarter,and 0 otherwise.The results of the estimation are:
Using the estimated trend line above,what is the predicted level of sales in 2015IV ?A)110.06
B)106.20
C)104.34
D)102.2
E)none of the above
فتح الحزمة
افتح القفل للوصول البطاقات البالغ عددها 65 في هذه المجموعة.
فتح الحزمة
k this deck
45
A forecaster used the regression equation and quarterly sales data for 1996I-2013IV t = 1,...,64)for an appliance manufacturer to obtain the results shown below.Q is quarterly sales,and and are dummy variables for quarters I,II,and III. Using the estimation results given above,the predicted level of sales in 2014IV is _______ units.
A)125
B)127.50
C)132
D)133.5
E)none of the above
and quarterly sales data for 1996I-2013IV t = 1,...,64)for an appliance manufacturer to obtain the results shown below.Q is quarterly sales,and and are dummy variables for quarters I,II,and III. Using the estimation results given above,the predicted level of sales in 2014IV is _______ units.A)125
B)127.50
C)132
D)133.5
E)none of the above
فتح الحزمة
افتح القفل للوصول البطاقات البالغ عددها 65 في هذه المجموعة.
فتح الحزمة
k this deck
46
A forecaster used the regression equation and quarterly sales data for 1996I-2013IV t = 1,...,64)for an appliance manufacturer to obtain the results shown below.Q is quarterly sales,and and are dummy variables for quarters I,II,and III. At the 5 percent level of significance,is there a statistically significant trend in sales?
A)Yes,because 0.0362 < 0.05.
B)No,because 0.0362 > 0.01.
C)Yes,because 0.700 > 0.05.
D)Yes,because 2.14 >0.05.
E)both c and d
and quarterly sales data for 1996I-2013IV t = 1,...,64)for an appliance manufacturer to obtain the results shown below.Q is quarterly sales,and and are dummy variables for quarters I,II,and III. At the 5 percent level of significance,is there a statistically significant trend in sales?A)Yes,because 0.0362 < 0.05.
B)No,because 0.0362 > 0.01.
C)Yes,because 0.700 > 0.05.
D)Yes,because 2.14 >0.05.
E)both c and d
فتح الحزمة
افتح القفل للوصول البطاقات البالغ عددها 65 في هذه المجموعة.
فتح الحزمة
k this deck
47
The manufacturer of Beanie Baby dolls used quarterly price data for 2005I - 2013IV t = 1,...,36)and the regression equation to forecast doll prices in the year 2014. is the quarterly price of dolls,and and are dummy variables for quarters I,II,and III,respectively. At the 2 percent level of statistical significance,is there a statistically significant trend in the price of dolls?
A)Yes,because 0.0022 < 0.02.
B)No,because 0.0022 > 0.02.
C)Yes,because 0.800 > 0.02.
D)Yes,because 0.240 > 0.02.
E)Yes,because 3.33 > 0.02.
to forecast doll prices in the year 2014. is the quarterly price of dolls,and and are dummy variables for quarters I,II,and III,respectively. At the 2 percent level of statistical significance,is there a statistically significant trend in the price of dolls?A)Yes,because 0.0022 < 0.02.
B)No,because 0.0022 > 0.02.
C)Yes,because 0.800 > 0.02.
D)Yes,because 0.240 > 0.02.
E)Yes,because 3.33 > 0.02.
فتح الحزمة
افتح القفل للوصول البطاقات البالغ عددها 65 في هذه المجموعة.
فتح الحزمة
k this deck
48
A forecaster used the regression equation and quarterly sales data for 1996I-2013IV t = 1,...,64)for an appliance manufacturer to obtain the results shown below.Q is quarterly sales,and and are dummy variables for quarters I,II,and III. Using a 5 percent significance level,these estimation results indicate that sales in
A)the first quarter are greater than sales in any other quarter.
B)the second quarter are greater than sales in any other quarter.
C)the third quarter are greater than sales in any other quarter.
D)the fourth quarter are greater than sales in any other quarter.
and quarterly sales data for 1996I-2013IV t = 1,...,64)for an appliance manufacturer to obtain the results shown below.Q is quarterly sales,and and are dummy variables for quarters I,II,and III. Using a 5 percent significance level,these estimation results indicate that sales inA)the first quarter are greater than sales in any other quarter.
B)the second quarter are greater than sales in any other quarter.
C)the third quarter are greater than sales in any other quarter.
D)the fourth quarter are greater than sales in any other quarter.
فتح الحزمة
افتح القفل للوصول البطاقات البالغ عددها 65 في هذه المجموعة.
فتح الحزمة
k this deck
49
A consulting firm estimates the following quarterly sales forecasting model: The equation is estimated using quarterly data from 2005I-2015III t = 1,...,43).The variable D is a dummy variable for the second quarter where: D = 1 in the second quarter,and 0 otherwise.
The results of the estimation are:
Given the above,what is the estimated intercept of the trend line in the third quarter?
A)22.50
B)24.50
C)24.36
D)2.00
E)none of the above
The equation is estimated using quarterly data from 2005I-2015III t = 1,...,43).The variable D is a dummy variable for the second quarter where: D = 1 in the second quarter,and 0 otherwise.The results of the estimation are:
Given the above,what is the estimated intercept of the trend line in the third quarter?A)22.50
B)24.50
C)24.36
D)2.00
E)none of the above
فتح الحزمة
افتح القفل للوصول البطاقات البالغ عددها 65 في هذه المجموعة.
فتح الحزمة
k this deck
50
A forecaster used the regression equation and quarterly sales data for 1996I-2013IV t = 1,...,64)for an appliance manufacturer to obtain the results shown below.Q is quarterly sales,and and are dummy variables for quarters I,II,and III. What is the estimated intercept of the trend line in the second quarter?
A)25
B)26.6
C)55
D)65
E)none of the above
and quarterly sales data for 1996I-2013IV t = 1,...,64)for an appliance manufacturer to obtain the results shown below.Q is quarterly sales,and and are dummy variables for quarters I,II,and III. What is the estimated intercept of the trend line in the second quarter?A)25
B)26.6
C)55
D)65
E)none of the above
فتح الحزمة
افتح القفل للوصول البطاقات البالغ عددها 65 في هذه المجموعة.
فتح الحزمة
k this deck
51
The manufacturer of Beanie Baby dolls used quarterly price data for 2005I - 2013IV t = 1,...,36)and the regression equation to forecast doll prices in the year 2014. is the quarterly price of dolls,and and are dummy variables for quarters I,II,and III,respectively. What is the estimated intercept of the trend line in the 1st quarter?
A)24
B)-8
C)32
D)16
E)none of the above
to forecast doll prices in the year 2014. is the quarterly price of dolls,and and are dummy variables for quarters I,II,and III,respectively. What is the estimated intercept of the trend line in the 1st quarter?A)24
B)-8
C)32
D)16
E)none of the above
فتح الحزمة
افتح القفل للوصول البطاقات البالغ عددها 65 في هذه المجموعة.
فتح الحزمة
k this deck
52
A forecaster used the regression equation and quarterly sales data for 1996I-2013IV t = 1,...,64)for an appliance manufacturer to obtain the results shown below.Q is quarterly sales,and and are dummy variables for quarters I,II,and III. Using the estimation results given above,the predicted level of sales in 2014III is _______ units.
A)141.5
B)156
C)172
D)173.5
E)none of the above
and quarterly sales data for 1996I-2013IV t = 1,...,64)for an appliance manufacturer to obtain the results shown below.Q is quarterly sales,and and are dummy variables for quarters I,II,and III. Using the estimation results given above,the predicted level of sales in 2014III is _______ units.A)141.5
B)156
C)172
D)173.5
E)none of the above
فتح الحزمة
افتح القفل للوصول البطاقات البالغ عددها 65 في هذه المجموعة.
فتح الحزمة
k this deck
53
A forecaster used the regression equation and quarterly sales data for 1996I-2013IV t = 1,...,64)for an appliance manufacturer to obtain the results shown below.Q is quarterly sales,and and are dummy variables for quarters I,II,and III. Using the estimation results given above,the predicted level of sales in 2014I is _______ units.
A)137.5
B)139
C)133.5
D)132
E)none of the above
and quarterly sales data for 1996I-2013IV t = 1,...,64)for an appliance manufacturer to obtain the results shown below.Q is quarterly sales,and and are dummy variables for quarters I,II,and III. Using the estimation results given above,the predicted level of sales in 2014I is _______ units.A)137.5
B)139
C)133.5
D)132
E)none of the above
فتح الحزمة
افتح القفل للوصول البطاقات البالغ عددها 65 في هذه المجموعة.
فتح الحزمة
k this deck
54
A forecaster used the regression equation and quarterly sales data for 1996I-2013IV t = 1,...,64)for an appliance manufacturer to obtain the results shown below.Q is quarterly sales,and and are dummy variables for quarters I,II,and III. In any given year,quarterly sales tend to vary as follows:
A)QI > QII > QIII > QIV
B)QI > QII > QIV > QIII
C)QII > QIII > QIV > QI
D)QIII > QII > QI > QIV
E)QIII > QIV > QII > QI
and quarterly sales data for 1996I-2013IV t = 1,...,64)for an appliance manufacturer to obtain the results shown below.Q is quarterly sales,and and are dummy variables for quarters I,II,and III. In any given year,quarterly sales tend to vary as follows:A)QI > QII > QIII > QIV
B)QI > QII > QIV > QIII
C)QII > QIII > QIV > QI
D)QIII > QII > QI > QIV
E)QIII > QIV > QII > QI
فتح الحزمة
افتح القفل للوصول البطاقات البالغ عددها 65 في هذه المجموعة.
فتح الحزمة
k this deck
55
A forecaster used the regression equation and quarterly sales data for 1996I-2013IV t = 1,...,64)for an appliance manufacturer to obtain the results shown below.Q is quarterly sales,and and are dummy variables for quarters I,II,and III. At the 5 percent level of significance,is there a statistically significant trend in sales?
A)No,because 1.5 < 2.66.
B)No,because 1.5 < 2.00.
C)No,because 2.14 < 2.66.
D)Yes,because 2.14 > 2.00.
E)none of the above
and quarterly sales data for 1996I-2013IV t = 1,...,64)for an appliance manufacturer to obtain the results shown below.Q is quarterly sales,and and are dummy variables for quarters I,II,and III. At the 5 percent level of significance,is there a statistically significant trend in sales?A)No,because 1.5 < 2.66.
B)No,because 1.5 < 2.00.
C)No,because 2.14 < 2.66.
D)Yes,because 2.14 > 2.00.
E)none of the above
فتح الحزمة
افتح القفل للوصول البطاقات البالغ عددها 65 في هذه المجموعة.
فتح الحزمة
k this deck
56
A forecaster used the regression equation and quarterly sales data for 1996I-2013IV t = 1,...,64)for an appliance manufacturer to obtain the results shown below.Q is quarterly sales,and and are dummy variables for quarters I,II,and III. Using the estimation results given above,the predicted level of sales in 2014II is _______ units.
A)127.5
B)137.5
C)154
D)155.5
E)none of the above
and quarterly sales data for 1996I-2013IV t = 1,...,64)for an appliance manufacturer to obtain the results shown below.Q is quarterly sales,and and are dummy variables for quarters I,II,and III. Using the estimation results given above,the predicted level of sales in 2014II is _______ units.A)127.5
B)137.5
C)154
D)155.5
E)none of the above
فتح الحزمة
افتح القفل للوصول البطاقات البالغ عددها 65 في هذه المجموعة.
فتح الحزمة
k this deck
57
A forecaster used the regression equation and quarterly sales data for 1996I-2013IV t = 1,...,64)for an appliance manufacturer to obtain the results shown below.Q is quarterly sales,and and are dummy variables for quarters I,II,and III. The estimated QUARTERLY increase in sales is ______ units,and the estimated ANNUAL increase in sales is ______ units.
A)1.5; 6
B)1.4; 4
C)30; 4
D)1.5; 40
E)none of the above
and quarterly sales data for 1996I-2013IV t = 1,...,64)for an appliance manufacturer to obtain the results shown below.Q is quarterly sales,and and are dummy variables for quarters I,II,and III. The estimated QUARTERLY increase in sales is ______ units,and the estimated ANNUAL increase in sales is ______ units.A)1.5; 6
B)1.4; 4
C)30; 4
D)1.5; 40
E)none of the above
فتح الحزمة
افتح القفل للوصول البطاقات البالغ عددها 65 في هذه المجموعة.
فتح الحزمة
k this deck
58
The manufacturer of Beanie Baby dolls used quarterly price data for 2005I - 2013IV t = 1,...,36)and the regression equation to forecast doll prices in the year 2014. is the quarterly price of dolls,and and are dummy variables for quarters I,II,and III,respectively. The estimated QUARTERLY increase in price is ______,and the estimated ANNUAL increase in price is ______ .
A)$1.50; $6.00
B)$1.40; $4.00
C)$0.60; $2.40
D)$0.80; $3.20
E)none of the above
to forecast doll prices in the year 2014. is the quarterly price of dolls,and and are dummy variables for quarters I,II,and III,respectively. The estimated QUARTERLY increase in price is ______,and the estimated ANNUAL increase in price is ______ .A)$1.50; $6.00
B)$1.40; $4.00
C)$0.60; $2.40
D)$0.80; $3.20
E)none of the above
فتح الحزمة
افتح القفل للوصول البطاقات البالغ عددها 65 في هذه المجموعة.
فتح الحزمة
k this deck
59
The manufacturer of Beanie Baby dolls used quarterly price data for 2005I - 2013IV t = 1,...,36)and the regression equation to forecast doll prices in the year 2014. is the quarterly price of dolls,and and are dummy variables for quarters I,II,and III,respectively. What is the estimated intercept of the trend line in the 4th quarter?
A)22.8
B)16
C)18
D)20
E)none of the above
to forecast doll prices in the year 2014. is the quarterly price of dolls,and and are dummy variables for quarters I,II,and III,respectively. What is the estimated intercept of the trend line in the 4th quarter?A)22.8
B)16
C)18
D)20
E)none of the above
فتح الحزمة
افتح القفل للوصول البطاقات البالغ عددها 65 في هذه المجموعة.
فتح الحزمة
k this deck
60
A forecaster used the regression equation and quarterly sales data for 1996I-2013IV t = 1,...,64)for an appliance manufacturer to obtain the results shown below.Q is quarterly sales,and and are dummy variables for quarters I,II,and III. What is the estimated intercept of the trend line in the fourth quarter?
A)0
B)40
C)55
D)70
E)none of the above
and quarterly sales data for 1996I-2013IV t = 1,...,64)for an appliance manufacturer to obtain the results shown below.Q is quarterly sales,and and are dummy variables for quarters I,II,and III. What is the estimated intercept of the trend line in the fourth quarter?A)0
B)40
C)55
D)70
E)none of the above
فتح الحزمة
افتح القفل للوصول البطاقات البالغ عددها 65 في هذه المجموعة.
فتح الحزمة
k this deck
61
The manufacturer of Beanie Baby dolls used quarterly price data for 2005I - 2013IV t = 1,...,36)and the regression equation to forecast doll prices in the year 2014. is the quarterly price of dolls,and and are dummy variables for quarters I,II,and III,respectively. At the 2 percent level of statistical significance,the results indicate that price in the ________ quarter is significantly lower than in any other quarter.
A)1st
B)2nd
C)3rd
D)4th
to forecast doll prices in the year 2014. is the quarterly price of dolls,and and are dummy variables for quarters I,II,and III,respectively. At the 2 percent level of statistical significance,the results indicate that price in the ________ quarter is significantly lower than in any other quarter.A)1st
B)2nd
C)3rd
D)4th
فتح الحزمة
افتح القفل للوصول البطاقات البالغ عددها 65 في هذه المجموعة.
فتح الحزمة
k this deck
62
The manufacturer of Beanie Baby dolls used quarterly price data for 2005I - 2013IV t = 1,...,36)and the regression equation to forecast doll prices in the year 2014. is the quarterly price of dolls,and and are dummy variables for quarters I,II,and III,respectively. In any given year price tends to vary from quarter to quarter as follows:
A)PI > PII > PIII > PIV
B)PI > PIV > PIII > PII
C)PII > PIII > PIV > PI
D)PIII > PI > PII > PIV
E)PIV > PIII > PII > PI
to forecast doll prices in the year 2014. is the quarterly price of dolls,and and are dummy variables for quarters I,II,and III,respectively. In any given year price tends to vary from quarter to quarter as follows:A)PI > PII > PIII > PIV
B)PI > PIV > PIII > PII
C)PII > PIII > PIV > PI
D)PIII > PI > PII > PIV
E)PIV > PIII > PII > PI
فتح الحزمة
افتح القفل للوصول البطاقات البالغ عددها 65 في هذه المجموعة.
فتح الحزمة
k this deck
63
The manufacturer of Beanie Baby dolls used quarterly price data for 2005I - 2013IV t = 1,...,36)and the regression equation to forecast doll prices in the year 2014. is the quarterly price of dolls,and and are dummy variables for quarters I,II,and III,respectively. Using the estimated time-series regression,predicted price in the 2nd quarter of 2014 is
A)$48.40
B)$54.40
C)$40.40
D)$51.40
E)none of the above
to forecast doll prices in the year 2014. is the quarterly price of dolls,and and are dummy variables for quarters I,II,and III,respectively. Using the estimated time-series regression,predicted price in the 2nd quarter of 2014 isA)$48.40
B)$54.40
C)$40.40
D)$51.40
E)none of the above
فتح الحزمة
افتح القفل للوصول البطاقات البالغ عددها 65 في هذه المجموعة.
فتح الحزمة
k this deck
64
The manufacturer of Beanie Baby dolls used quarterly price data for 2005I - 2013IV t = 1,...,36)and the regression equation to forecast doll prices in the year 2014. is the quarterly price of dolls,and and are dummy variables for quarters I,II,and III,respectively. Using the estimated time-series regression,predicted price in the 1st quarter of 2014 is
A)$53.60.
B)$45.60.
C)$56.00.
D)$37.60.
E)none of the above
to forecast doll prices in the year 2014. is the quarterly price of dolls,and and are dummy variables for quarters I,II,and III,respectively. Using the estimated time-series regression,predicted price in the 1st quarter of 2014 isA)$53.60.
B)$45.60.
C)$56.00.
D)$37.60.
E)none of the above
فتح الحزمة
افتح القفل للوصول البطاقات البالغ عددها 65 في هذه المجموعة.
فتح الحزمة
k this deck
65
The manufacturer of Beanie Baby dolls used quarterly price data for 2005I - 2013IV t = 1,...,36)and the regression equation to forecast doll prices in the year 2014. is the quarterly price of dolls,and and are dummy variables for quarters I,II,and III,respectively. At the 2 percent level of statistical significance,the estimation results indicate that price in the ________ quarter is significantly higher than in any other quarter.
A)1st
B)2nd
C)3rd
D)4th
to forecast doll prices in the year 2014. is the quarterly price of dolls,and and are dummy variables for quarters I,II,and III,respectively. At the 2 percent level of statistical significance,the estimation results indicate that price in the ________ quarter is significantly higher than in any other quarter.A)1st
B)2nd
C)3rd
D)4th
فتح الحزمة
افتح القفل للوصول البطاقات البالغ عددها 65 في هذه المجموعة.
فتح الحزمة
k this deck
فتح الحزمة
افتح القفل للوصول البطاقات البالغ عددها 65 في هذه المجموعة.


