Deck 2: The Basics of Supply and Demand
ملء الشاشة (f)
سؤال
سؤال
سؤال
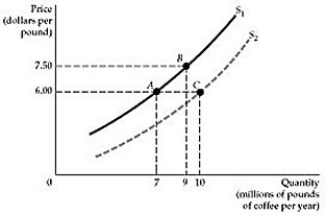 Figure 2.1.1
Refer to Figure 2.1.1 above. Starting from point A, how do the firms in the market react when the price of coffee increases from $6.00 to $7.50 per pound?
A) The supply curve shifts to the right and the quantity supplied increases to 10 million pounds per year.
B) The supply curve shifts from S1 to S2, but the market moves from A to B, so the quantity supplied increases to 9 million pounds per year.
C) The market moves from A to B temporarily, but eventually will settle at point C, where the quantity supplied will be 10 million pounds.
D) The supply curve does not shift, but the quantity supplied increases from 7 to 9 million pounds per year.
سؤال
سؤال
سؤال
سؤال
سؤال
سؤال
سؤال
سؤال
سؤال
Figure 2.1.1Refer to Figure 2.1.1 above. Lower material costs-indeed lower costs of any kind-make production more profitable. Starting at point A, which of the following best represents this assertion?
A) The move from A to B
B) The move from A to C
C) A move from A to B, and then to C
D) A move from A to C, and then to B
سؤال
سؤال
سؤال
سؤال
سؤال
سؤال
سؤال
سؤال
سؤال
سؤال
سؤال
سؤال
سؤال
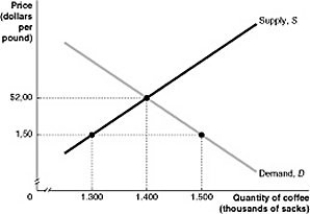 Figure 2.2.1
Refer to Figure 2.2.1 above. At a price of $1.50, there is:
A) an excess of quantity demanded over quantity supplied.
B) an excess of quantity supplied over quantity demanded.
C) an alternative equilibrium between supply and demand.
D) a surplus of coffee in the market.
سؤال
سؤال
سؤال
سؤال
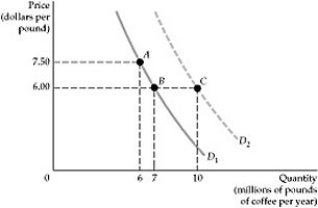 Figure 2.1.2
Refer to Figure 2.1.2. The price of coffee is currently $6.00. and quantity demanded is 7 million pounds. Then there is a notable increase in the preference for coffee over other substitutes, like tea. Which move best describes this change?
A) A move from B to A
B) A move from B to C
C) A move from B to A, and then to C
D) A move from B to C, and then to A
سؤال
سؤال
سؤال
سؤال
سؤال
سؤال
سؤال
سؤال
سؤال
Figure 2.1.2Refer to Figure 2.1.2. If the price of coffee decreases, from $7.50 to $6.00 per pound, which of the following will occur?
A) The quantity demanded of coffee will increase, from 6 to 7 million pounds per year.
B) The demand curve will shift to the right and the quantity demanded will increase to 10 million pounds per year.
C) Both moves, from A to B and then from B to C, will occur simultaneously.
D) It is possible that the market demand will show the move fro A to B, or that it moves directly from A to C.
سؤال
Figure 2.2.1Refer to Figure 2.2.1 above. If the price of $1.50 is a price imposed by the government, we can call it:
A) a price floor.
B) a price ceiling.
C) a socially optimal equilibrium price.
D) a fiscal price.
سؤال
سؤال
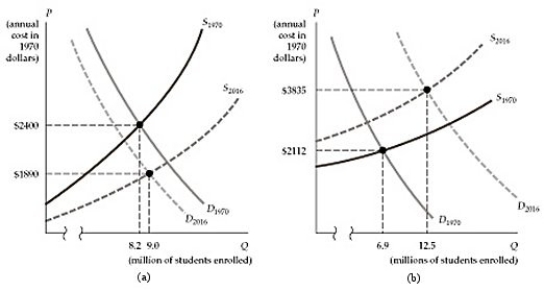 Figure 2.3.3
Refer to Figure 2.3.3 above. Which of the two panels best describes the trend in college costs from 1970 to 2016?
A) Panel (a)
B) Panel (b)
C) Both panels
D) Neither panel
سؤال
سؤال
سؤال
سؤال
سؤال
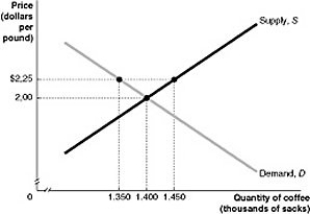 Figure 2.2.2
Refer to Figure 2.2.2 above. An imposed price of $2.25 can be called:
A) a price ceiling.
B) a price floor.
C) a consumer-friendly price.
D) a price of equilibrium difference.
سؤال
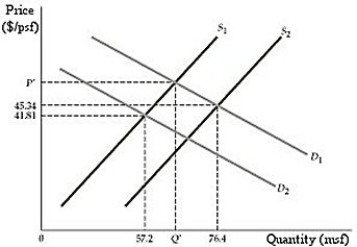 Figure 2.3.1
Refer to Figure 2.3.1. In Example 2.4, the textbook describes the impact of 9/11 on the real estate market in New York city. How does the sketch in figure 2.3.1 adapt to the described scenario?
A) Demand shifted from D1 to D2 and supply shifted from S1 to S2.
B) Demand shifted from D1 to D2 and supply shifted from S2 to S1.
C) Demand shifted from D2 to D1 and supply shifted from S1 to S2.
D) Demand shifted from D2 to D1 and supply shifted from S2 to S1.
سؤال
سؤال
سؤال
سؤال
سؤال
سؤال
The daily demand for hotel rooms on Manhattan Island in New York is given by the equation 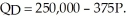 The daily supply of hotel rooms on Manhattan Island is given by the equation
 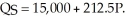 Diagram these demand and supply curves in the price and quantity space. What is the equilibrium price and quantity of hotel rooms on Manhattan Island?
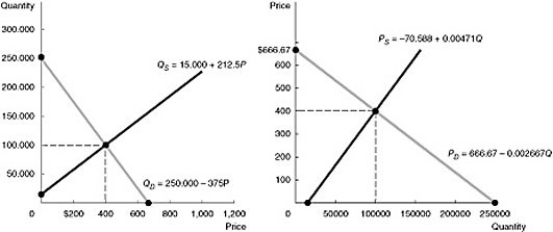
The daily supply of hotel rooms on Manhattan Island is given by the equation Diagram these demand and supply curves in the price and quantity space. What is the equilibrium price and quantity of hotel rooms on Manhattan Island? سؤال
Figure 2.3.1The effect of the September 11 attacks on the World Trade Center on the market for office space in downtown Manhattan was that both the equilibrium price and the equilibrium quantity fell. What is the most likely explanation for this?
A) Supply and demand both shifted left, and the magnitude of the demand shift was greater.
B) Supply and demand both shifted left, and the magnitude of the supply shift was greater.
C) Supply shifted left, demand shifted right, and the magnitude of the demand shift was greater.
D) Supply shifted left, demand shifted right, and the magnitude of the supply shift was greater.
سؤال
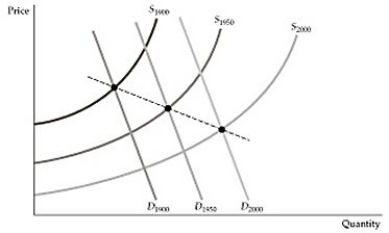 Figure 2.3.2
Figure 2.3.2 above is a reproduction of Figure 2.9 in the textbook, which describes the market for mineral resources across time. The downward-sloping line that crosses the equilibrium points is called:
A) the market decline curve.
B) the market rise path.
C) the long-run path of price and consumption.
D) the industry supply curve.
سؤال
Suppose a new discovery in computer manufacturing has just made computer production cheaper. Also, the popularity and usefulness of computers continues to grow. Use Supply and Demand analysis to predict how these shocks will affect equilibrium price and quantity of computers. Is there enough information to determine if market prices will rise or fall? Why? 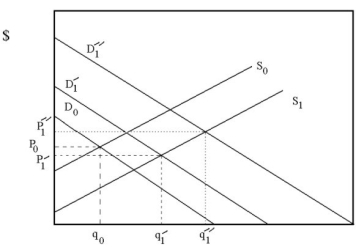
سؤال
سؤال
Figure 2.2.2Refer to Figure 2.2.2 above. If the price of $2.25 is an artificial price imposed by the government, and the government is expected to remove it, what will happen in this market?
A) There will a tendency for the price to be higher than the imposed price.
B) There will a tendency for the new price to be lower than the imposed price.
C) The new price would not be expected to by any different than the already imposed price.
D) The new price will tend to fluctuate above and below the equilibrium price of $2.00.
سؤال
Suppose that due to more stringent environmental regulation it becomes more expensive for steel production firms to operate. Also, recent technological advances in plastics has reduced the demand for steel products. Use Supply and Demand analysis to predict how these shocks will affect equilibrium price and quantity of steel. Can we say with certainty that the market price for steel will fall? Why? 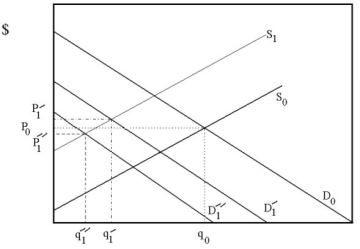
سؤال
سؤال
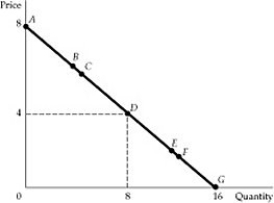 Figure 2.4.1
Refer to Figure 2.4.1. Between points E and F, demand is:
A) completely inelastic.
B) inelastic, but not completely inelastic.
C) unit elastic.
D) elastic, but not infinitely elastic.
E) infinitely elastic.
سؤال
سؤال
Which of the following represents the income elasticity of demand?
A)
B) +
+

C) ×
×

D) -
-

A)
B)
+C)
×D)
- سؤال
Figure 2.4.1Refer to Figure 2.4.1. Between two points near D, demand is:
A) completely inelastic.
B) inelastic, but not completely inelastic.
C) unit elastic.
D) elastic, but not infinitely elastic.
E) infinitely elastic.
سؤال
Figure 2.4.1Refer to Figure 2.4.1. At point A, demand is:
A) completely inelastic.
B) inelastic, but not completely inelastic.
C) unit elastic.
D) elastic, but not infinitely elastic.
E) infinitely elastic.
سؤال
Suppose the cable TV industry is currently unregulated. However, due to complaints from consumers that the price of cable TV is too high, the legislature is considering placing a price ceiling on cable TV below the current equilibrium price. Assuming the government does make this price ceiling law, please construct a diagram that shows the impact of this law on the cable TV market, and please briefly explain the effects on market prices and quantities with supply and demand analysis. Also, if the cable TV company is worried about disgruntling customers, the company may introduce a different type of programming that is cheaper for the company to provide yet is equally appealing to customers. What would be the effects of this action? 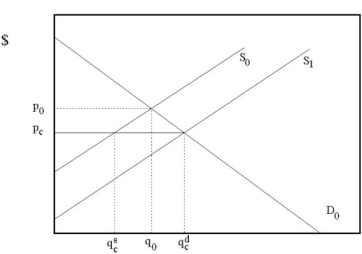
سؤال
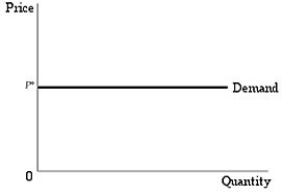 Figure 2.4.2
Refer to Figure 2.4.2 above. Which of the following best describes de demand curve in this figure?
A) Demand is infinitely elastic.
B) Demand is completely inelastic.
C) Demand becomes more inelastic the lower the price.
D) Demand becomes more elastic the lower the price.
سؤال
Suppose that the resale of tickets to professional football games is illegal in Missouri. Due to the high demand for Chiefs (who play in Kansas City, Missouri) tickets there is a shortage of tickets at the current ticket price. Given that the Chiefs will not raise the price at which they sell the tickets, what would be the result of allowing tickets to be resold in a secondary market at whatever price the market would support? If speculators entered the market and began buying tickets directly from the Chiefs in hopes of reselling the tickets later, what would happen to the line outside of the ticket offices when the tickets are initially sold? 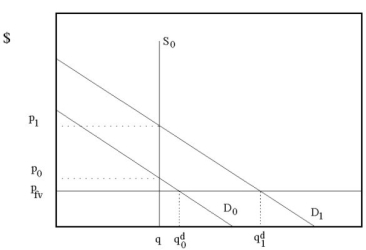
سؤال
Historically, investors have considered gold commodities to be a good investment to preserve wealth in times of inflation. If investors are no longer worried about inflation and gold demand decreases, what do you expect will happen to gold prices? How would your answer change if you learn that a recent gold mine discovery will increase the supply of gold? 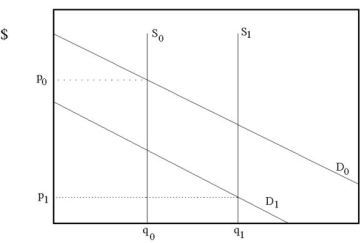
سؤال
سؤال
سؤال
The currency used by the Confederate States of America during its brief existence from 1861 to 1865 has become a collector's item today. The Confederate Currency supply is perfectly inelastic. As the demand for the collectible increases and some of the old currency is destroyed or no longer of value as a collectible, what happens to the market price? 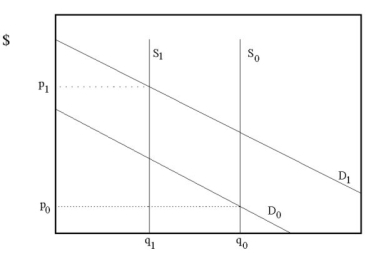
سؤال
Figure 2.4.1Refer to Figure 2.4.1. Between points B and C, demand is:
A) small.
B) inelastic, but not completely inelastic.
C) unit elastic.
D) elastic, but not infinitely elastic.
E) infinitely elastic.
سؤال
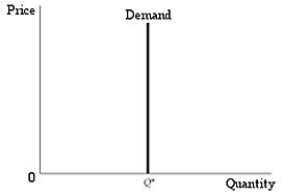 Figure 2.4.3
Refer to Figure 2.4.3 above. The price elasticity of demand along this demand curve is equal to:
A) whatever the value of the price is.
B) infinity.
C) zero.
D) an undetermined value.
سؤال
Figure 2.4.1Refer to Figure 2.4.1. At point E, demand is:
A) completely inelastic.
B) inelastic, but not completely inelastic.
C) unit elastic.
D) elastic, but not infinitely elastic.
E) infinitely elastic.
سؤال
Figure 2.4.3Refer to Figure 2.4.3 above. Which of the following best describes de demand curve in this figure?
A) Demand is infinitely elastic.
B) Demand is completely inelastic.
C) Demand becomes more inelastic the lower the price.
D) Demand becomes more elastic the lower the price.
سؤال
Which of the following represents the price elasticity of demand?
A)
B) +
+

C) ×
×

D) -
-

A)
B)
+C)
×D)
- سؤال
سؤال
Figure 2.4.1Refer to Figure 2.4.1. Which of the following statements about the demand curve in the figure?
A) Demand is infinitely elastic.
B) Demand is completely inelastic.
C) Demand becomes more inelastic as price declines.
D) Demand becomes more elastic as price declines.
سؤال
Figure 2.4.2Refer to Figure 2.4.2 above. Fill in the blanks. For any price higher than P*, the quantity demanded ________, while for any price lower than P*, the quantity demanded ________.
A) drops to zero; increases without limit
B) drops to zero; remains constant
C) increases without limit; does not exist
D) does not exist; is unpredictable

فتح الحزمة
قم بالتسجيل لفتح البطاقات في هذه المجموعة!
Unlock Deck
Unlock Deck
1/139
العب
ملء الشاشة (f)
Deck 2: The Basics of Supply and Demand
1
A supply curve reveals:
A) the quantity of output consumers are willing to purchase at each possible market price.
B) the difference between quantity demanded and quantity supplied at each price.
C) the maximum level of output an industry can produce, regardless of price.
D) the quantity of output that producers are willing to produce and sell at each possible market price.
the quantity of output that producers are willing to produce and sell at each possible market price.
2
The battery packs used in electric and hybrid automobiles are one of the largest cost components for manufacturing these cars. As the price of these batteries decline, we expect that the:
A) supply curve for electric and hybrid autos will shift rightward.
B) supply curve for electric and hybrid autos will shift leftward.
C) demand curve for electric and hybrid autos will shift rightward.
D) demand curve for electric and hybrid autos will shift leftward.
A) supply curve for electric and hybrid autos will shift rightward.
B) supply curve for electric and hybrid autos will shift leftward.
C) demand curve for electric and hybrid autos will shift rightward.
D) demand curve for electric and hybrid autos will shift leftward.
supply curve for electric and hybrid autos will shift rightward.
3
Figure 2.1.1Refer to Figure 2.1.1 above. Starting from point A, how do the firms in the market react when the price of coffee increases from $6.00 to $7.50 per pound?
A) The supply curve shifts to the right and the quantity supplied increases to 10 million pounds per year.
B) The supply curve shifts from S1 to S2, but the market moves from A to B, so the quantity supplied increases to 9 million pounds per year.
C) The market moves from A to B temporarily, but eventually will settle at point C, where the quantity supplied will be 10 million pounds.
D) The supply curve does not shift, but the quantity supplied increases from 7 to 9 million pounds per year.
The supply curve does not shift, but the quantity supplied increases from 7 to 9 million pounds per year.
4
To protect the cod fishery off the northeast coast of the U.S., the federal government may limit the amount of fish that each boat can catch in the fishery. The result of this public policy is to:
A) shift the cod demand curve to the left.
B) shift the cod demand curve to the right.
C) shift the cod supply curve to the right.
D) shift the cod supply curve to the left.
A) shift the cod demand curve to the left.
B) shift the cod demand curve to the right.
C) shift the cod supply curve to the right.
D) shift the cod supply curve to the left.
فتح الحزمة
افتح القفل للوصول البطاقات البالغ عددها 139 في هذه المجموعة.
فتح الحزمة
k this deck
5
To protect the cod fishery off the northeast coast of the U.S., the federal government may limit the amount of fish that each boat can catch in the fishery. The result of this public policy is to:
A) shift the cod demand curve to the left.
B) shift the cod demand curve to the right.
C) shift the cod supply curve to the right.
D) shift the cod supply curve to the left.
A) shift the cod demand curve to the left.
B) shift the cod demand curve to the right.
C) shift the cod supply curve to the right.
D) shift the cod supply curve to the left.
فتح الحزمة
افتح القفل للوصول البطاقات البالغ عددها 139 في هذه المجموعة.
فتح الحزمة
k this deck
6
Which of the following will cause the demand curve for Beatles' compact discs to shift to the right?
A) An increase in the price of the discs
B) A decrease in consumers' incomes
C) An increase in the price of Phil Collins' latest compact disc (a substitute)
D) all of the above
E) none of the above
A) An increase in the price of the discs
B) A decrease in consumers' incomes
C) An increase in the price of Phil Collins' latest compact disc (a substitute)
D) all of the above
E) none of the above
فتح الحزمة
افتح القفل للوصول البطاقات البالغ عددها 139 في هذه المجموعة.
فتح الحزمة
k this deck
7
Coffee and cream:
A) are both luxury goods.
B) are complements.
C) are both more inelastic in demand in the long run than in the short run.
D) have a positive cross price elasticity of demand.
A) are both luxury goods.
B) are complements.
C) are both more inelastic in demand in the long run than in the short run.
D) have a positive cross price elasticity of demand.
فتح الحزمة
افتح القفل للوصول البطاقات البالغ عددها 139 في هذه المجموعة.
فتح الحزمة
k this deck
8
The price of good A goes up. As a result, the demand for good B shifts to the left. From this we can infer that:
A) good A is used to produce good B.
B) good B is used to produce good A.
C) goods A and B are substitutes.
D) goods A and B are complements.
E) none of the above
A) good A is used to produce good B.
B) good B is used to produce good A.
C) goods A and B are substitutes.
D) goods A and B are complements.
E) none of the above
فتح الحزمة
افتح القفل للوصول البطاقات البالغ عددها 139 في هذه المجموعة.
فتح الحزمة
k this deck
9
Due to the recent increase in the price of natural gas, the quantity of coal demanded by electric power generation plants has increased. Based on this information, coal and natural gas are:
A) complements.
B) substitutes.
C) independent goods.
D) none of the above
A) complements.
B) substitutes.
C) independent goods.
D) none of the above
فتح الحزمة
افتح القفل للوصول البطاقات البالغ عددها 139 في هذه المجموعة.
فتح الحزمة
k this deck
10
Assume that steak and potatoes are complements. When the price of steak goes up, the demand curve for potatoes:
A) shifts to the left.
B) shifts to the right.
C) remains constant.
D) shifts to the right initially and then returns to its original position.
A) shifts to the left.
B) shifts to the right.
C) remains constant.
D) shifts to the right initially and then returns to its original position.
فتح الحزمة
افتح القفل للوصول البطاقات البالغ عددها 139 في هذه المجموعة.
فتح الحزمة
k this deck
11
Which of the following would shift the demand curve for new textbooks to the right?
A) A fall in the price of paper used in publishing texts
B) A fall in the price of equivalent used textbooks
C) An increase in the number of students attending college
D) A fall in the price of new textbooks.
A) A fall in the price of paper used in publishing texts
B) A fall in the price of equivalent used textbooks
C) An increase in the number of students attending college
D) A fall in the price of new textbooks.
فتح الحزمة
افتح القفل للوصول البطاقات البالغ عددها 139 في هذه المجموعة.
فتح الحزمة
k this deck
12
Figure 2.1.1Refer to Figure 2.1.1 above. Lower material costs-indeed lower costs of any kind-make production more profitable. Starting at point A, which of the following best represents this assertion?
A) The move from A to B
B) The move from A to C
C) A move from A to B, and then to C
D) A move from A to C, and then to B
فتح الحزمة
افتح القفل للوصول البطاقات البالغ عددها 139 في هذه المجموعة.
فتح الحزمة
k this deck
13
When an industry's raw material costs increase, other things remaining the same,
A) the supply curve shifts to the left.
B) the supply curve shifts to the right.
C) output increases regardless of the market price and the supply curve shifts upward.
D) output decreases and the market price also decreases.
A) the supply curve shifts to the left.
B) the supply curve shifts to the right.
C) output increases regardless of the market price and the supply curve shifts upward.
D) output decreases and the market price also decreases.
فتح الحزمة
افتح القفل للوصول البطاقات البالغ عددها 139 في هذه المجموعة.
فتح الحزمة
k this deck
14
The discussion of Figure 2.2 in the text indicates that quantity demanded for most goods tends to increase as income rises. However, the quantity of bananas demanded in the U.S. tends to decrease as income rises. Under this condition, we expect that an increase in consumer income shifts the demand curve for bananas:
A) rightward
B) no shift.
C) leftward.
D) upward.
A) rightward
B) no shift.
C) leftward.
D) upward.
فتح الحزمة
افتح القفل للوصول البطاقات البالغ عددها 139 في هذه المجموعة.
فتح الحزمة
k this deck
15
Sugar can be refined from sugar beets. When the price of those beets falls,
A) the demand curve for sugar would shift right.
B) the demand curve for sugar would shift left.
C) the supply curve for sugar would shift right.
D) the supply curve for sugar would shift left.
A) the demand curve for sugar would shift right.
B) the demand curve for sugar would shift left.
C) the supply curve for sugar would shift right.
D) the supply curve for sugar would shift left.
فتح الحزمة
افتح القفل للوصول البطاقات البالغ عددها 139 في هذه المجموعة.
فتح الحزمة
k this deck
16
Rare earth metals are used to manufacture some important electronic components in popular products like cell phones. These metals are not really rare, but they are expensive to extract from the ground. What happens to the market for the rare earth metals if these extraction costs increase?
A) Demand curve shifts leftward
B) Demand curve shifts rightward
C) Supply curve shifts leftward
D) Supply curve shifts rightward
A) Demand curve shifts leftward
B) Demand curve shifts rightward
C) Supply curve shifts leftward
D) Supply curve shifts rightward
فتح الحزمة
افتح القفل للوصول البطاقات البالغ عددها 139 في هذه المجموعة.
فتح الحزمة
k this deck
17
Which of the following would cause a shift to the right of the supply curve for gasoline? I. A large increase in the price of public transportation.
II) A large decrease in the price of automobiles.
III) A large reduction in the costs of producing gasoline.
A) I only
B) II only
C) III only
D) II and III only
II) A large decrease in the price of automobiles.
III) A large reduction in the costs of producing gasoline.
A) I only
B) II only
C) III only
D) II and III only
فتح الحزمة
افتح القفل للوصول البطاقات البالغ عددها 139 في هذه المجموعة.
فتح الحزمة
k this deck
18
Plastic and steel are substitutes in the production of body panels for certain automobiles. If the price of plastic increases, with other things remaining the same, we would expect:
A) the price of steel to fall.
B) the demand curve for steel to shift to the right.
C) the demand curve for plastic to shift to the left.
D) nothing to happen to steel because it is only a substitute for plastic.
E) the demand curve for steel to shift to the left.
A) the price of steel to fall.
B) the demand curve for steel to shift to the right.
C) the demand curve for plastic to shift to the left.
D) nothing to happen to steel because it is only a substitute for plastic.
E) the demand curve for steel to shift to the left.
فتح الحزمة
افتح القفل للوصول البطاقات البالغ عددها 139 في هذه المجموعة.
فتح الحزمة
k this deck
19
Which of the following events will cause a leftward shift in the supply curve of gasoline?
A) A decrease in the price of gasoline
B) An increase in the wage rate of refinery workers
C) Decrease in the price of crude oil
D) An improvement in oil refining technology
E) all of the above
A) A decrease in the price of gasoline
B) An increase in the wage rate of refinery workers
C) Decrease in the price of crude oil
D) An improvement in oil refining technology
E) all of the above
فتح الحزمة
افتح القفل للوصول البطاقات البالغ عددها 139 في هذه المجموعة.
فتح الحزمة
k this deck
20
You are analyzing the demand for good X. Which of the following will result in a shift to the right of the demand curve for X?
A) A decrease in the price of X
B) An increase in the price of a good that is a complement to good X
C) An increase in the price of a good that is a substitute for X
D) all of the above
A) A decrease in the price of X
B) An increase in the price of a good that is a complement to good X
C) An increase in the price of a good that is a substitute for X
D) all of the above
فتح الحزمة
افتح القفل للوصول البطاقات البالغ عددها 139 في هذه المجموعة.
فتح الحزمة
k this deck
21
Assume that the current market price is below the market clearing level. We would expect:
A) a surplus to accumulate.
B) downward pressure on the current market price.
C) upward pressure on the current market price.
D) lower production during the next time period.
A) a surplus to accumulate.
B) downward pressure on the current market price.
C) upward pressure on the current market price.
D) lower production during the next time period.
فتح الحزمة
افتح القفل للوصول البطاقات البالغ عددها 139 في هذه المجموعة.
فتح الحزمة
k this deck
22
Scenario 2.1:
The demand for books is: Qd = 120 - P
The supply of books is: Qs = 5P
Refer to Scenario 2.1. What is the equilibrium quantity of books sold?
A) 25
B) 50
C) 75
D) 100
E) none of the above
The demand for books is: Qd = 120 - P
The supply of books is: Qs = 5P
Refer to Scenario 2.1. What is the equilibrium quantity of books sold?
A) 25
B) 50
C) 75
D) 100
E) none of the above
فتح الحزمة
افتح القفل للوصول البطاقات البالغ عددها 139 في هذه المجموعة.
فتح الحزمة
k this deck
23
Scenario 2.1:
The demand for books is: Qd = 120 - P
The supply of books is: Qs = 5P
Refer to Scenario 2.1. If P = $15, which of the following is true?
A) Quantity supplied is greater than quantity demanded.
B) Quantity supplied is less than quantity demanded.
C) Quantity supplied equals quantity demanded.
D) There is a surplus.
فتح الحزمة
افتح القفل للوصول البطاقات البالغ عددها 139 في هذه المجموعة.
فتح الحزمة
k this deck
24
Scenario 2.1:
The demand for books is: Qd = 120 - P
The supply of books is: Qs = 5P
Refer to Scenario 2.1. If P = $15, which of the following is true?
A) There is a surplus equal to 30.
B) There is a shortage equal to 30.
C) There is a surplus, but it is impossible to determine how large.
D) There is a shortage, but it is impossible to determine how large.
فتح الحزمة
افتح القفل للوصول البطاقات البالغ عددها 139 في هذه المجموعة.
فتح الحزمة
k this deck
25
Figure 2.2.1Refer to Figure 2.2.1 above. At a price of $1.50, there is:
A) an excess of quantity demanded over quantity supplied.
B) an excess of quantity supplied over quantity demanded.
C) an alternative equilibrium between supply and demand.
D) a surplus of coffee in the market.
فتح الحزمة
افتح القفل للوصول البطاقات البالغ عددها 139 في هذه المجموعة.
فتح الحزمة
k this deck
26
As long as the actual market price exceeds the equilibrium market price, there will be:
A) downward pressure on the market price.
B) upward pressure on the market price.
C) no purchases made.
D) Both A and C are correct.
E) Both B and C are correct.
A) downward pressure on the market price.
B) upward pressure on the market price.
C) no purchases made.
D) Both A and C are correct.
E) Both B and C are correct.
فتح الحزمة
افتح القفل للوصول البطاقات البالغ عددها 139 في هذه المجموعة.
فتح الحزمة
k this deck
27
The battery packs used in electric and hybrid automobiles are one of the largest cost components for manufacturing these cars. As the price of these batteries decline, we expect that the:
A) supply curve for electric and hybrid autos will shift rightward.
B) supply curve for electric and hybrid autos will shift leftward.
C) demand curve for electric and hybrid autos will shift rightward.
D) demand curve for electric and hybrid autos will shift leftward.
A) supply curve for electric and hybrid autos will shift rightward.
B) supply curve for electric and hybrid autos will shift leftward.
C) demand curve for electric and hybrid autos will shift rightward.
D) demand curve for electric and hybrid autos will shift leftward.
فتح الحزمة
افتح القفل للوصول البطاقات البالغ عددها 139 في هذه المجموعة.
فتح الحزمة
k this deck
28
Scenario 2.1:
The demand for books is: Qd = 120 - P
The supply of books is: Qs = 5P
Refer to Scenario 2.1. If P = $25, which of the following is true?
A) There is a surplus equal to 30.
B) There is a shortage equal to 30.
C) There is a shortage, but it is impossible to determine how large.
D) There is a surplus, but it is impossible to determine how large.
فتح الحزمة
افتح القفل للوصول البطاقات البالغ عددها 139 في هذه المجموعة.
فتح الحزمة
k this deck
29
Figure 2.1.2Refer to Figure 2.1.2. The price of coffee is currently $6.00. and quantity demanded is 7 million pounds. Then there is a notable increase in the preference for coffee over other substitutes, like tea. Which move best describes this change?
A) A move from B to A
B) A move from B to C
C) A move from B to A, and then to C
D) A move from B to C, and then to A
فتح الحزمة
افتح القفل للوصول البطاقات البالغ عددها 139 في هذه المجموعة.
فتح الحزمة
k this deck
30
When the current price is above the market-clearing level we would expect:
A) quantity demanded to exceed quantity supplied.
B) quantity supplied to exceed quantity demanded.
C) a shortage.
D) greater production to occur during the next period.
A) quantity demanded to exceed quantity supplied.
B) quantity supplied to exceed quantity demanded.
C) a shortage.
D) greater production to occur during the next period.
فتح الحزمة
افتح القفل للوصول البطاقات البالغ عددها 139 في هذه المجموعة.
فتح الحزمة
k this deck
31
Scenario 2.1:
The demand for books is: Qd = 120 - P
The supply of books is: Qs = 5P
Refer to Scenario 2.1. What is the equilibrium price of books?
A) 5
B) 10
C) 15
D) 20
E) none of the above
The demand for books is: Qd = 120 - P
The supply of books is: Qs = 5P
Refer to Scenario 2.1. What is the equilibrium price of books?
A) 5
B) 10
C) 15
D) 20
E) none of the above
فتح الحزمة
افتح القفل للوصول البطاقات البالغ عددها 139 في هذه المجموعة.
فتح الحزمة
k this deck
32
If the actual price were below the equilibrium price in the market for bread, a:
A) surplus would develop that cannot be eliminated over time.
B) shortage would develop, which market forces would eliminate over time.
C) surplus would develop, which market forces would eliminate over time.
D) shortage would develop, which market forces would tend to exacerbate.
A) surplus would develop that cannot be eliminated over time.
B) shortage would develop, which market forces would eliminate over time.
C) surplus would develop, which market forces would eliminate over time.
D) shortage would develop, which market forces would tend to exacerbate.
فتح الحزمة
افتح القفل للوصول البطاقات البالغ عددها 139 في هذه المجموعة.
فتح الحزمة
k this deck
33
Rare earth metals are used to manufacture some important electronic components in popular products like cell phones. These metals are not really rare, but they are expensive to extract from the ground. What happens to the market for the rare earth metals if these extraction costs increase?
A) Demand curve shifts leftward
B) Demand curve shifts rightward
C) Supply curve shifts leftward
D) Supply curve shifts rightward
A) Demand curve shifts leftward
B) Demand curve shifts rightward
C) Supply curve shifts leftward
D) Supply curve shifts rightward
فتح الحزمة
افتح القفل للوصول البطاقات البالغ عددها 139 في هذه المجموعة.
فتح الحزمة
k this deck
34
Scenario 2.1:
The demand for books is: Qd = 120 - P
The supply of books is: Qs = 5P
Refer to Scenario 2.1. If P = $25, which of the following is true?
A) Quantity supplied is greater than quantity demanded.
B) Quantity supplied is less than quantity demanded.
C) Quantity supplied equals quantity demanded.
D) There is a shortage.
فتح الحزمة
افتح القفل للوصول البطاقات البالغ عددها 139 في هذه المجموعة.
فتح الحزمة
k this deck
35
Suppose the equilibrium price of milk is $3 per gallon but the federal government sets the market price at $4 per gallon. The market mechanism will force the milk price back down to $3 per gallon unless the government:
A) rations the excess demand for milk among consumers.
B) buys the excess supply of milk and removes it from the market.
C) Both A and B are plausible actions.
D) The government cannot maintain the price above the equilibrium level.
A) rations the excess demand for milk among consumers.
B) buys the excess supply of milk and removes it from the market.
C) Both A and B are plausible actions.
D) The government cannot maintain the price above the equilibrium level.
فتح الحزمة
افتح القفل للوصول البطاقات البالغ عددها 139 في هذه المجموعة.
فتح الحزمة
k this deck
36
The current market price for good X is below the equilibrium price, and then the demand curve for X shifts rightward. What is the likely outcome of the demand shift?
A) The surplus increases.
B) The surplus decreases.
C) The shortage increases.
D) The shortage decreases.
A) The surplus increases.
B) The surplus decreases.
C) The shortage increases.
D) The shortage decreases.
فتح الحزمة
افتح القفل للوصول البطاقات البالغ عددها 139 في هذه المجموعة.
فتح الحزمة
k this deck
37
Suppose the quantity of nursing services demanded exceeds the quantity of nursing services supplied. The nursing wage rate will:
A) decrease.
B) increase.
C) not change.
D) none of the above
A) decrease.
B) increase.
C) not change.
D) none of the above
فتح الحزمة
افتح القفل للوصول البطاقات البالغ عددها 139 في هذه المجموعة.
فتح الحزمة
k this deck
38
Figure 2.1.2Refer to Figure 2.1.2. If the price of coffee decreases, from $7.50 to $6.00 per pound, which of the following will occur?
A) The quantity demanded of coffee will increase, from 6 to 7 million pounds per year.
B) The demand curve will shift to the right and the quantity demanded will increase to 10 million pounds per year.
C) Both moves, from A to B and then from B to C, will occur simultaneously.
D) It is possible that the market demand will show the move fro A to B, or that it moves directly from A to C.
فتح الحزمة
افتح القفل للوصول البطاقات البالغ عددها 139 في هذه المجموعة.
فتح الحزمة
k this deck
39
Figure 2.2.1Refer to Figure 2.2.1 above. If the price of $1.50 is a price imposed by the government, we can call it:
A) a price floor.
B) a price ceiling.
C) a socially optimal equilibrium price.
D) a fiscal price.
فتح الحزمة
افتح القفل للوصول البطاقات البالغ عددها 139 في هذه المجموعة.
فتح الحزمة
k this deck
40
Suppose there is currently a surplus of wheat on the world market. The problem of excess supply may be removed from the market by:
A) lowering the market price.
B) shifting the supply curve leftward.
C) shifting the demand curve leftward.
D) Both A and B are plausible actions.
A) lowering the market price.
B) shifting the supply curve leftward.
C) shifting the demand curve leftward.
D) Both A and B are plausible actions.
فتح الحزمة
افتح القفل للوصول البطاقات البالغ عددها 139 في هذه المجموعة.
فتح الحزمة
k this deck
41
Figure 2.3.3Refer to Figure 2.3.3 above. Which of the two panels best describes the trend in college costs from 1970 to 2016?
A) Panel (a)
B) Panel (b)
C) Both panels
D) Neither panel
فتح الحزمة
افتح القفل للوصول البطاقات البالغ عددها 139 في هذه المجموعة.
فتح الحزمة
k this deck
42
Example 2.2 in the textbook explains the source of wage inequality in the United States. In terms of supply and demand, the wage of skilled workers has:
A) decreased, because the supply has increased more than the increase in demand for those workers.
B) decreased, because the demand has decreased and the supply has increased.
C) increased, because the demand has increased faster than the increase in supply.
D) increased, because the demand has increased, while the supply has decreased.
فتح الحزمة
افتح القفل للوصول البطاقات البالغ عددها 139 في هذه المجموعة.
فتح الحزمة
k this deck
43
Which of the following would cause an unambiguous decrease in the real price of DVD players?
A) A shift to the right in the supply curve for DVD players and a shift to the right in the demand curve for DVD players
B) A shift to the right in the supply curve for DVD players and a shift to the left in the demand curve for DVD players
C) A shift to the left in the supply curve for DVD players and a shift to the right in the demand curve for DVD players
D) A shift to the left in the supply curve for DVD players and a shift to the left in the demand curve for DVD players
فتح الحزمة
افتح القفل للوصول البطاقات البالغ عددها 139 في هذه المجموعة.
فتح الحزمة
k this deck
44
From 1970 to 2017, the real price of eggs decreased and the total annual consumption of eggs decreased. Which of the following would cause an unambiguous decrease in the real price of eggs and an unambiguous decrease in the quantity of eggs consumed?
A) A shift to the right in the supply curve for eggs and a shift to the right in the demand curve for eggs
B) A shift to the left in the supply curve for eggs and a shift to the right in the demand curve for eggs
C) A shift to the left in the supply curve for eggs and a shift to the left in the demand curve for eggs
D) none of the above
فتح الحزمة
افتح القفل للوصول البطاقات البالغ عددها 139 في هذه المجموعة.
فتح الحزمة
k this deck
45
From 1970 to 2017, the real price of a college education increased, and total enrollment increased. Which of the following could have caused this increase in price and enrollment?
A) A shift to the right in the supply curve for college education and a shift to the left in the demand curve for college education
B) A shift to the left in the supply curve for college education and a shift to the right in the demand curve for college education
C) A shift to the left in the supply curve for college education and a shift to the left in the demand curve for college education
D) none of the above
فتح الحزمة
افتح القفل للوصول البطاقات البالغ عددها 139 في هذه المجموعة.
فتح الحزمة
k this deck
46
Figure 2.2.2Refer to Figure 2.2.2 above. An imposed price of $2.25 can be called:
A) a price ceiling.
B) a price floor.
C) a consumer-friendly price.
D) a price of equilibrium difference.
فتح الحزمة
افتح القفل للوصول البطاقات البالغ عددها 139 في هذه المجموعة.
فتح الحزمة
k this deck
47
Figure 2.3.1Refer to Figure 2.3.1. In Example 2.4, the textbook describes the impact of 9/11 on the real estate market in New York city. How does the sketch in figure 2.3.1 adapt to the described scenario?
A) Demand shifted from D1 to D2 and supply shifted from S1 to S2.
B) Demand shifted from D1 to D2 and supply shifted from S2 to S1.
C) Demand shifted from D2 to D1 and supply shifted from S1 to S2.
D) Demand shifted from D2 to D1 and supply shifted from S2 to S1.
فتح الحزمة
افتح القفل للوصول البطاقات البالغ عددها 139 في هذه المجموعة.
فتح الحزمة
k this deck
48
The inverse demand curve for product X is given by:
PX = 25 - 0.005Q + 0.15PY,
where PX represents price in dollars per unit, Q represents rate of sales in pounds per week, and PY represents selling price of another product Y in dollars per unit. The inverse supply curve of product X is given by: PX = 5 + 0.004Q.
a. Determine the equilibrium price and sales of X. Let PY = $10.
b. Determine whether X and Y are substitutes or complements.
فتح الحزمة
افتح القفل للوصول البطاقات البالغ عددها 139 في هذه المجموعة.
فتح الحزمة
k this deck
49
By 2020, automobile market analysts expect that the demand for electric autos will increase as buyers become more familiar with the technology. However, the costs of producing electric autos may increase because of higher costs for inputs (e.g., rare earth elements), or they may decrease as the manufacturers learn better assembly methods (i.e., learning by doing). What is the expected impact of these changes on the equilibrium price and quantity for electric autos?
A) Unambiguously higher equilibrium price and quantity
B) Unambiguously higher price, and equilibrium quantity may be higher or lower
C) Unambiguously higher quantity, and equilibrium price may be higher or lower
D) We cannot form any unambiguous expectations for either price or quantity.
A) Unambiguously higher equilibrium price and quantity
B) Unambiguously higher price, and equilibrium quantity may be higher or lower
C) Unambiguously higher quantity, and equilibrium price may be higher or lower
D) We cannot form any unambiguous expectations for either price or quantity.
فتح الحزمة
افتح القفل للوصول البطاقات البالغ عددها 139 في هذه المجموعة.
فتح الحزمة
k this deck
50
Which of the following will cause the price of beer to rise?
A) A shift to the right in the demand curve for beer
B) A shift to the left in the supply curve of beer
C) both A and B
D) none of the above
A) A shift to the right in the demand curve for beer
B) A shift to the left in the supply curve of beer
C) both A and B
D) none of the above
فتح الحزمة
افتح القفل للوصول البطاقات البالغ عددها 139 في هذه المجموعة.
فتح الحزمة
k this deck
51
From 1970 to 2017, the real price of eggs decreased. Which of the following would cause an unambiguous decrease in the real price of eggs?
A) A shift to the right in the supply curve for eggs and a shift to the right in the demand curve for eggs
B) A shift to the right in the supply curve for eggs and a shift to the left in the demand curve for eggs
C) A shift to the left in the supply curve for eggs and a shift to the right in the demand curve for eggs
D) A shift to the left in the supply curve for eggs and a shift to the left in the demand curve for eggs
فتح الحزمة
افتح القفل للوصول البطاقات البالغ عددها 139 في هذه المجموعة.
فتح الحزمة
k this deck
52
In example 2.3, the textbook shows a surprising trend in the relationship between the price of copper and the consumption of copper over time. From 1880 to 2016, which of the following ocurred?
A) The consumption of copper remained virtually unchanged, yet the price increases substantially.
B) The price of copper reflected precisely the market prediction that as consumption rose steadily over time, the price of copper rose at almost exactly the same rate.
C) The price of copper remained virtually unchanged while the consumption of copper rose exponentially.
D) While the price of copper rose substantially, the consumption of copper actually declined.
فتح الحزمة
افتح القفل للوصول البطاقات البالغ عددها 139 في هذه المجموعة.
فتح الحزمة
k this deck
53
The daily demand for hotel rooms on Manhattan Island in New York is given by the equation The daily supply of hotel rooms on Manhattan Island is given by the equation Diagram these demand and supply curves in the price and quantity space. What is the equilibrium price and quantity of hotel rooms on Manhattan Island?
The daily supply of hotel rooms on Manhattan Island is given by the equation Diagram these demand and supply curves in the price and quantity space. What is the equilibrium price and quantity of hotel rooms on Manhattan Island? فتح الحزمة
افتح القفل للوصول البطاقات البالغ عددها 139 في هذه المجموعة.
فتح الحزمة
k this deck
54
Figure 2.3.1The effect of the September 11 attacks on the World Trade Center on the market for office space in downtown Manhattan was that both the equilibrium price and the equilibrium quantity fell. What is the most likely explanation for this?
A) Supply and demand both shifted left, and the magnitude of the demand shift was greater.
B) Supply and demand both shifted left, and the magnitude of the supply shift was greater.
C) Supply shifted left, demand shifted right, and the magnitude of the demand shift was greater.
D) Supply shifted left, demand shifted right, and the magnitude of the supply shift was greater.
فتح الحزمة
افتح القفل للوصول البطاقات البالغ عددها 139 في هذه المجموعة.
فتح الحزمة
k this deck
55
Figure 2.3.2Figure 2.3.2 above is a reproduction of Figure 2.9 in the textbook, which describes the market for mineral resources across time. The downward-sloping line that crosses the equilibrium points is called:
A) the market decline curve.
B) the market rise path.
C) the long-run path of price and consumption.
D) the industry supply curve.
فتح الحزمة
افتح القفل للوصول البطاقات البالغ عددها 139 في هذه المجموعة.
فتح الحزمة
k this deck
56
Suppose a new discovery in computer manufacturing has just made computer production cheaper. Also, the popularity and usefulness of computers continues to grow. Use Supply and Demand analysis to predict how these shocks will affect equilibrium price and quantity of computers. Is there enough information to determine if market prices will rise or fall? Why?
فتح الحزمة
افتح القفل للوصول البطاقات البالغ عددها 139 في هذه المجموعة.
فتح الحزمة
k this deck
57
Example 2.2 in the textbook explains the source of wage inequality in the United States. In terms of supply and demand, the wage of unskilled workers has:
A) decreased, because the supply has increased more than the increase in demand for those workers.
B) decreased, because the demand has decreased, and the supply has increased.
C) increased, because the demand has increased faster than the increase in supply.
D) increased, because the demand has increased, while the supply has decreased.
فتح الحزمة
افتح القفل للوصول البطاقات البالغ عددها 139 في هذه المجموعة.
فتح الحزمة
k this deck
58
Figure 2.2.2Refer to Figure 2.2.2 above. If the price of $2.25 is an artificial price imposed by the government, and the government is expected to remove it, what will happen in this market?
A) There will a tendency for the price to be higher than the imposed price.
B) There will a tendency for the new price to be lower than the imposed price.
C) The new price would not be expected to by any different than the already imposed price.
D) The new price will tend to fluctuate above and below the equilibrium price of $2.00.
فتح الحزمة
افتح القفل للوصول البطاقات البالغ عددها 139 في هذه المجموعة.
فتح الحزمة
k this deck
59
Suppose that due to more stringent environmental regulation it becomes more expensive for steel production firms to operate. Also, recent technological advances in plastics has reduced the demand for steel products. Use Supply and Demand analysis to predict how these shocks will affect equilibrium price and quantity of steel. Can we say with certainty that the market price for steel will fall? Why?
فتح الحزمة
افتح القفل للوصول البطاقات البالغ عددها 139 في هذه المجموعة.
فتح الحزمة
k this deck
60
We observe that both the price of and quantity sold of golf balls are rising over time. This is due to:
A) continual improvements in the technology used to produce golf balls.
B) increases in the price of golf clubs over time.
C) decreases in membership fees for country clubs with golf facilities.
D) more stringent professional requirements on the quality of golf balls requiring producers to use more expensive raw materials.
فتح الحزمة
افتح القفل للوصول البطاقات البالغ عددها 139 في هذه المجموعة.
فتح الحزمة
k this deck
61
Figure 2.4.1Refer to Figure 2.4.1. Between points E and F, demand is:
A) completely inelastic.
B) inelastic, but not completely inelastic.
C) unit elastic.
D) elastic, but not infinitely elastic.
E) infinitely elastic.
فتح الحزمة
افتح القفل للوصول البطاقات البالغ عددها 139 في هذه المجموعة.
فتح الحزمة
k this deck
62
The cross-price elasticity of demand refers to:
A) a change in the demanded for two goods, following a change in the price of one good.
B) the substitution of one good for another as the prices of two goods change.
C) the value of price elasticity at which supply crosses demand.
D) the percentage change in the quantity demanded of one good resulting from a 1-percent increase in the price of another good.
فتح الحزمة
افتح القفل للوصول البطاقات البالغ عددها 139 في هذه المجموعة.
فتح الحزمة
k this deck
63
Which of the following represents the income elasticity of demand?
A)
B) +
C) ×
D) -
A)
B)
+C)
×D)
- فتح الحزمة
افتح القفل للوصول البطاقات البالغ عددها 139 في هذه المجموعة.
فتح الحزمة
k this deck
64
Figure 2.4.1Refer to Figure 2.4.1. Between two points near D, demand is:
A) completely inelastic.
B) inelastic, but not completely inelastic.
C) unit elastic.
D) elastic, but not infinitely elastic.
E) infinitely elastic.
فتح الحزمة
افتح القفل للوصول البطاقات البالغ عددها 139 في هذه المجموعة.
فتح الحزمة
k this deck
65
Figure 2.4.1Refer to Figure 2.4.1. At point A, demand is:
A) completely inelastic.
B) inelastic, but not completely inelastic.
C) unit elastic.
D) elastic, but not infinitely elastic.
E) infinitely elastic.
فتح الحزمة
افتح القفل للوصول البطاقات البالغ عددها 139 في هذه المجموعة.
فتح الحزمة
k this deck
66
Suppose the cable TV industry is currently unregulated. However, due to complaints from consumers that the price of cable TV is too high, the legislature is considering placing a price ceiling on cable TV below the current equilibrium price. Assuming the government does make this price ceiling law, please construct a diagram that shows the impact of this law on the cable TV market, and please briefly explain the effects on market prices and quantities with supply and demand analysis. Also, if the cable TV company is worried about disgruntling customers, the company may introduce a different type of programming that is cheaper for the company to provide yet is equally appealing to customers. What would be the effects of this action?
فتح الحزمة
افتح القفل للوصول البطاقات البالغ عددها 139 في هذه المجموعة.
فتح الحزمة
k this deck
67
Figure 2.4.2Refer to Figure 2.4.2 above. Which of the following best describes de demand curve in this figure?
A) Demand is infinitely elastic.
B) Demand is completely inelastic.
C) Demand becomes more inelastic the lower the price.
D) Demand becomes more elastic the lower the price.
فتح الحزمة
افتح القفل للوصول البطاقات البالغ عددها 139 في هذه المجموعة.
فتح الحزمة
k this deck
68
Suppose that the resale of tickets to professional football games is illegal in Missouri. Due to the high demand for Chiefs (who play in Kansas City, Missouri) tickets there is a shortage of tickets at the current ticket price. Given that the Chiefs will not raise the price at which they sell the tickets, what would be the result of allowing tickets to be resold in a secondary market at whatever price the market would support? If speculators entered the market and began buying tickets directly from the Chiefs in hopes of reselling the tickets later, what would happen to the line outside of the ticket offices when the tickets are initially sold?
فتح الحزمة
افتح القفل للوصول البطاقات البالغ عددها 139 في هذه المجموعة.
فتح الحزمة
k this deck
69
Historically, investors have considered gold commodities to be a good investment to preserve wealth in times of inflation. If investors are no longer worried about inflation and gold demand decreases, what do you expect will happen to gold prices? How would your answer change if you learn that a recent gold mine discovery will increase the supply of gold?
فتح الحزمة
افتح القفل للوصول البطاقات البالغ عددها 139 في هذه المجموعة.
فتح الحزمة
k this deck
70
Elasticity measures:
A) the slope of a demand curve.
B) the inverse of the slope of a demand curve.
C) the percentage change in one variable in response to a one percent increase in another variable.
D) sensitivity of price to a change in quantity.
A) the slope of a demand curve.
B) the inverse of the slope of a demand curve.
C) the percentage change in one variable in response to a one percent increase in another variable.
D) sensitivity of price to a change in quantity.
فتح الحزمة
افتح القفل للوصول البطاقات البالغ عددها 139 في هذه المجموعة.
فتح الحزمة
k this deck
71
The income elasticity of demand refers to:
A) a change in income following a change in quantity demanded.
B) the substitution of one good for another as income changes.
C) the percentage change in quantity demanded resulting from a 1-percent increase in income.
D) the change in income required for quantity demanded to change by 1%.
A) a change in income following a change in quantity demanded.
B) the substitution of one good for another as income changes.
C) the percentage change in quantity demanded resulting from a 1-percent increase in income.
D) the change in income required for quantity demanded to change by 1%.
فتح الحزمة
افتح القفل للوصول البطاقات البالغ عددها 139 في هذه المجموعة.
فتح الحزمة
k this deck
72
The currency used by the Confederate States of America during its brief existence from 1861 to 1865 has become a collector's item today. The Confederate Currency supply is perfectly inelastic. As the demand for the collectible increases and some of the old currency is destroyed or no longer of value as a collectible, what happens to the market price?
فتح الحزمة
افتح القفل للوصول البطاقات البالغ عددها 139 في هذه المجموعة.
فتح الحزمة
k this deck
73
Figure 2.4.1Refer to Figure 2.4.1. Between points B and C, demand is:
A) small.
B) inelastic, but not completely inelastic.
C) unit elastic.
D) elastic, but not infinitely elastic.
E) infinitely elastic.
فتح الحزمة
افتح القفل للوصول البطاقات البالغ عددها 139 في هذه المجموعة.
فتح الحزمة
k this deck
74
Figure 2.4.3Refer to Figure 2.4.3 above. The price elasticity of demand along this demand curve is equal to:
A) whatever the value of the price is.
B) infinity.
C) zero.
D) an undetermined value.
فتح الحزمة
افتح القفل للوصول البطاقات البالغ عددها 139 في هذه المجموعة.
فتح الحزمة
k this deck
75
Figure 2.4.1Refer to Figure 2.4.1. At point E, demand is:
A) completely inelastic.
B) inelastic, but not completely inelastic.
C) unit elastic.
D) elastic, but not infinitely elastic.
E) infinitely elastic.
فتح الحزمة
افتح القفل للوصول البطاقات البالغ عددها 139 في هذه المجموعة.
فتح الحزمة
k this deck
76
Figure 2.4.3Refer to Figure 2.4.3 above. Which of the following best describes de demand curve in this figure?
A) Demand is infinitely elastic.
B) Demand is completely inelastic.
C) Demand becomes more inelastic the lower the price.
D) Demand becomes more elastic the lower the price.
فتح الحزمة
افتح القفل للوصول البطاقات البالغ عددها 139 في هذه المجموعة.
فتح الحزمة
k this deck
77
Which of the following represents the price elasticity of demand?
A)
B) +
C) ×
D) -
A)
B)
+C)
×D)
- فتح الحزمة
افتح القفل للوصول البطاقات البالغ عددها 139 في هذه المجموعة.
فتح الحزمة
k this deck
78
Along any downward-sloping straight-line demand curve:
A) both the price elasticity and slope vary.
B) the price elasticity varies, but the slope is constant.
C) the slope varies, but the price elasticity is constant.
D) both the price elasticity and slope are constant.
A) both the price elasticity and slope vary.
B) the price elasticity varies, but the slope is constant.
C) the slope varies, but the price elasticity is constant.
D) both the price elasticity and slope are constant.
فتح الحزمة
افتح القفل للوصول البطاقات البالغ عددها 139 في هذه المجموعة.
فتح الحزمة
k this deck
79
Figure 2.4.1Refer to Figure 2.4.1. Which of the following statements about the demand curve in the figure?
A) Demand is infinitely elastic.
B) Demand is completely inelastic.
C) Demand becomes more inelastic as price declines.
D) Demand becomes more elastic as price declines.
فتح الحزمة
افتح القفل للوصول البطاقات البالغ عددها 139 في هذه المجموعة.
فتح الحزمة
k this deck
80
Figure 2.4.2Refer to Figure 2.4.2 above. Fill in the blanks. For any price higher than P*, the quantity demanded ________, while for any price lower than P*, the quantity demanded ________.
A) drops to zero; increases without limit
B) drops to zero; remains constant
C) increases without limit; does not exist
D) does not exist; is unpredictable
فتح الحزمة
افتح القفل للوصول البطاقات البالغ عددها 139 في هذه المجموعة.
فتح الحزمة
k this deck
فتح الحزمة
افتح القفل للوصول البطاقات البالغ عددها 139 في هذه المجموعة.


