Deck 13: Consumption and the Aggregate Expenditures Model
ملء الشاشة (f)
سؤال
سؤال
سؤال
سؤال
سؤال
سؤال
سؤال
سؤال
سؤال
سؤال
سؤال
سؤال
سؤال
سؤال
سؤال
سؤال
سؤال
سؤال
سؤال
سؤال
سؤال
Figure 13-1 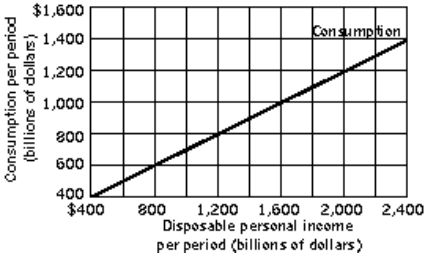
Refer to Figure 13-1. When disposable personal income is $2,000 billion, consumption is
A) $400 billion.
B) $1,000 billion.
C) $1,200 billion.
D) $1,600 billion.
Refer to Figure 13-1. When disposable personal income is $2,000 billion, consumption is
A) $400 billion.
B) $1,000 billion.
C) $1,200 billion.
D) $1,600 billion.
سؤال
سؤال
Table 13-1

Refer to Table 13-1. When disposable personal income is $400, what is the amount of personal saving?
A) −$40
B) −$20
C) $0
D) $20
Refer to Table 13-1. When disposable personal income is $400, what is the amount of personal saving?
A) −$40
B) −$20
C) $0
D) $20
سؤال
سؤال
Table 13-1
Refer to Table 13-1. When disposable personal income is $100, what is the amount of personal saving?
A) −$40
B) −$20
C) $0
D) $20
Refer to Table 13-1. When disposable personal income is $100, what is the amount of personal saving?
A) −$40
B) −$20
C) $0
D) $20
سؤال
Figure 13-1
Refer to Figure 13-1. The marginal propensity to consume is
A) 0.25.
B) 0.50.
C) 0.60.
D) 0.67.
Refer to Figure 13-1. The marginal propensity to consume is
A) 0.25.
B) 0.50.
C) 0.60.
D) 0.67.
سؤال
سؤال
سؤال
Figure 13-1
Refer to Figure 13-1. If disposable personal income is $400 billion, what is the amount of personal saving?
A) −$200 billion
B) $0
C) $200 billion
D) $400 billion
Refer to Figure 13-1. If disposable personal income is $400 billion, what is the amount of personal saving?
A) −$200 billion
B) $0
C) $200 billion
D) $400 billion
سؤال
سؤال
Figure 13-1
Refer to Figure 13-1. When disposable personal income is $2,000 billion,
A) personal saving is $1,200 billion.
B) consumption is $1,600 billion.
C) saving is $800 billion.
D) consumption is $800 billion.
Refer to Figure 13-1. When disposable personal income is $2,000 billion,
A) personal saving is $1,200 billion.
B) consumption is $1,600 billion.
C) saving is $800 billion.
D) consumption is $800 billion.
سؤال
Figure 13-1
Refer to Figure 13-1. Assuming that the relationship between consumption and disposable personal income remains linear throughout its entire range, if disposable personal income were zero, what would personal saving be?
A) −$200 billion
B) $0
C) $200 billion
D) $400 billion
Refer to Figure 13-1. Assuming that the relationship between consumption and disposable personal income remains linear throughout its entire range, if disposable personal income were zero, what would personal saving be?
A) −$200 billion
B) $0
C) $200 billion
D) $400 billion
سؤال
Table 13-1
Refer to Table 13-1. Calculate the marginal propensity to consume based on the information in the table.
A) 0.00
B) 0.20
C) 0.80
D) 1.40
Refer to Table 13-1. Calculate the marginal propensity to consume based on the information in the table.
A) 0.00
B) 0.20
C) 0.80
D) 1.40
سؤال
Figure 13-1
Refer to Figure 13-1. Assuming that the relationship between consumption and disposable personal income remains linear throughout its entire range, what would the level of consumption be if disposable personal income were zero?
A) −$200 billion
B) $0
C) $100 billion
D) $200 billion
Refer to Figure 13-1. Assuming that the relationship between consumption and disposable personal income remains linear throughout its entire range, what would the level of consumption be if disposable personal income were zero?
A) −$200 billion
B) $0
C) $100 billion
D) $200 billion
سؤال
Figure 13-1
Refer to Figure 13-1. The marginal propensity to save is
A) 0.25.
B) 0.50.
C) 0.60.
D) cannot be determined without a savings function.
Refer to Figure 13-1. The marginal propensity to save is
A) 0.25.
B) 0.50.
C) 0.60.
D) cannot be determined without a savings function.
سؤال
سؤال
Table 13-1
Refer to Table 13-1. Negative personal saving occurs when disposable personal income is
A) equal to $300.
B) greater than $300.
C) less than $300.
D) between $300 and $400.
Refer to Table 13-1. Negative personal saving occurs when disposable personal income is
A) equal to $300.
B) greater than $300.
C) less than $300.
D) between $300 and $400.
سؤال
Table 13-1
Refer to Table 13-1. When disposable personal income is $300, what is the amount of personal saving?
A) −$40
B) −$20
C) $0
D) $20
Refer to Table 13-1. When disposable personal income is $300, what is the amount of personal saving?
A) −$40
B) −$20
C) $0
D) $20
سؤال
Figure 13-1
Refer to Figure 13-1. When disposable personal income goes up by $400 billion, personal saving increases by
A) $0.
B) $100 billion.
C) $200 billion.
D) $400 billion.
Refer to Figure 13-1. When disposable personal income goes up by $400 billion, personal saving increases by
A) $0.
B) $100 billion.
C) $200 billion.
D) $400 billion.
سؤال
Figure 13-1
Refer to Figure 13-1. When disposable personal income is $1,200 billion, consumption is
A) $600 billion.
B) $800 billion.
C) $1,200 billion.
D) $2,000 billion.
Refer to Figure 13-1. When disposable personal income is $1,200 billion, consumption is
A) $600 billion.
B) $800 billion.
C) $1,200 billion.
D) $2,000 billion.
سؤال
سؤال
سؤال
سؤال
Figure 13-3 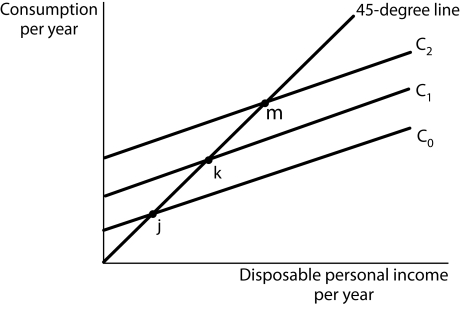
Refer to Figure 13-3. Suppose the consumption function is given by curve C1. Which of the following will cause an upward shift to curve C2?
A) a decrease in wealth
B) an increase in price level
C) an increase in interest rates
D) an increase in consumer confidence
Refer to Figure 13-3. Suppose the consumption function is given by curve C1. Which of the following will cause an upward shift to curve C2?
A) a decrease in wealth
B) an increase in price level
C) an increase in interest rates
D) an increase in consumer confidence
سؤال
سؤال
سؤال
Figure 13-2 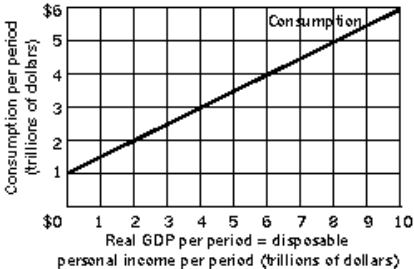
Refer to Figure 13-2. If real GDP were $12 trillion, consumption equals
A) 5 trillion.
B) 7 trillion.
C) 9 trillion.
D) 11 trillion.
Refer to Figure 13-2. If real GDP were $12 trillion, consumption equals
A) 5 trillion.
B) 7 trillion.
C) 9 trillion.
D) 11 trillion.
سؤال
Figure 13-3
Refer to Figure 13-3. Upward shifts of the consumption function, for example from C0 to C1 to C2 demonstrate
A) an increase in the marginal propensity to save.
B) increases in the amount of consumption for a given level of disposable income.
C) increases in the amount of disposable income available for consumption.
D) an increase in the marginal propensity to save
سؤال
Figure 13-3
Refer to Figure 13-3. Suppose the consumption function is given by curve C1. What will cause an upward shift to curve C2?
A) an increase in the amount consumed as disposable personal income increases.
B) an increase in consumption at any level of disposable personal income
C) an increase in the price level
D) an increase in transfer payments
سؤال
Figure 13-2
Refer to Figure 13-2. If real GDP is $8 trillion, saving equals
A) $4 trillion.
B) $3 trillion.
C) $2 trillion.
D) $1 trillion.
Refer to Figure 13-2. If real GDP is $8 trillion, saving equals
A) $4 trillion.
B) $3 trillion.
C) $2 trillion.
D) $1 trillion.
سؤال
Figure 13-2
Refer to Figure 13-2. The marginal propensity to consume equals
A) 0.
B) 0.5.
C) 1.0.
D) 2.0.
Refer to Figure 13-2. The marginal propensity to consume equals
A) 0.
B) 0.5.
C) 1.0.
D) 2.0.
سؤال
سؤال
سؤال
Figure 13-2
Refer to Figure 13-2. If real GDP is $4 trillion, consumption equals
A) 0.75 trillion.
B) 1 trillion.
C) 3 trillion.
D) 4 trillion.
Refer to Figure 13-2. If real GDP is $4 trillion, consumption equals
A) 0.75 trillion.
B) 1 trillion.
C) 3 trillion.
D) 4 trillion.
سؤال
سؤال
سؤال
Figure 13-2
Refer to Figure 13-2. An equation for the consumption function is
A) C = 1 + Y.
B) C = Y.
C) C = 1 + 2Y.
D) C = 1 + 0.5Y.
Refer to Figure 13-2. An equation for the consumption function is
A) C = 1 + Y.
B) C = Y.
C) C = 1 + 2Y.
D) C = 1 + 0.5Y.
سؤال
سؤال
سؤال
سؤال
سؤال
سؤال
سؤال
سؤال
سؤال
سؤال
Figure 13-3
Refer to Figure 13-3. Suppose the consumption function is given by curve C1. Which of the following will cause a downward shift to curve C1?
A) a stock market crash that decreases household wealth
B) a decrease in price level
C) an increase in withholding tax rate
D) rising optimism about economic conditions
سؤال
سؤال
سؤال
سؤال
سؤال
سؤال
سؤال
سؤال
سؤال
سؤال
سؤال
سؤال
سؤال
Figure 13-3
Refer to Figure 13-3. Which of the following statements is false?
A) At points j, k, and m, consumers spend all their disposable income on consumption.
B) The amount of consumption is positive even when disposable income equals zero.
C) The slope of the consumption function is the marginal propensity to consume.
D) At points j, k, and m, the marginal propensity to save equals zero.

فتح الحزمة
قم بالتسجيل لفتح البطاقات في هذه المجموعة!
Unlock Deck
Unlock Deck
1/219
العب
ملء الشاشة (f)
Deck 13: Consumption and the Aggregate Expenditures Model
1
Suppose when disposable personal income increases from $10,000 to $15,000, consumption increases from $9,000 to $12,000. What is the marginal propensity to consume?
A) 0.2
B) 0.4
C) 0.6
D) 0.8
A) 0.2
B) 0.4
C) 0.6
D) 0.8
0.6
2
The bulk of aggregate demand in the United States consists of
A) consumption.
B) investment.
C) government spending.
D) net exports.
A) consumption.
B) investment.
C) government spending.
D) net exports.
consumption.
3
Suppose when disposable personal income increases from $10,000 to $15,000, consumption increases from $9,000 to $13,000. What is the marginal propensity to consume?
A) 0.2
B) 0.4
C) 0.6
D) 0.8
A) 0.2
B) 0.4
C) 0.6
D) 0.8
0.8
4
The amount of consumption at each level of disposable personal income, all other determinants of consumption unchanged, is shown by the
A) aggregate demand curve.
B) consumption function.
C) price-consumption curve.
D) income curve.
A) aggregate demand curve.
B) consumption function.
C) price-consumption curve.
D) income curve.
فتح الحزمة
افتح القفل للوصول البطاقات البالغ عددها 219 في هذه المجموعة.
فتح الحزمة
k this deck
5
The income households receive less the personal income taxes they pay is
A) net savings.
B) disposable personal income.
C) gross private domestic investment.
D) gersonal consumption.
A) net savings.
B) disposable personal income.
C) gross private domestic investment.
D) gersonal consumption.
فتح الحزمة
افتح القفل للوصول البطاقات البالغ عددها 219 في هذه المجموعة.
فتح الحزمة
k this deck
6
Which of the following is true?
I. 1 − MPS = MPC where MPS = marginal propensity to save and MPC = marginal propensity to consume.
II. personal saving + consumption = gross income
III. ∆disposable income = ∆saving + ∆consumption where ∆ = change in
A) I, II, and III
B) I and II only
C) I and III only
D) II and III only
I. 1 − MPS = MPC where MPS = marginal propensity to save and MPC = marginal propensity to consume.
II. personal saving + consumption = gross income
III. ∆disposable income = ∆saving + ∆consumption where ∆ = change in
A) I, II, and III
B) I and II only
C) I and III only
D) II and III only
فتح الحزمة
افتح القفل للوصول البطاقات البالغ عددها 219 في هذه المجموعة.
فتح الحزمة
k this deck
7
The marginal propensity to consume is given by
A) the change in consumption divided by the change in saving.
B) the change in consumption divided by the change in disposable personal income.
C) consumption divided by the change in disposable personal income.
D) consumption divided by disposable income.
A) the change in consumption divided by the change in saving.
B) the change in consumption divided by the change in disposable personal income.
C) consumption divided by the change in disposable personal income.
D) consumption divided by disposable income.
فتح الحزمة
افتح القفل للوصول البطاقات البالغ عددها 219 في هذه المجموعة.
فتح الحزمة
k this deck
8
Suppose when disposable personal income increases from $10,000 to $15,000, consumption increases from $9,000 to $13,000. What is the marginal propensity to save?
A) 0.2
B) 0.4
C) 0.6
D) 0.8
A) 0.2
B) 0.4
C) 0.6
D) 0.8
فتح الحزمة
افتح القفل للوصول البطاقات البالغ عددها 219 في هذه المجموعة.
فتح الحزمة
k this deck
9
The consumption function shows
A) the amount of consumption at each level of aggregate demand, holding all other determinants constant.
B) the amount of consumption at each price level, holding all other determinants constant.
C) the amount of consumption at each level of disposable income, holding all other determinants constant.
D) the amount of consumption at each wage rate holding all other determinants constant.
فتح الحزمة
افتح القفل للوصول البطاقات البالغ عددها 219 في هذه المجموعة.
فتح الحزمة
k this deck
10
The marginal propensity to consume is the
A) slope of the saving function.
B) slope of the consumption-saving curve.
C) slope of the saving-investment curve.
D) change in consumption divided by the change in disposable personal income.
A) slope of the saving function.
B) slope of the consumption-saving curve.
C) slope of the saving-investment curve.
D) change in consumption divided by the change in disposable personal income.
فتح الحزمة
افتح القفل للوصول البطاقات البالغ عددها 219 في هذه المجموعة.
فتح الحزمة
k this deck
11
The saving function shows
A) the amount of saving at each level of aggregate demand, holding all other determinants of saving constant.
B) the amount of saving on at each level of disposable income, holding all other determinants of saving constant.
C) the amount of saving at each price level, holding all other determinants of saving constant.
D) the amount of saving at each wage rate, holding all other determinants of saving constant.
فتح الحزمة
افتح القفل للوصول البطاقات البالغ عددها 219 في هذه المجموعة.
فتح الحزمة
k this deck
12
An increase in aggregate demand causes an increase in
A) income, which in turn induces an increase in consumption.
B) investment, which in turn induces an increase in consumption.
C) government, which in turn induces an increase in net exports.
D) consumption, which in turn induces an increase in price.
A) income, which in turn induces an increase in consumption.
B) investment, which in turn induces an increase in consumption.
C) government, which in turn induces an increase in net exports.
D) consumption, which in turn induces an increase in price.
فتح الحزمة
افتح القفل للوصول البطاقات البالغ عددها 219 في هذه المجموعة.
فتح الحزمة
k this deck
13
Personal saving equals
A) gross domestic income − consumption.
B) personal disposable income − consumption.
C) gross domestic product − consumption.
D) personal disposable income − taxes − consumption.
A) gross domestic income − consumption.
B) personal disposable income − consumption.
C) gross domestic product − consumption.
D) personal disposable income − taxes − consumption.
فتح الحزمة
افتح القفل للوصول البطاقات البالغ عددها 219 في هذه المجموعة.
فتح الحزمة
k this deck
14
The saving function expresses the relationship between
A) personal saving and consumption.
B) gross domestic income and saving.
C) disposable personal income and saving.
D) wage income and personal saving.
A) personal saving and consumption.
B) gross domestic income and saving.
C) disposable personal income and saving.
D) wage income and personal saving.
فتح الحزمة
افتح القفل للوصول البطاقات البالغ عددها 219 في هذه المجموعة.
فتح الحزمة
k this deck
15
Suppose when disposable personal income increases from $10,000 to $15,000, consumption increases from $9,000 to $12,000. What is the marginal propensity to save?
A) 0.2
B) 0.4
C) 0.6
D) 0.8
A) 0.2
B) 0.4
C) 0.6
D) 0.8
فتح الحزمة
افتح القفل للوصول البطاقات البالغ عددها 219 في هذه المجموعة.
فتح الحزمة
k this deck
16
During an economic downturn, households respond to a decline in income by
A) reducing taxes.
B) reducing consumption.
C) increasing the quantity of labor supplied.
D) negotiating higher wages.
A) reducing taxes.
B) reducing consumption.
C) increasing the quantity of labor supplied.
D) negotiating higher wages.
فتح الحزمة
افتح القفل للوصول البطاقات البالغ عددها 219 في هذه المجموعة.
فتح الحزمة
k this deck
17
The marginal propensity to consume is the
A) slope of the saving function.
B) slope of the consumption function.
C) proportion of disposable personal income used for consumption.
D) change in consumption divided by the change in saving.
A) slope of the saving function.
B) slope of the consumption function.
C) proportion of disposable personal income used for consumption.
D) change in consumption divided by the change in saving.
فتح الحزمة
افتح القفل للوصول البطاقات البالغ عددها 219 في هذه المجموعة.
فتح الحزمة
k this deck
18
Disposable personal income is
A) the income households receive after paying personal taxes and personal debt.
B) the income households receive after paying personal taxes and saving.
C) the income households receive after paying personal taxes and purchasing necessities.
D) the income households receive that is available for consumption and saving.
فتح الحزمة
افتح القفل للوصول البطاقات البالغ عددها 219 في هذه المجموعة.
فتح الحزمة
k this deck
19
Disposable personal income is
A) the income households receive after paying personal taxes and personal debt.
B) the income households earn from supplying labor services for the production of aggregate output.
C) the income households receive after paying personal taxes.
D) the income households have leftover after paying personal taxes and purchasing necessities.
فتح الحزمة
افتح القفل للوصول البطاقات البالغ عددها 219 في هذه المجموعة.
فتح الحزمة
k this deck
20
The consumption function expresses the
A) purposes of consumption.
B) relationship between consumption and prices.
C) relationship between consumption and saving.
D) relationship between consumption and disposable personal income.
A) purposes of consumption.
B) relationship between consumption and prices.
C) relationship between consumption and saving.
D) relationship between consumption and disposable personal income.
فتح الحزمة
افتح القفل للوصول البطاقات البالغ عددها 219 في هذه المجموعة.
فتح الحزمة
k this deck
21
Figure 13-1
Refer to Figure 13-1. When disposable personal income is $2,000 billion, consumption is
A) $400 billion.
B) $1,000 billion.
C) $1,200 billion.
D) $1,600 billion.
Refer to Figure 13-1. When disposable personal income is $2,000 billion, consumption is
A) $400 billion.
B) $1,000 billion.
C) $1,200 billion.
D) $1,600 billion.
فتح الحزمة
افتح القفل للوصول البطاقات البالغ عددها 219 في هذه المجموعة.
فتح الحزمة
k this deck
22
The amount of consumption that would take place if real GDP were zero is called
A) induced consumption.
B) exogenous consumption.
C) autonomous consumption.
D) break even consumption.
A) induced consumption.
B) exogenous consumption.
C) autonomous consumption.
D) break even consumption.
فتح الحزمة
افتح القفل للوصول البطاقات البالغ عددها 219 في هذه المجموعة.
فتح الحزمة
k this deck
23
Table 13-1
Refer to Table 13-1. When disposable personal income is $400, what is the amount of personal saving?
A) −$40
B) −$20
C) $0
D) $20
Refer to Table 13-1. When disposable personal income is $400, what is the amount of personal saving?
A) −$40
B) −$20
C) $0
D) $20
فتح الحزمة
افتح القفل للوصول البطاقات البالغ عددها 219 في هذه المجموعة.
فتح الحزمة
k this deck
24
The relationship between personal saving and the level of disposable personal income is shown by the
A) supply of savings curve.
B) consumption function.
C) saving function.
D) personal investment schedule.
A) supply of savings curve.
B) consumption function.
C) saving function.
D) personal investment schedule.
فتح الحزمة
افتح القفل للوصول البطاقات البالغ عددها 219 في هذه المجموعة.
فتح الحزمة
k this deck
25
Table 13-1
Refer to Table 13-1. When disposable personal income is $100, what is the amount of personal saving?
A) −$40
B) −$20
C) $0
D) $20
Refer to Table 13-1. When disposable personal income is $100, what is the amount of personal saving?
A) −$40
B) −$20
C) $0
D) $20
فتح الحزمة
افتح القفل للوصول البطاقات البالغ عددها 219 في هذه المجموعة.
فتح الحزمة
k this deck
26
Figure 13-1
Refer to Figure 13-1. The marginal propensity to consume is
A) 0.25.
B) 0.50.
C) 0.60.
D) 0.67.
Refer to Figure 13-1. The marginal propensity to consume is
A) 0.25.
B) 0.50.
C) 0.60.
D) 0.67.
فتح الحزمة
افتح القفل للوصول البطاقات البالغ عددها 219 في هذه المجموعة.
فتح الحزمة
k this deck
27
In graph that shows disposable income on the horizontal axis and consumption on the vertical axis, at every point on the 45-degree line,
A) the value of disposable income equals the sum of personal saving and consumption.
B) the value of disposable income equals consumption.
C) the value of disposable income equals personal saving.
D) the value of disposable income and consumption equals 1.
A) the value of disposable income equals the sum of personal saving and consumption.
B) the value of disposable income equals consumption.
C) the value of disposable income equals personal saving.
D) the value of disposable income and consumption equals 1.
فتح الحزمة
افتح القفل للوصول البطاقات البالغ عددها 219 في هذه المجموعة.
فتح الحزمة
k this deck
28
The marginal propensity to save is given by
A) the change in saving divided by the change in consumption.
B) saving divided by the change in disposable personal income.
C) saving divided by disposable income.
D) the change in saving divided by the change in disposable personal income.
A) the change in saving divided by the change in consumption.
B) saving divided by the change in disposable personal income.
C) saving divided by disposable income.
D) the change in saving divided by the change in disposable personal income.
فتح الحزمة
افتح القفل للوصول البطاقات البالغ عددها 219 في هذه المجموعة.
فتح الحزمة
k this deck
29
Figure 13-1
Refer to Figure 13-1. If disposable personal income is $400 billion, what is the amount of personal saving?
A) −$200 billion
B) $0
C) $200 billion
D) $400 billion
Refer to Figure 13-1. If disposable personal income is $400 billion, what is the amount of personal saving?
A) −$200 billion
B) $0
C) $200 billion
D) $400 billion
فتح الحزمة
افتح القفل للوصول البطاقات البالغ عددها 219 في هذه المجموعة.
فتح الحزمة
k this deck
30
Personal saving is
A) total income not spent on consumption.
B) disposable personal income not spent on consumption.
C) found by subtracting consumption from disposable personal income.
D) disposable income spent on investment.
A) total income not spent on consumption.
B) disposable personal income not spent on consumption.
C) found by subtracting consumption from disposable personal income.
D) disposable income spent on investment.
فتح الحزمة
افتح القفل للوصول البطاقات البالغ عددها 219 في هذه المجموعة.
فتح الحزمة
k this deck
31
Figure 13-1
Refer to Figure 13-1. When disposable personal income is $2,000 billion,
A) personal saving is $1,200 billion.
B) consumption is $1,600 billion.
C) saving is $800 billion.
D) consumption is $800 billion.
Refer to Figure 13-1. When disposable personal income is $2,000 billion,
A) personal saving is $1,200 billion.
B) consumption is $1,600 billion.
C) saving is $800 billion.
D) consumption is $800 billion.
فتح الحزمة
افتح القفل للوصول البطاقات البالغ عددها 219 في هذه المجموعة.
فتح الحزمة
k this deck
32
Figure 13-1
Refer to Figure 13-1. Assuming that the relationship between consumption and disposable personal income remains linear throughout its entire range, if disposable personal income were zero, what would personal saving be?
A) −$200 billion
B) $0
C) $200 billion
D) $400 billion
Refer to Figure 13-1. Assuming that the relationship between consumption and disposable personal income remains linear throughout its entire range, if disposable personal income were zero, what would personal saving be?
A) −$200 billion
B) $0
C) $200 billion
D) $400 billion
فتح الحزمة
افتح القفل للوصول البطاقات البالغ عددها 219 في هذه المجموعة.
فتح الحزمة
k this deck
33
Table 13-1
Refer to Table 13-1. Calculate the marginal propensity to consume based on the information in the table.
A) 0.00
B) 0.20
C) 0.80
D) 1.40
Refer to Table 13-1. Calculate the marginal propensity to consume based on the information in the table.
A) 0.00
B) 0.20
C) 0.80
D) 1.40
فتح الحزمة
افتح القفل للوصول البطاقات البالغ عددها 219 في هذه المجموعة.
فتح الحزمة
k this deck
34
Figure 13-1
Refer to Figure 13-1. Assuming that the relationship between consumption and disposable personal income remains linear throughout its entire range, what would the level of consumption be if disposable personal income were zero?
A) −$200 billion
B) $0
C) $100 billion
D) $200 billion
Refer to Figure 13-1. Assuming that the relationship between consumption and disposable personal income remains linear throughout its entire range, what would the level of consumption be if disposable personal income were zero?
A) −$200 billion
B) $0
C) $100 billion
D) $200 billion
فتح الحزمة
افتح القفل للوصول البطاقات البالغ عددها 219 في هذه المجموعة.
فتح الحزمة
k this deck
35
Figure 13-1
Refer to Figure 13-1. The marginal propensity to save is
A) 0.25.
B) 0.50.
C) 0.60.
D) cannot be determined without a savings function.
Refer to Figure 13-1. The marginal propensity to save is
A) 0.25.
B) 0.50.
C) 0.60.
D) cannot be determined without a savings function.
فتح الحزمة
افتح القفل للوصول البطاقات البالغ عددها 219 في هذه المجموعة.
فتح الحزمة
k this deck
36
Let real GDP =Y = Yd, and the consumption function is C = $1,000 + .06Y. JWhat is the value of autonomous consumption (A) and what is the marginal propensity to consume (MPC)?
A) A = $600; MPC = 0.4
B) A = $1,000; MPC = 0.6
C) A = $1,600; MPC = 2.5
D) A = $2,500; MPC = 0.6
A) A = $600; MPC = 0.4
B) A = $1,000; MPC = 0.6
C) A = $1,600; MPC = 2.5
D) A = $2,500; MPC = 0.6
فتح الحزمة
افتح القفل للوصول البطاقات البالغ عددها 219 في هذه المجموعة.
فتح الحزمة
k this deck
37
Table 13-1
Refer to Table 13-1. Negative personal saving occurs when disposable personal income is
A) equal to $300.
B) greater than $300.
C) less than $300.
D) between $300 and $400.
Refer to Table 13-1. Negative personal saving occurs when disposable personal income is
A) equal to $300.
B) greater than $300.
C) less than $300.
D) between $300 and $400.
فتح الحزمة
افتح القفل للوصول البطاقات البالغ عددها 219 في هذه المجموعة.
فتح الحزمة
k this deck
38
Table 13-1
Refer to Table 13-1. When disposable personal income is $300, what is the amount of personal saving?
A) −$40
B) −$20
C) $0
D) $20
Refer to Table 13-1. When disposable personal income is $300, what is the amount of personal saving?
A) −$40
B) −$20
C) $0
D) $20
فتح الحزمة
افتح القفل للوصول البطاقات البالغ عددها 219 في هذه المجموعة.
فتح الحزمة
k this deck
39
Figure 13-1
Refer to Figure 13-1. When disposable personal income goes up by $400 billion, personal saving increases by
A) $0.
B) $100 billion.
C) $200 billion.
D) $400 billion.
Refer to Figure 13-1. When disposable personal income goes up by $400 billion, personal saving increases by
A) $0.
B) $100 billion.
C) $200 billion.
D) $400 billion.
فتح الحزمة
افتح القفل للوصول البطاقات البالغ عددها 219 في هذه المجموعة.
فتح الحزمة
k this deck
40
Figure 13-1
Refer to Figure 13-1. When disposable personal income is $1,200 billion, consumption is
A) $600 billion.
B) $800 billion.
C) $1,200 billion.
D) $2,000 billion.
Refer to Figure 13-1. When disposable personal income is $1,200 billion, consumption is
A) $600 billion.
B) $800 billion.
C) $1,200 billion.
D) $2,000 billion.
فتح الحزمة
افتح القفل للوصول البطاقات البالغ عددها 219 في هذه المجموعة.
فتح الحزمة
k this deck
41
Suppose the consumption function is C = $500 + 0.8Y. If Y = $1,000, then induced consumption is
A) $500.
B) $800.
C) $1,000.
D) $1,300.
A) $500.
B) $800.
C) $1,000.
D) $1,300.
فتح الحزمة
افتح القفل للوصول البطاقات البالغ عددها 219 في هذه المجموعة.
فتح الحزمة
k this deck
42
The assertion that consumption depends on expected average annual income is called
A) permanent income.
B) the current income hypothesis.
C) current income.
D) the permanent income hypothesis.
A) permanent income.
B) the current income hypothesis.
C) current income.
D) the permanent income hypothesis.
فتح الحزمة
افتح القفل للوصول البطاقات البالغ عددها 219 في هذه المجموعة.
فتح الحزمة
k this deck
43
Suppose the consumption function is C = $500 + 0.8Y. If Y = $1,000, what is the amount of consumption?
A) $300
B) $500
C) $1,000
D) $1,300
A) $300
B) $500
C) $1,000
D) $1,300
فتح الحزمة
افتح القفل للوصول البطاقات البالغ عددها 219 في هذه المجموعة.
فتح الحزمة
k this deck
44
Figure 13-3
Refer to Figure 13-3. Suppose the consumption function is given by curve C1. Which of the following will cause an upward shift to curve C2?
A) a decrease in wealth
B) an increase in price level
C) an increase in interest rates
D) an increase in consumer confidence
Refer to Figure 13-3. Suppose the consumption function is given by curve C1. Which of the following will cause an upward shift to curve C2?
A) a decrease in wealth
B) an increase in price level
C) an increase in interest rates
D) an increase in consumer confidence
فتح الحزمة
افتح القفل للوصول البطاقات البالغ عددها 219 في هذه المجموعة.
فتح الحزمة
k this deck
45
According to the current income hypothesis,
A) a change in income regarded as temporary will not affect consumption much since it will have little effect on average lifetime income.
B) regardless of whether a change in disposable personal income is permanent or temporary; people will change consumption by moving along the consumption function.
C) a change in income regarded as permanent will have a greater impact on saving than on consumption.
D) a change in income regarded as temporary will have a greater impact on saving than on consumption.
فتح الحزمة
افتح القفل للوصول البطاقات البالغ عددها 219 في هذه المجموعة.
فتح الحزمة
k this deck
46
The average annual income that people expect to receive for the remainder of their lives is called
A) lifetime income.
B) permanent income.
C) disposable personal income.
D) current income.
A) lifetime income.
B) permanent income.
C) disposable personal income.
D) current income.
فتح الحزمة
افتح القفل للوصول البطاقات البالغ عددها 219 في هذه المجموعة.
فتح الحزمة
k this deck
47
Figure 13-2
Refer to Figure 13-2. If real GDP were $12 trillion, consumption equals
A) 5 trillion.
B) 7 trillion.
C) 9 trillion.
D) 11 trillion.
Refer to Figure 13-2. If real GDP were $12 trillion, consumption equals
A) 5 trillion.
B) 7 trillion.
C) 9 trillion.
D) 11 trillion.
فتح الحزمة
افتح القفل للوصول البطاقات البالغ عددها 219 في هذه المجموعة.
فتح الحزمة
k this deck
48
Figure 13-3
Refer to Figure 13-3. Upward shifts of the consumption function, for example from C0 to C1 to C2 demonstrate
A) an increase in the marginal propensity to save.
B) increases in the amount of consumption for a given level of disposable income.
C) increases in the amount of disposable income available for consumption.
D) an increase in the marginal propensity to save
فتح الحزمة
افتح القفل للوصول البطاقات البالغ عددها 219 في هذه المجموعة.
فتح الحزمة
k this deck
49
Figure 13-3
Refer to Figure 13-3. Suppose the consumption function is given by curve C1. What will cause an upward shift to curve C2?
A) an increase in the amount consumed as disposable personal income increases.
B) an increase in consumption at any level of disposable personal income
C) an increase in the price level
D) an increase in transfer payments
فتح الحزمة
افتح القفل للوصول البطاقات البالغ عددها 219 في هذه المجموعة.
فتح الحزمة
k this deck
50
Figure 13-2
Refer to Figure 13-2. If real GDP is $8 trillion, saving equals
A) $4 trillion.
B) $3 trillion.
C) $2 trillion.
D) $1 trillion.
Refer to Figure 13-2. If real GDP is $8 trillion, saving equals
A) $4 trillion.
B) $3 trillion.
C) $2 trillion.
D) $1 trillion.
فتح الحزمة
افتح القفل للوصول البطاقات البالغ عددها 219 في هذه المجموعة.
فتح الحزمة
k this deck
51
Figure 13-2
Refer to Figure 13-2. The marginal propensity to consume equals
A) 0.
B) 0.5.
C) 1.0.
D) 2.0.
Refer to Figure 13-2. The marginal propensity to consume equals
A) 0.
B) 0.5.
C) 1.0.
D) 2.0.
فتح الحزمة
افتح القفل للوصول البطاقات البالغ عددها 219 في هذه المجموعة.
فتح الحزمة
k this deck
52
Suppose the consumption function is C = $500 + 0.8Y. If Y = $1,000, then autonomous consumption is
A) $500.
B) $800.
C) $1,000.
D) $1,300.
A) $500.
B) $800.
C) $1,000.
D) $1,300.
فتح الحزمة
افتح القفل للوصول البطاقات البالغ عددها 219 في هذه المجموعة.
فتح الحزمة
k this deck
53
According to the permanent income hypothesis,
A) consumption in any period depends on the stable annual income that people expect to earn in their jobs.
B) the amount of income that people require depends on the amount of consumption they need and want to undertake.
C) consumption in any period depends on the average annual income people expect to receive for the rest of their lives.
D) the amount of personal saving depends on the amount of consumption people plan to undertake when they retire.
فتح الحزمة
افتح القفل للوصول البطاقات البالغ عددها 219 في هذه المجموعة.
فتح الحزمة
k this deck
54
Figure 13-2
Refer to Figure 13-2. If real GDP is $4 trillion, consumption equals
A) 0.75 trillion.
B) 1 trillion.
C) 3 trillion.
D) 4 trillion.
Refer to Figure 13-2. If real GDP is $4 trillion, consumption equals
A) 0.75 trillion.
B) 1 trillion.
C) 3 trillion.
D) 4 trillion.
فتح الحزمة
افتح القفل للوصول البطاقات البالغ عددها 219 في هذه المجموعة.
فتح الحزمة
k this deck
55
Suppose that your annual income has averaged $40,000 for the past 10 years and that you expect it will average $40,000 over the next 10 years. If your income this year increases to $50,000 and you increase your consumption expenditures by $10,000, then you are most likely acting according to the
A) transitory income theory of consumption.
B) current income hypothesis.
C) permanent income hypothesis.
D) disposable personal income theory of consumption.
A) transitory income theory of consumption.
B) current income hypothesis.
C) permanent income hypothesis.
D) disposable personal income theory of consumption.
فتح الحزمة
افتح القفل للوصول البطاقات البالغ عددها 219 في هذه المجموعة.
فتح الحزمة
k this deck
56
Which of the following statements is false?
A) Two individuals who have the same current income but different permanent incomes are likely to make very similar savings decisions.
B) An individual with a relatively low current income but a high permanent income might save little or nothing now, expecting to save for retirement and for bequests later.
C) A person with a relatively low income now with no expectation of higher income later might try to save some now to provide for retirement or bequests later.
D) A decision to save a certain amount determines how much will be available for future consumption.
فتح الحزمة
افتح القفل للوصول البطاقات البالغ عددها 219 في هذه المجموعة.
فتح الحزمة
k this deck
57
Figure 13-2
Refer to Figure 13-2. An equation for the consumption function is
A) C = 1 + Y.
B) C = Y.
C) C = 1 + 2Y.
D) C = 1 + 0.5Y.
Refer to Figure 13-2. An equation for the consumption function is
A) C = 1 + Y.
B) C = Y.
C) C = 1 + 2Y.
D) C = 1 + 0.5Y.
فتح الحزمة
افتح القفل للوصول البطاقات البالغ عددها 219 في هذه المجموعة.
فتح الحزمة
k this deck
58
According to the permanent income hypothesis,
A) a change in income regarded as permanent will have a greater impact on saving than on consumption.
B) a change in income regarded as temporary will have a greater impact on saving than on consumption.
C) regardless of whether a change in disposable personal income is permanent or temporary; people will change consumption by moving along the consumption function.
D) a change in income regarded as temporary will not affect consumption much since it will have little effect on average lifetime income.
فتح الحزمة
افتح القفل للوصول البطاقات البالغ عددها 219 في هذه المجموعة.
فتح الحزمة
k this deck
59
Suppose that your annual income has averaged $40,000 for the past 10 years and that you expect it will average $40,000 over the next 10 years. If your income this year increases to $50,000 but your consumption expenditures don't change, then you are most likely acting according to the
A) transitory income theory of consumption.
B) current income hypothesis.
C) permanent income hypothesis.
D) disposable personal income theory of consumption.
A) transitory income theory of consumption.
B) current income hypothesis.
C) permanent income hypothesis.
D) disposable personal income theory of consumption.
فتح الحزمة
افتح القفل للوصول البطاقات البالغ عددها 219 في هذه المجموعة.
فتح الحزمة
k this deck
60
Consumption spending in any one period that is determined by income in that period is explained by the
A) current income hypothesis.
B) disposable personal income theory of consumption.
C) transitory income theory of consumption.
D) permanent income hypothesis.
A) current income hypothesis.
B) disposable personal income theory of consumption.
C) transitory income theory of consumption.
D) permanent income hypothesis.
فتح الحزمة
افتح القفل للوصول البطاقات البالغ عددها 219 في هذه المجموعة.
فتح الحزمة
k this deck
61
If an economy is in equilibrium,
A) planned investment equals zero.
B) unplanned investment equals zero.
C) there is no change in inventories.
D) inventories equals zero.
A) planned investment equals zero.
B) unplanned investment equals zero.
C) there is no change in inventories.
D) inventories equals zero.
فتح الحزمة
افتح القفل للوصول البطاقات البالغ عددها 219 في هذه المجموعة.
فتح الحزمة
k this deck
62
Expenditures that do not vary with the level of real GDP are called
A) exogenous aggregate expenditures.
B) induced aggregate expenditures.
C) endogenous aggregate expenditures.
D) autonomous aggregate expenditures.
A) exogenous aggregate expenditures.
B) induced aggregate expenditures.
C) endogenous aggregate expenditures.
D) autonomous aggregate expenditures.
فتح الحزمة
افتح القفل للوصول البطاقات البالغ عددها 219 في هذه المجموعة.
فتح الحزمة
k this deck
63
Planned investment is
A) equal to gross private domestic investment, less depreciation.
B) equal to gross private domestic investment.
C) the level of investment firms intend to make in a period.
D) the level of investment government will require firms to make in a period.
A) equal to gross private domestic investment, less depreciation.
B) equal to gross private domestic investment.
C) the level of investment firms intend to make in a period.
D) the level of investment government will require firms to make in a period.
فتح الحزمة
افتح القفل للوصول البطاقات البالغ عددها 219 في هذه المجموعة.
فتح الحزمة
k this deck
64
Aggregate expenditures are the
A) sum of planned levels of consumption, investment, government purchases, and net exports, at a given price level, as they relate to real GDP.
B) sum of consumption, saving, investment, government purchases, and net exports, at a given price level, as they relate to real GDP.
C) total of all spending, and equal to the value of real GDP at all price levels.
D) value of GDP, in nominal values, for all price levels, all other things unchanged.
فتح الحزمة
افتح القفل للوصول البطاقات البالغ عددها 219 في هذه المجموعة.
فتح الحزمة
k this deck
65
Investment equals
A) planned investment plus unplanned investment.
B) planned investment minus unplanned investment.
C) unplanned investment minus planned investment.
D) planned investment in a free market economy.
A) planned investment plus unplanned investment.
B) planned investment minus unplanned investment.
C) unplanned investment minus planned investment.
D) planned investment in a free market economy.
فتح الحزمة
افتح القفل للوصول البطاقات البالغ عددها 219 في هذه المجموعة.
فتح الحزمة
k this deck
66
Expenditures that vary with the level of real GDP are called
A) aggregate expenditures.
B) induced aggregate expenditures.
C) marginal expenditures.
D) autonomous aggregate expenditures.
A) aggregate expenditures.
B) induced aggregate expenditures.
C) marginal expenditures.
D) autonomous aggregate expenditures.
فتح الحزمة
افتح القفل للوصول البطاقات البالغ عددها 219 في هذه المجموعة.
فتح الحزمة
k this deck
67
Figure 13-3
Refer to Figure 13-3. Suppose the consumption function is given by curve C1. Which of the following will cause a downward shift to curve C1?
A) a stock market crash that decreases household wealth
B) a decrease in price level
C) an increase in withholding tax rate
D) rising optimism about economic conditions
فتح الحزمة
افتح القفل للوصول البطاقات البالغ عددها 219 في هذه المجموعة.
فتح الحزمة
k this deck
68
A downward shift in the consumption function can be caused by
A) expectations of product shortages.
B) expectations of more income in the future.
C) a decrease in consumer confidence.
D) rising property values that increases households' net worth.
A) expectations of product shortages.
B) expectations of more income in the future.
C) a decrease in consumer confidence.
D) rising property values that increases households' net worth.
فتح الحزمة
افتح القفل للوصول البطاقات البالغ عددها 219 في هذه المجموعة.
فتح الحزمة
k this deck
69
Unplanned investment is
A) the level of investment minus depreciation.
B) the level of investment plus depreciation.
C) investment that occurs that is unexpected by the government.
D) investment that firms did not intend to make.
A) the level of investment minus depreciation.
B) the level of investment plus depreciation.
C) investment that occurs that is unexpected by the government.
D) investment that firms did not intend to make.
فتح الحزمة
افتح القفل للوصول البطاقات البالغ عددها 219 في هذه المجموعة.
فتح الحزمة
k this deck
70
The relationship between aggregate expenditures and real GDP is shown by the
A) aggregate expenditures curve.
B) consumption function.
C) aggregate demand curve.
D) autonomous expenditures curve.
A) aggregate expenditures curve.
B) consumption function.
C) aggregate demand curve.
D) autonomous expenditures curve.
فتح الحزمة
افتح القفل للوصول البطاقات البالغ عددها 219 في هذه المجموعة.
فتح الحزمة
k this deck
71
An increase in the wealth of households, all other things unchanged, will
A) not affect the consumption function.
B) shift the consumption function upward.
C) shift the consumption function downward.
D) cause a movement to the right along the consumption function.
A) not affect the consumption function.
B) shift the consumption function upward.
C) shift the consumption function downward.
D) cause a movement to the right along the consumption function.
فتح الحزمة
افتح القفل للوصول البطاقات البالغ عددها 219 في هذه المجموعة.
فتح الحزمة
k this deck
72
The sum of planned levels of consumption, investment, government purchases, and net exports, at a given price level, is called
A) total production.
B) aggregate supply.
C) aggregate demand.
D) aggregate expenditures.
A) total production.
B) aggregate supply.
C) aggregate demand.
D) aggregate expenditures.
فتح الحزمة
افتح القفل للوصول البطاقات البالغ عددها 219 في هذه المجموعة.
فتح الحزمة
k this deck
73
The slope of the aggregate expenditures curve is given by
A) aggregate expenditures ÷ ∆real GDP where ∆= change in.
B) aggregate expenditures ÷ real GDP.
C) ∆aggregate expenditures ÷ real GDP.
D) ∆aggregate expenditures ÷ ∆real GDP.
A) aggregate expenditures ÷ ∆real GDP where ∆= change in.
B) aggregate expenditures ÷ real GDP.
C) ∆aggregate expenditures ÷ real GDP.
D) ∆aggregate expenditures ÷ ∆real GDP.
فتح الحزمة
افتح القفل للوصول البطاقات البالغ عددها 219 في هذه المجموعة.
فتح الحزمة
k this deck
74
In a graph with real GDP on the horizontal axis and aggregate expenditures on the vertical axis, induced aggregate expenditures are represented by
A) a ray from the origin.
B) an upward sloping line.
C) a 45-degree line.
D) a horizontal line.
A) a ray from the origin.
B) an upward sloping line.
C) a 45-degree line.
D) a horizontal line.
فتح الحزمة
افتح القفل للوصول البطاقات البالغ عددها 219 في هذه المجموعة.
فتح الحزمة
k this deck
75
Unplanned investment occurs when
I. aggregate expenditures exceed real GDP produced.
II. aggregate expenditures fall short of real GDP produced.
III. when real GDP produced is less than potential real GDP.
IV. when real GDP produced is greater than potential real GDP.
A) I and II only
B) I and IV only
C) II and III only
D) I, II, III, and IV
فتح الحزمة
افتح القفل للوصول البطاقات البالغ عددها 219 في هذه المجموعة.
فتح الحزمة
k this deck
76
An increase in the price level, all other things unchanged, will
A) not affect the consumption function.
B) shift the consumption function upward.
C) shift the consumption function downward.
D) cause a movement to the right along the consumption function.
A) not affect the consumption function.
B) shift the consumption function upward.
C) shift the consumption function downward.
D) cause a movement to the right along the consumption function.
فتح الحزمة
افتح القفل للوصول البطاقات البالغ عددها 219 في هذه المجموعة.
فتح الحزمة
k this deck
77
In the summer of 2001, tax rebate checks of $300 per single taxpayer and $600 for married couples were distributed to 92 million people in the U.S. Economic researchers found that over a nine-month period spending increased to about 40% of the rebate. These findings support
A) the permanent income hypothesis.
B) the current income hypothesis.
C) the transitory income hypothesis.
D) the consumption function.
A) the permanent income hypothesis.
B) the current income hypothesis.
C) the transitory income hypothesis.
D) the consumption function.
فتح الحزمة
افتح القفل للوصول البطاقات البالغ عددها 219 في هذه المجموعة.
فتح الحزمة
k this deck
78
In a graph with real GDP on the horizontal axis and aggregate expenditures on the vertical axis, autonomous aggregate expenditures are represented by
A) a ray from the origin.
B) an upward sloping line with a positive vertical intercept.
C) a 45-degree line.
D) a horizontal line.
A) a ray from the origin.
B) an upward sloping line with a positive vertical intercept.
C) a 45-degree line.
D) a horizontal line.
فتح الحزمة
افتح القفل للوصول البطاقات البالغ عددها 219 في هذه المجموعة.
فتح الحزمة
k this deck
79
An upward shift in the consumption function can be caused by
A) expectations of product shortages.
B) expectations of less income in the future.
C) a decrease in consumer confidence.
D) a reduction in the wealth of households.
A) expectations of product shortages.
B) expectations of less income in the future.
C) a decrease in consumer confidence.
D) a reduction in the wealth of households.
فتح الحزمة
افتح القفل للوصول البطاقات البالغ عددها 219 في هذه المجموعة.
فتح الحزمة
k this deck
80
Figure 13-3
Refer to Figure 13-3. Which of the following statements is false?
A) At points j, k, and m, consumers spend all their disposable income on consumption.
B) The amount of consumption is positive even when disposable income equals zero.
C) The slope of the consumption function is the marginal propensity to consume.
D) At points j, k, and m, the marginal propensity to save equals zero.
فتح الحزمة
افتح القفل للوصول البطاقات البالغ عددها 219 في هذه المجموعة.
فتح الحزمة
k this deck
فتح الحزمة
افتح القفل للوصول البطاقات البالغ عددها 219 في هذه المجموعة.


