Multiple Choice
Exhibit 6-29 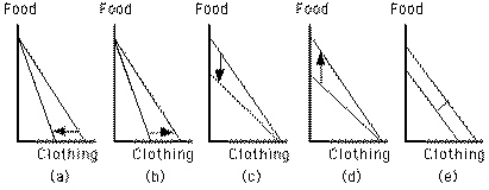 Which graph in Exhibit 6-29 shows an increase in the price of food?
A) Graph a
B) Graph b
C) Graph c
D) Graph d
E) Graph e
Correct Answer:
Verified
Related Questions
Exhibit 6-29 Which graph in Exhibit 6-29 shows an increase in the price of food?
A) Graph a
B) Graph b
C) Graph c
D) Graph d
E) Graph e
Correct Answer:
Verified

