Multiple Choice
Exhibit 6-29 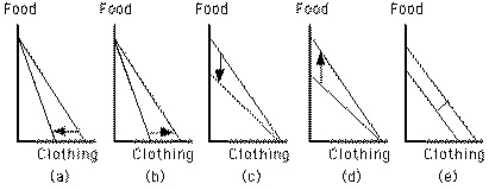 Which graph in Exhibit 6-29 shows a decrease in the price of food?
A) Graph a
B) Graph b
C) Graph c
D) Graph d
E) Graph e
Correct Answer:
Verified
Related Questions
Q91: A consumer allocates income between clams and
Q92: Although some of the statements below are
Q93: What is the effect of a fall
Q94: What would happen to the budget line
Unlock this Answer For Free Now!
View this answer and more for free by performing one of the following actions

Scan the QR code to install the App and get 2 free unlocks

Unlock quizzes for free by uploading documents