Use the figure below to answer the following questions. 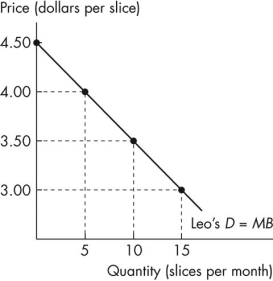
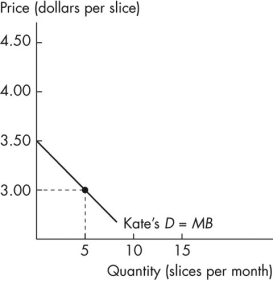 Figure 5.2.4a Figure 5.2.4b
-Figure 5.2.4 shows Leo's demand curve for pizza in the left graph and Kate's demand curve for pizza in the right graph.Leo and Kate are the only two consumers in the market.If the market price is $3 a slice,what is the quantity demanded in the market?
A) 15 slices
B) 5 slices
C) 20 slices
D) 10 slices
E) 25 slices
Correct Answer:
Verified
Q48: The marginal cost of producing one more
Q49: Suppose that the Hot Dog House can
Q50: What is the producer surplus for the
Q51: Use the figure below to answer the
Q52: A market supply curve is
A)the horizontal sum
Q54: Use the figure below to answer the
Q55: A supply curve is
A)the same as a
Q56: If a firm produces one more bottle
Q57: Use the figure below to answer the
Q58: Market demand is the
A)sum of the prices
Unlock this Answer For Free Now!
View this answer and more for free by performing one of the following actions

Scan the QR code to install the App and get 2 free unlocks

Unlock quizzes for free by uploading documents