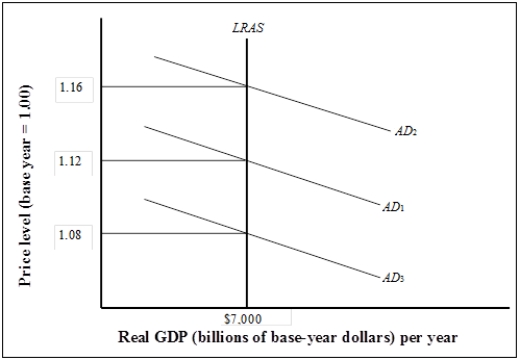
Figure 7-2 
-Refer to Figure 7-2. The potential output in this economy is
A) $6,000 billion at a price level of 1.08.
B) $7,000 billion at a price level of 1.12.
C) $7, 100 billion at a price level of 1.16.
D) $7,056 billion at a price level of 1.08.
Correct Answer:
Verified
Q41: Suppose net exports decreases by $100 million
Q43: Suppose that an increase in government purchases
Q45: Wage and price stickiness
A) gives rise to
Q46: In a graph that shows the aggregate
Q47: A decrease in aggregate demand, all other
Q48: The long-run aggregate supply curve is vertical
Q52: Suppose investment rises by $50 billion at
Q53: In the long run, an increase in
Q54: Which of the following best explains why
Q59: Suppose that government spending on defense rises
Unlock this Answer For Free Now!
View this answer and more for free by performing one of the following actions

Scan the QR code to install the App and get 2 free unlocks

Unlock quizzes for free by uploading documents