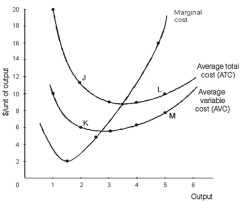
-Refer to the graph above.The gap between point J and point K represents
A) average total cost.
B) average total cost of 2 units of output.
C) average variable cost of 2 units of output.
D) average profit of 2 units of output.
E) average fixed cost of 2 units of output.
Correct Answer:
Verified
Q89: Suppose that a price taker confronts a
Q90: Assume that a price taker uses 13
Q91: If a price taker spends $200 to
Q92: If the price of output for a
Q93: As the price increases,price takers find that
Q95: Because of the relationship between marginal cost
Q96: For a price taker,if the price of
Q97: Suppose that a price taker collects total
Unlock this Answer For Free Now!
View this answer and more for free by performing one of the following actions

Scan the QR code to install the App and get 2 free unlocks

Unlock quizzes for free by uploading documents