Plot the following data for quantity of production and long-run average cost for a firm. Are there economies of scale, diseconomies of scale, or constant returns to scale? Indicate these areas in your diagram. 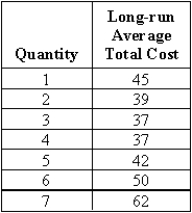
Correct Answer:
Verified
View Answer
Unlock this answer now
Get Access to more Verified Answers free of charge
Q159: Economies and diseconomies of scale are the
Q160: Suppose one firm buys cattle to process
Q161: A line that illustrates all the different
Q162: The slope of an isoquant is called
Q163: Fill in the table below about the
Q165: Explain the difference between economies of scale
Q166: Use the cost function information provided in
Q167: A firm can experience economies of scope
Q168: An isocost line has a
A)positive slope because
Q169: The slope of an isoquant depends on
Unlock this Answer For Free Now!
View this answer and more for free by performing one of the following actions

Scan the QR code to install the App and get 2 free unlocks

Unlock quizzes for free by uploading documents