Star, Inc. used Excel to run a least-squares regression analysis, which resulted in the following output: 
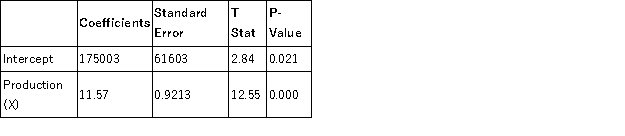 What total cost would Star predict for a month in which production is 2,000 units?
A) $23,140
B) $63,446
C) $175,003
D) $198,143
Correct Answer:
Verified
Q62: Total contribution margin is defined as:
A)selling price
Q65: Which of the following statements is correct
Q72: Star, Inc. used Excel to run a
Q74: A statistical method for finding the best-fitting
Q74: Which of the following is not correct
Q76: Fremont,which uses the high-low method,reported total costs
Q77: Using the results of the least-squares regression
Q78: Star, Inc. used Excel to run a
Q82: The contribution margin ratio is:
A)the difference between
Q96: Laredo,Inc.has a contribution margin ratio of 45%.This
Unlock this Answer For Free Now!
View this answer and more for free by performing one of the following actions

Scan the QR code to install the App and get 2 free unlocks

Unlock quizzes for free by uploading documents