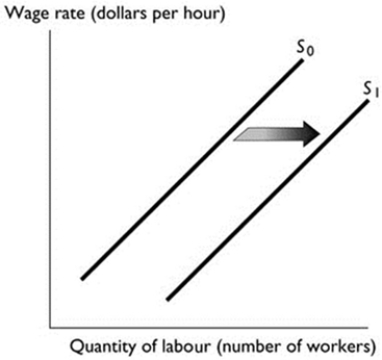
-The figure above shows the market supply of labour curve. Which of the following might be the reason the labour supply curve shifted from S0 to S1?
A) A decrease in technology.
B) A decrease in the adult population.
C) An increase in the wage rate.
D) An increase in the number of women in the workforce.
E) An increase in technology.
Correct Answer:
Verified
Q46: Q47: If both the demand for labour and Q48: A change in the wage rate Q49: Which of the following is a method Q50: An individual's labour supply curve eventually bends Q52: A technological change that raises the value![]()
A) shifts
Unlock this Answer For Free Now!
View this answer and more for free by performing one of the following actions

Scan the QR code to install the App and get 2 free unlocks

Unlock quizzes for free by uploading documents