The table below displays hypothetical demand and supply schedules for the market for overnight parcel deliveries in Canada. 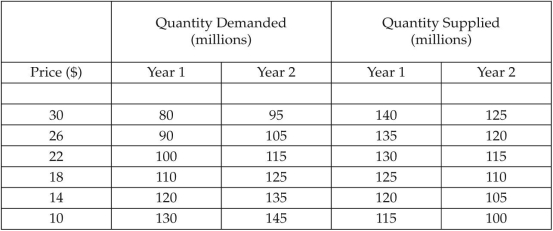 TABLE 3-4 Refer to Table 3-4.Which of the following statements best describes the change in equilibrium price and quantity in this market between Year 1 and Year 2?
A) The demand curve has shifted to the left,the supply curve has shifted to the right; as a result equilibrium price is lower and equilibrium quantity is higher.
B) The demand curve has shifted to the left,the supply curve has shifted to the left; as a result equilibrium price is higher and equilibrium quantity is lower.
C) The demand curve has shifted to the right,the supply curve has shifted to the left; as a result equilibrium price is higher and equilibrium quantity is lower.
D) The demand curve has shifted to the left,the supply curve has shifted to the right; as a result equilibrium price is higher and equilibrium quantity is lower.
E) There is no change in equilibrium price or quantity from Year 1 to Year 2.
Correct Answer:
Verified
Q98: The demand and supply schedules for a
Q99: The supply and demand schedules for dozens
Q100: The supply and demand schedules for dozens
Q101: The table below displays hypothetical demand and
Q102: The demand and supply schedules for a
Q104: Q105: Q106: The table below displays hypothetical demand and Q107: The table below displays hypothetical demand and Q108: Unlock this Answer For Free Now! View this answer and more for free by performing one of the following actions Scan the QR code to install the App and get 2 free unlocks Unlock quizzes for free by uploading documents![]()
![]()
![]()

