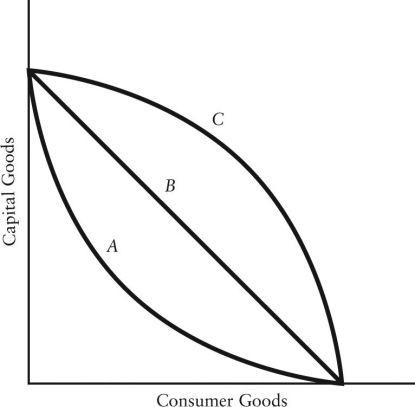
 FIGURE 1-5 Refer to Figure 1-5.Which production possibilities boundaries are consistent with increasing opportunity costs?
A) boundary A only
B) boundaries A and B
C) boundary C only
D) boundaries B and C
E) boundaries A,B,and C
Correct Answer:
Verified
Q73: The diagram below shows two production possibilities
Q74: On a diagram of a production possibilities
Q75: The diagram below shows two production possibilities
Q76: The diagram below shows two production possibilities
Q77: The diagram below shows two production possibilities
Q79: If there is always a three-for-one trade-off
Q80: The diagram below shows two production possibilities
Q81: In recent years,several large Canadian-owned mining and
Q82: Consider a production possibilities boundary showing the
Q83: Figure 1-7 shows the production possibilities boundary
Unlock this Answer For Free Now!
View this answer and more for free by performing one of the following actions

Scan the QR code to install the App and get 2 free unlocks

Unlock quizzes for free by uploading documents