Figure 1-7 shows the production possibilities boundary for an economy that produces two goods-cotton and bananas. 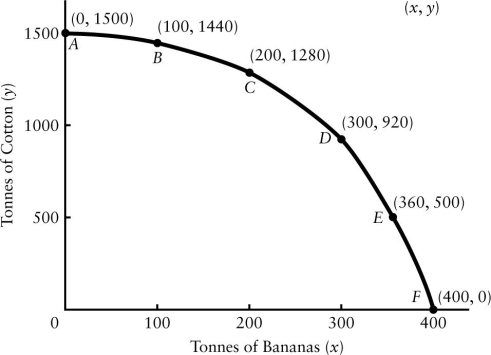 FIGURE 1-7 Refer to Figure 1-7.A production possibilities boundary is shown for an economy that produces two goods-cotton and bananas,both measured in tonnes produced per year.Suppose this economy is currently producing 1280 tonnes of cotton and 200 tonnes of bananas.What is the opportunity cost of increasing production of bananas by 100 tonnes?
A) 100 tonnes of cotton
B) 360 tonnes of cotton
C) 360 tonnes of bananas
D) 920 tonnes of cotton
E) There is no opportunity cost.
Correct Answer:
Verified
Q91: Figure 1-7 shows the production possibilities boundary
Q92: A modern economy like Canada's is largely
Q93: Figure 1-7 shows the production possibilities boundary
Q94: An important insight by Adam Smith,which was
Q95: The world price of oil fell in
Q97: An insight first fully developed by Adam
Q98: Consider Canada's production possibilities boundary.During the nineteenth
Q99: Consider Canada's production possibilities boundary.Suppose a scientific
Q100: Figure 1-7 shows the production possibilities boundary
Q101: If an economy exhibits the specialization of
Unlock this Answer For Free Now!
View this answer and more for free by performing one of the following actions

Scan the QR code to install the App and get 2 free unlocks

Unlock quizzes for free by uploading documents