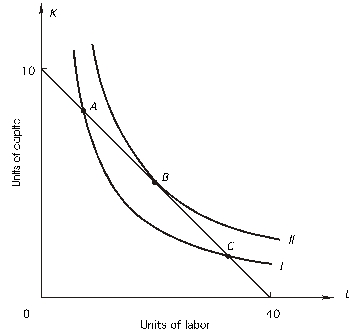
 Given the above graph,as you move from input combination A to input combination C,
A) output is unchanged.
B) cost is unchanged.
C) the marginal rate of technical substitution increases.
D) both a and b
E) all of the above
Correct Answer:
Verified
Q50: The expansion path
A)shows how the cost-minimizing input
Q51: In the following graph,the price of capital
Q52: The slope of an isoquant is
A)-∆K/∆L.
B)MPL /
Q53: In the following graph,the price of capital
Q54: In the following graph,the price of capital
Q56: In the following graph,the price of capital
Q57: Which of the following statements is true?
A)In
Q58: The marginal rate of technical substitution is
A)the
Q59: In the following graph,the price of capital
Q60: In the following graph,the price of capital
Unlock this Answer For Free Now!
View this answer and more for free by performing one of the following actions

Scan the QR code to install the App and get 2 free unlocks

Unlock quizzes for free by uploading documents