In the following graph the price of Y is $15.What does the curve in the lower graph show? 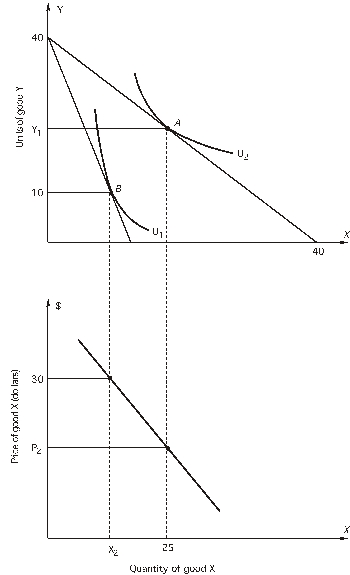
A) how a consumer's utility-maximizing choices of X and Y change when the budget constraint changes
B) how a consumer's preferences change when income changes
C) how a consumer's utility-maximizing choices of X changes when the price of X changes
D) how a consumer's utility-maximizing choices of Y changes when the price of Y changes
E) both c and d
Correct Answer:
Verified
Q50: In the following graph the price of
Q51: In the following graph the price of
Q52: What is the equation for budget line
Q53:
The price of X is $20 and
Q54: In the following graph the consumer's income
Q56: Assume that an individual consumes two
Q57: Lord Greystroke uses his limited income to
Q58: In the following graph the price
Q59: Assume that an individual consumes two
Q60: In the following graph the price
Unlock this Answer For Free Now!
View this answer and more for free by performing one of the following actions

Scan the QR code to install the App and get 2 free unlocks

Unlock quizzes for free by uploading documents