In this figure, if the value of a calculated statistic falls in the ______ , you will ______. 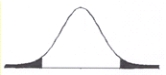
A) middle of the distribution; reject the null hypothesis
B) tails of the distribution; reject the alternative hypothesis
C) tails of the distribution; not reject the null hypothesis
D) middle of the distribution; not reject the null hypothesis
Correct Answer:
Verified
Q80: The difference between the regions of rejection
Q81: You _ when the statistic falls in
Q82: In this figure, the unshaded area represents
Q83: You will make the decision to _
Q84: In this figure, the unshaded area represents
Q86: You _ when the statistic falls in
Q87: You _ the null hypothesis when the
Q88: You _ when the statistic falls in
Q89: Hypothesis testing can provide _ for a
Q90: You _ when the probability of the
Unlock this Answer For Free Now!
View this answer and more for free by performing one of the following actions

Scan the QR code to install the App and get 2 free unlocks

Unlock quizzes for free by uploading documents