In this figure, the shaded areas represent ______. 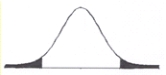
A) values of the statistic with a low probability of occurring
B) the region of non-rejection
C) the symmetry of the distribution
D) 95% of the distribution
Correct Answer:
Verified
Q86: You _ when the statistic falls in
Q87: You _ the null hypothesis when the
Q88: You _ when the statistic falls in
Q89: Hypothesis testing can provide _ for a
Q90: You _ when the probability of the
Q92: You will make the decision to _
Q93: You will make the decision to _
Q94: You will make the decision to _
Q95: You _ the null hypothesis when the
Q96: A decision rule _.
A) specifies the values
Unlock this Answer For Free Now!
View this answer and more for free by performing one of the following actions

Scan the QR code to install the App and get 2 free unlocks

Unlock quizzes for free by uploading documents