A learning curve describes the rate at which a person learns certain specific tasks. If N is the number of words per minute typed by a student. So for an average student 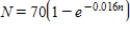
Where n is the number of days of instruction. What does the graph of this formula look like?
A) 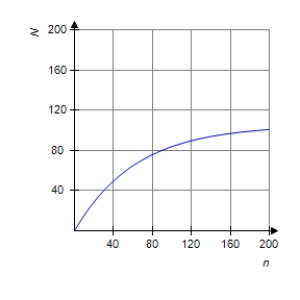
B) 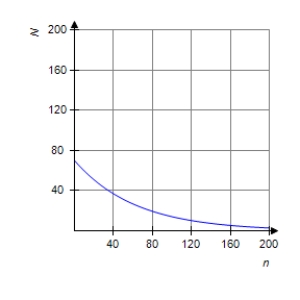
C) 
D) 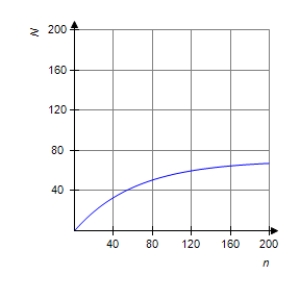
Correct Answer:
Verified
Q47: Graph the first-degree inequality in two unknowns.
Q48: Graph the first-degree inequality in two unknowns.
Q49: Graph the first-degree inequality in two unknowns.
Q50: Sketch the graph of the equation.
Q51: State whether the statement is true or
Q53: Sketch the graph of the equation.
Q54: State whether the statement is true or
Q55: Graph the first-degree inequality in two unknowns.
Q56: State whether the statement is true or
Q57: State whether the statement is true or
Unlock this Answer For Free Now!
View this answer and more for free by performing one of the following actions

Scan the QR code to install the App and get 2 free unlocks

Unlock quizzes for free by uploading documents