Multiple Choice
Exhibit 20-5
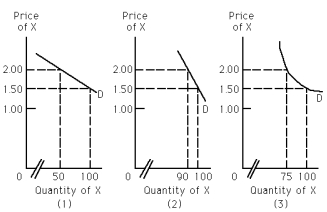
-Refer to Exhibit 20-5.Assume that the seller of X increases the price from $1.50 to $2.00,and this results in an increase in total revenue.Which of the graphs represents the demand curve for X?
A) (1)
B) (2)
C) (3)
D) all of the above
Correct Answer:
Verified
Related Questions

