 Figure 40.3
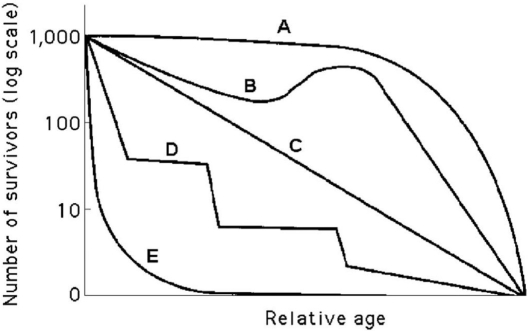
-In Figure 40.3,which curve best describes survivorship in marine molluscs?
A) A
B) B
C) C
D) D
E) E
Correct Answer:
Verified
Q45: Why do populations grow more slowly as
Q50: Use the survivorship curves in Figure 53.1
Q73: Which of the following is an intrinsic
Q74: In which of the following situations would
Q75: Please use the following information to answer
Q77: What is a metapopulation?
A)all of the populations
Q79: Please use the following information to answer
Q80: Figure 40.2 shows a generalized cross section
Q82: A population's carrying capacity
A)may change as environmental
Q83: ![]()
Unlock this Answer For Free Now!
View this answer and more for free by performing one of the following actions

Scan the QR code to install the App and get 2 free unlocks

Unlock quizzes for free by uploading documents