The graph shows the sales (in billions of dollars) for Apple Inc.for the years 2001 through 2007. 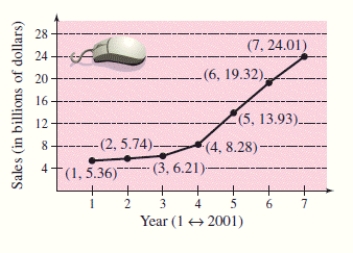 Find the slope of the line segment connecting the points for the years 2003 and 2004.Round the answer to two decimal places.
A) -5.07
B) 2.07
C) 7.07
D) 3.07
E) -2.07
Correct Answer:
Verified
Q272: Use the intercept form to find the
Q273: A microchip manufacturer pays its assembly line
Q274: A sales representative of a company using
Q275: Use the intercept form to find the
Q276: Estimate the slope of the line.
Q278: A pharmaceutical salesperson receives a monthly salary
Q279: Use the intercept form to find the
Q280: A sub shop purchases a used pizza
Q281: Write the equation of the line that
Q282: Carl's Tractor Service purchases a used brush
Unlock this Answer For Free Now!
View this answer and more for free by performing one of the following actions

Scan the QR code to install the App and get 2 free unlocks

Unlock quizzes for free by uploading documents