The figures below show Chris's consumption of specialty coffee per week.
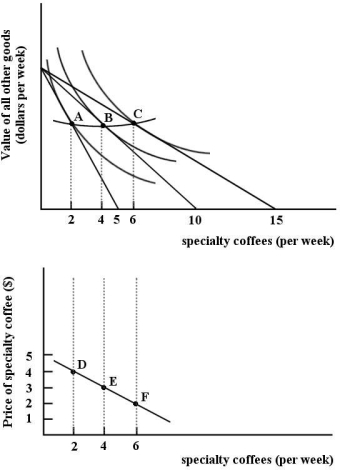 FIGURE 6- 10
-Refer to Figure 6- 10.The two diagrams in Figure 6- 10 are showing
A) that Chris is indifferent between bundles A,B and C.
B) the derivation of Chris's demand curve for specialty coffee.
C) the derivation of Chris's indifference curve for specialty coffee.
D) that Chris is indifferent between points D,E and F.
E) the change in Chris's preferences toward specialty coffee.
Correct Answer:
Verified
Q37: In economics,the term "utility" is defined as
Q38: Given a particular consumer's indifference map,the further
Q39: At a garage sale,Dominique purchases a sewing
Q40: Consider the income and substitution effects of
Q42: In indifference curve analysis,the consumer's utility- maximizing
Q43: Assume you are consuming two goods,X and
Q44: Consider the pizza market,with a downward- sloping
Q45: Since there is a limited supply of
Q46: The marginal rate of substitution measures the
Q85: An individual's consumer surplus from some product
Unlock this Answer For Free Now!
View this answer and more for free by performing one of the following actions

Scan the QR code to install the App and get 2 free unlocks

Unlock quizzes for free by uploading documents