The figures below show Chris's consumption of specialty coffee per week.
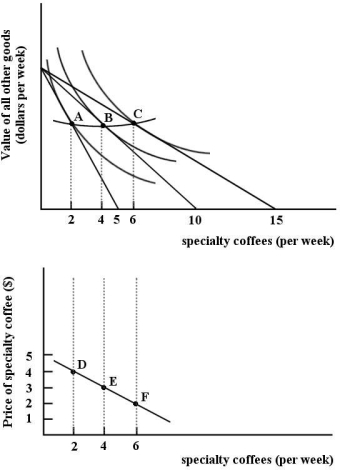 FIGURE 6- 10
-Marginal utility analysis predicts a downward- sloping demand curve for good X because
A) as PX rises,the consumer increases purchases of X such that MUX/PX is equal to MU/P for all other products.
B) all demand curves are downward sloping,regardless of the behaviour of consumers.
C) utility- maximizing consumers equate marginal utility received for each product consumed.
D) as PX falls,the consumer increases purchases of X until MUX/PX is equal to MU/P for all other products.
E) as PX falls,the ratio MUX/PX becomes smaller,causing the consumer to purchase more of good X.
Correct Answer:
Verified
Q55: FIGURE 6- 2 Q56: Christine is allocating her household expenditure between Q57: Suppose there are only two goods,A and Q58: The table below shows the quantities![]()
Unlock this Answer For Free Now!
View this answer and more for free by performing one of the following actions

Scan the QR code to install the App and get 2 free unlocks

Unlock quizzes for free by uploading documents