The figures below show Chris's consumption of specialty coffee per week.
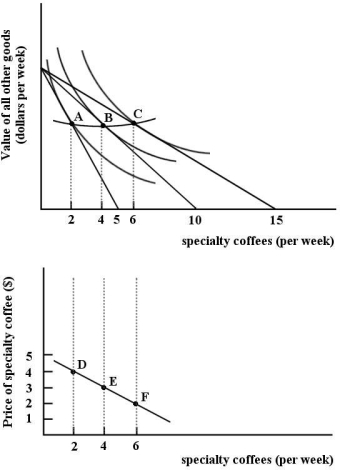 FIGURE 6- 10
-Refer to Figure 6- 10.The line connecting points A,B and C is _.The line connecting points D,E and F is .
A) the demand curve; the budget line
B) the income- consumption line; the budget line
C) the price- consumption line; the demand curve
D) the budget line; the price- consumption line
E) the income- consumption line; the demand curve
Correct Answer:
Verified
Q45: Since there is a limited supply of
Q46: The marginal rate of substitution measures the
Q47: Suppose a consumer can purchase only two
Q48: A basic hypothesis of marginal utility theory
Q49: The table below shows the quantities
Q51: The table below shows the quantities
Q52: The "law" of diminishing marginal utility implies
Q53: The table below shows the total
Q54: The table below shows the total
Q55: FIGURE 6- 2 ![]()
Unlock this Answer For Free Now!
View this answer and more for free by performing one of the following actions

Scan the QR code to install the App and get 2 free unlocks

Unlock quizzes for free by uploading documents