The figure below shows the marginal benefit to consumers,MB,the marginal cost to private firms,MCP,and the marginal cost to society,MCS,at each level of output of some good.
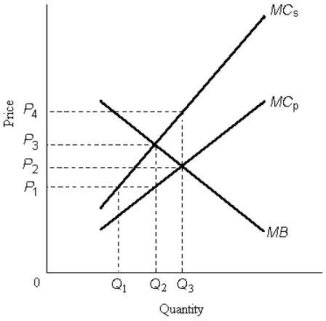 FIGURE 17- 1
-Consider the following equation: GHG = GHG × Energy × GDP,
Energy GDP
Where GHG = world annual emissions of greenhouse gases Energy = world annual amount of energy consumed GDP = world's annual gross domestic product
The ratio Energy/GDP describes
A) the number of units of carbon- based energy produced as a fraction of GDP.
B) the amount of energy used per unit of output in the energy- intensive sector of the economy.
C) the number of units of energy used per dollar of GDP produced.
D) the energy efficiency of greenhouse gas emissions.
E) the amount of energy per unit of GDP required to stabilize greenhouse gas emissions.
Correct Answer:
Verified
Q13: Suppose a firm producing roof shingles imposes
Q14: The figure below shows the demand and
Q15: When firms in an industry have fully
Q16: The diagram below shows the marginal cost
Q17: Consider global greenhouse- gas emissions.Suppose that in
Q19: Global greenhouse- gas (GHG)emission reductions are unlikely
Q20: The diagram below shows the marginal cost
Q21: Direct pollution controls can be inefficient because,for
Q22: The figure below shows the demand and
Q23: Suppose a farm that is polluting an
Unlock this Answer For Free Now!
View this answer and more for free by performing one of the following actions

Scan the QR code to install the App and get 2 free unlocks

Unlock quizzes for free by uploading documents