FIGURE 12- 2 The production possibilities boundary shows possible combinations of guns and butter that can be produced by a country.The lower diagram shows demand and supply for butter.
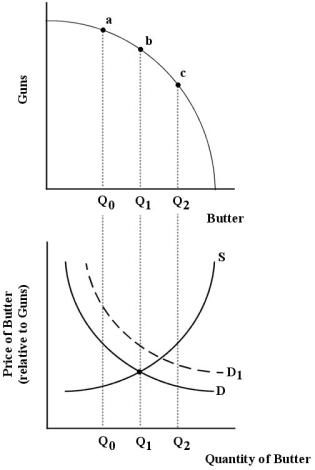
-Refer to Figure 12- 2.Suppose demand and supply for butter are shown by D and S,respectively.And suppose the economy is at point (a) on the production possibilities boundary.Is this output of guns and butter allocatively efficient?
A) No,because the marginal cost to producers of the butter produced is more than the marginal value to consumers.
B) Yes,because the marginal cost of producing the butter equals the marginal value of consuming the butter.
C) No,because the marginal costs for guns and butter are not equated.
D) No,because the marginal value to consumers of the butter produced is greater than the marginal cost to producers.
E) Yes,because all points on the production possibilities boundary are allocatively efficient.
Correct Answer:
Verified
Q51: The diagram below shows the demand and
Q52: The diagram below shows supply,demand,and quantity exchanged
Q53: FIGURE 12- 3 Q54: Choose the statement that best describes the Q56: FIGURE 12- 3 Q57: Productive efficiency (at the level of the Q58: The diagram below shows supply,demand,and quantity exchanged Q59: The diagram below shows the market demand Q60: FIGURE 12- 3 Q66: The diagram below shows the demand and Unlock this Answer For Free Now! View this answer and more for free by performing one of the following actions Scan the QR code to install the App and get 2 free unlocks Unlock quizzes for free by uploading documents![]()
![]()
![]()

