The diagram below shows a pharmaceutical firm's demand curve and marginal cost and marginal revenue curves for a new heart medication for which the firm holds a 20- year patent on its production. 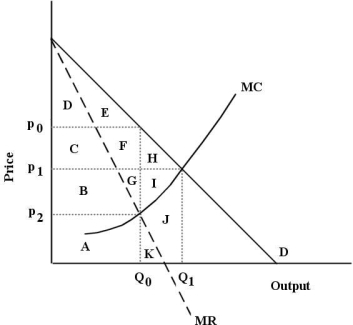 FIGURE 10- 5
-Refer to Figure 10- 5.Assume this pharmaceutical firm charges a single price for its drug.At its profit- maximizing level of output it will produce
A) Q1 units and charge a price of p1.
B) Q1 units and charge a price greater than its average total variable cost.
C) Q0 units and charge a price of p0.
D) Q0 units and charge the perfectly competitive price.
E) Q0 units and charge a price of p2.
Correct Answer:
Verified
Q13: Q73: TABLE 10- 1 Q74: Which of the following products would most Q75: The diagram below shows a pharmaceutical firm's Q76: Refer to Figure 10- 4.Suppose this monopolist Q77: The diagram below shows a pharmaceutical firm's Q79: Many clothing retailers allow you to go Q80: A likely cause of a natural monopoly Q82: A cartel can only succeed in the Q83: FIGURE 10- 4 Suppose a monopolist faces![]()
Unlock this Answer For Free Now!
View this answer and more for free by performing one of the following actions

Scan the QR code to install the App and get 2 free unlocks

Unlock quizzes for free by uploading documents