The diagram below shows the marginal cost of pollution abatement for two firms,Firm X and Firm Y.
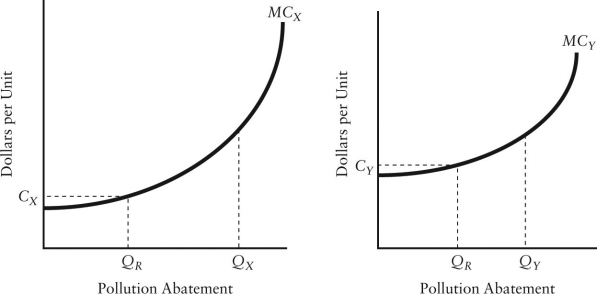 FIGURE 17-4
-Refer to Figure 17-4.The optimal amount of pollution abatement for these two firms together is
A) QR for X + QR for Y.
B) QR for X + Qy for Y.
C) Qx for X + QR for Y.
D) Qx + Qy.
E) impossible to tell without the marginal benefit of abatement curve.
Correct Answer:
Verified
Q65: The banning of wood-burning stoves and fireplaces
Q68: Federal regulation aimed at reducing greenhouse-gas emissions
Q70: The diagram below shows the marginal costs
Q71: The diagram below shows the marginal cost
Q73: The diagram below shows the marginal cost
Q75: The diagram below shows the marginal cost
Q76: Why are direct controls for reducing pollution
Q77: Which of the following environmental problems would
Q89: Two firms,A and B,are legally required to
Q100: Direct pollution controls are usually inefficient because
Unlock this Answer For Free Now!
View this answer and more for free by performing one of the following actions

Scan the QR code to install the App and get 2 free unlocks

Unlock quizzes for free by uploading documents