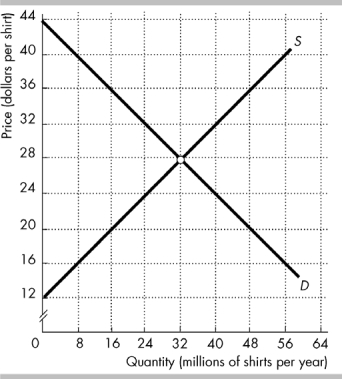
The figure shows the market for shirts in the United States, where D is the domestic demand curve and S is the domestic supply curve. The world price is $20 per shirt. The United States imposes a tariff on imported shirts, $4 per shirt.
-In the figure above, the tariff _________U.S. imports of shirts by _________million shirts per year.
A) increases; 4
B) decreases; 8
C) decreases; 16
D) increases; 8
Correct Answer:
Verified
Q48: The Smoot-Hawley Act
A) made most tariffs illegal.
B)
Q49: U.S. tariffs in the peaked in
A) 1940.
B)
Q50: Q51: A tariff is imposed on a good. Q52: Increasing a tariff will_ the domestic quantity Q54: The United States imports cars from Japan. Q55: The Smoot-Hawley Act introduced Q56: Suppose the country of Mooland imposes tariffs Q57: The winners from a tariff on imports Q58: The Smoot-Hawley Act was enacted in![]()
A) opportunities for expanding
A) 1980.
B)
Unlock this Answer For Free Now!
View this answer and more for free by performing one of the following actions

Scan the QR code to install the App and get 2 free unlocks

Unlock quizzes for free by uploading documents