Multiple Choice
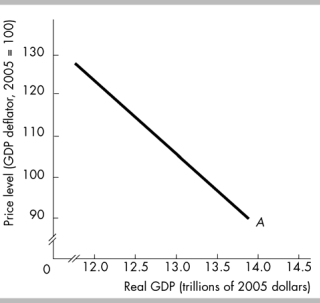
-The curve labeled A in the above figure is
A) an aggregate demand curve.
B) a short-run aggregate supply curve.
C) a production possibilities curve.
D) a long-run aggregate supply curve.
Correct Answer:
Verified
Related Questions

