Multiple Choice
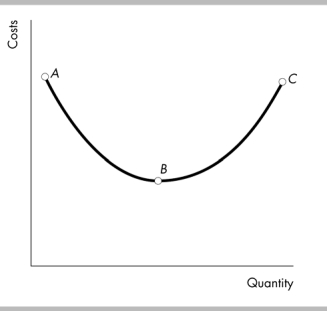
-In the above figure, the relationship between costs and quantity is negative
A) between point A and point B.
B) along the entire curve.
C) no where along the curve.
D) between point B and point C.
Correct Answer:
Verified
Related Questions
Q305: As a firm expands its output, cost
Q306: If a graph shows a negative relationship
Q307: Q308: Suppose that we find that student grades Q308: Q309: As a curve approaches a maximum point, Q311: Q312: The faster an automobile is driven speed), Q314: If the quantity of wood purchased decreases Q315: Unlock this Answer For Free Now! View this answer and more for free by performing one of the following actions Scan the QR code to install the App and get 2 free unlocks Unlock quizzes for free by uploading documents![]()
![]()
![]()
![]()

