The economy in the diagram below begins in long-run equilibrium at E0.
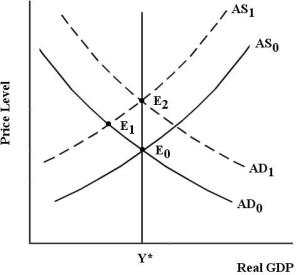 FIGURE 30-2
-Refer to Figure 30-2. At E0, the unemployment rate is 5.6%. Therefore,
1) the NAIRU is 5.6%;
2) cyclical unemployment is 5.6%;
3) the economy is at full unemployment.
A) 1 only
B) 2 only
C) 3 only
D) 1 and 2
E) 1 and 3
Correct Answer:
Verified
Q84: Unemployment rates in Canada and the United
Q85: According to 2015 data, unemployment rates for
Q86: The NAIRU is likely to be affected
Q87: The economy in the diagram below begins
Q91: Suppose that unemployed workers searching to replace
Q91: A good example of an outcome that
Q91: The economy in the diagram below begins
Q95: An increase in the rate of aggregate
Q97: As Canada continues to become more integrated
Q100: The table below shows real GDP,potential GDP
Unlock this Answer For Free Now!
View this answer and more for free by performing one of the following actions

Scan the QR code to install the App and get 2 free unlocks

Unlock quizzes for free by uploading documents