Use the figure below to answer the following questions.
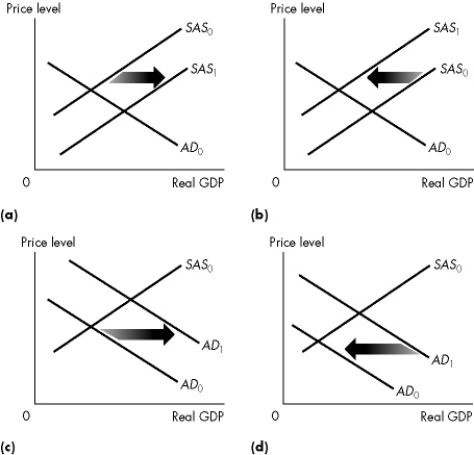 Figure 10.1.1
-Refer to Figure 10.1.1.Which graph illustrates the effect of an increase in factor prices?
A) a
B) b
C) c
D) d
E) a and b
Correct Answer:
Verified
Q6: The short- run aggregate supply curve is
Q7: Which one, if any, of the following
Q8: The long- run aggregate supply curve is
A)vertical.
B)negatively
Q9: A technological advance shifts the
A)SAS and LAS
Q10: Which one of the following newspaper quotations
Q12: Which one of the following newspaper quotations
Q13: Which of the following does not change
Q14: Use the figure below to answer the
Q15: Long- run aggregate supply will increase for
Q16: A vertical long- run aggregate supply curve
Unlock this Answer For Free Now!
View this answer and more for free by performing one of the following actions

Scan the QR code to install the App and get 2 free unlocks

Unlock quizzes for free by uploading documents