Refer to the figure given below. 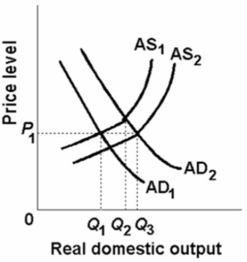 In the above figure, AD1 and AS1 represent the original aggregate demand and aggregate supply curves, respectively.AD2 and AS2 show the new aggregate demand and aggregate supply curves.At the original equilibrium price and quantity, this economy is experiencing:
A) inflation.
B) economic growth.
C) full employment.
D) less than full-capacity output.
Correct Answer:
Verified
Q152: The following aggregate demand and supply schedules
Q153: Refer to the diagram given below.
Q154: Refer to the diagram below. 
Q155: Cost-push inflation occurs because of a:
A)rightward shift
Q156: Collective bargaining agreements that prohibit wage cuts
Q158: The following aggregate demand and supply schedules
Q160: Aggregate demand decreases and real output falls
Q161: A movement upward along an existing aggregate
Q162: In deriving the aggregate demand curve from
Q200: Cost-push inflation is characterized by a(n)
A)increase in
Unlock this Answer For Free Now!
View this answer and more for free by performing one of the following actions

Scan the QR code to install the App and get 2 free unlocks

Unlock quizzes for free by uploading documents