Figure 4.6
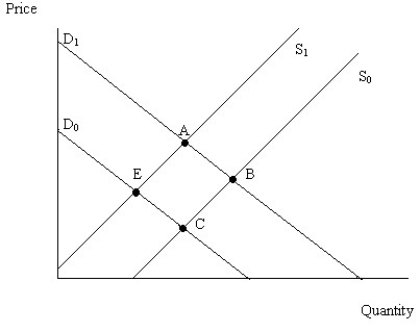
-Figure 4.6 illustrates a set of supply and demand curves for a product.If the good were inferior and the consumer's income decreases,then this can be illustrated as moving from point
A) A to B.
B) C to B.
C) E to B.
D) B to A.
Correct Answer:
Verified
Q253: Suppose that the Surgeon General releases a
Q254: Suppose that steak is a normal good.When
Q255: Suppose that ramen noodles are an inferior
Q256: Bananas and apples are substitutes.When the price
Q257: Suppose that the population of a country
Q259: Suppose that the price of fertilizer,an input
Q260: Peaches and cream are complements.When the price
Q261: Suppose that in 2015,12 million cars were
Q262: Suppose that in October the price of
Q263: Recall the Application about the decrease in
Unlock this Answer For Free Now!
View this answer and more for free by performing one of the following actions

Scan the QR code to install the App and get 2 free unlocks

Unlock quizzes for free by uploading documents