 FIGURE 6- 10
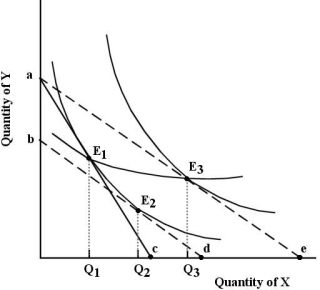
-Refer to Figure 6- 10. The line joining points E1 and E3 is known as , which shows how
.
A) an income consumption line; consumption changes as income changes, with relative prices held constant
B) a price consumption line; consumption changes as one price changes, with money income held constant
C) a price consumption line; consumption changes as money income and relative prices change
D) an income consumption line; consumption changes with changing relative prices and constant income
Correct Answer:
Verified
Q2:
Q3: The table below shows the total
Q4: If John consumes only two goods, A
Q6: Q8: Q9: Q10: Christine is allocating her household expenditure between Q11: The figures below show Chris's consumption of Q12: The diagram below shows a set of Q22: Unlock this Answer For Free Now! View this answer and more for free by performing one of the following actions Scan the QR code to install the App and get 2 free unlocks Unlock quizzes for free by uploading documents![]()
![]()
![]()
![]()

