Which of the alternatives best describes the pattern of scores graphed below? 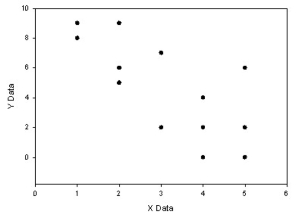
A) Strong positive linear correlation
B) Weak negative linear correlation
C) Strong curvilinear correlation
D) Weak positive linear correlation
Correct Answer:
Verified
Q5: The average of the cross-products of Z
Q6: A researcher discovers that if people eat
Q7: You are interested in the relation between
Q8: You conduct a study in which you
Q9: The dots on a scatter diagram seem
Q12: You take the sum of the cross-products
Q13: What is the difference between a positive
Q14: A correlation describes the relationship between two:
A)equal-interval
Q15: According to your text, Mirvis and Lawler
Q20: A graph that shows the pattern of
Unlock this Answer For Free Now!
View this answer and more for free by performing one of the following actions

Scan the QR code to install the App and get 2 free unlocks

Unlock quizzes for free by uploading documents