A shirt production company has tracked their sales of red and blue shirts over the past few years.The graph of both is shown below. 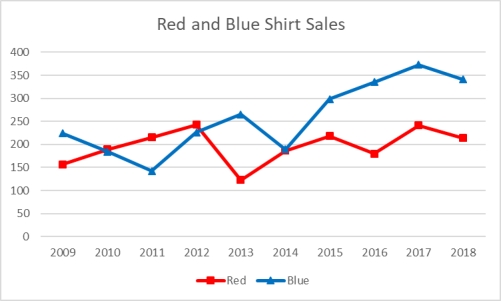 Which of the following is a true statement about the trends in sales?
A) Sales of red shirts are less than those of blue shirts in all the years before 2012.
B) Sales of blue shirts are trending upward from 2014 to 2017.
C) Sales of blue shirts are always higher than those of red shirts.
D) Red shirt sales show an increasing trend.
E) Sales of red shirts are always higher than those of blue shirts.
Correct Answer:
Verified
Q96: The following graphic of residential housing data
Q97: Consider a scatterplot showing the relationship between
Q98: The class mark is the _, and
Q99: A retail shoe company would like to
Q100: The following graphic of PCB Failures is
Q102: The following time-series data shows the
Q103: The following time-series data shows the
Q104: To show hourly sales throughout a day,
Q105: A shirt production company has tracked their
Q106: Monthly sales were tracked and shown on
Unlock this Answer For Free Now!
View this answer and more for free by performing one of the following actions

Scan the QR code to install the App and get 2 free unlocks

Unlock quizzes for free by uploading documents