Refer to the following graph. 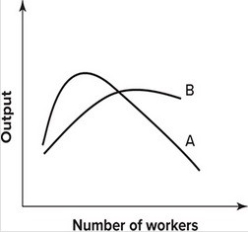 The marginal product and average product curves:
A) are A and B, respectively.
B) are B and A, respectively.
C) could be either A or B.
D) are not drawn properly.
Correct Answer:
Verified
Q136: Other things being equal, when average productivity
Q137: The following graph shows average fixed costs,
Q138: The following graph shows average fixed costs,
Q139: Refer to the following graph. 
Q140: Refer to the following graph.
Q142: If marginal cost exceeds average total cost:
A)
Q143: The minimum point of the average total
Q144: The marginal cost curve is a mirror
Q145: If the average cost of producing 10
Q146: The average variable cost curve is a
Unlock this Answer For Free Now!
View this answer and more for free by performing one of the following actions

Scan the QR code to install the App and get 2 free unlocks

Unlock quizzes for free by uploading documents